REITs, ETFs
Here’s why diversification may be a sound REIT investing strategy
By Beansprout • 12 Oct 2023 • 0 min read
The share price performance of Singapore REITs has been mixed so far this year. We find out why diversification may be a sound REIT investing strategy.

In this article
This post was created in partnership with Nikko Asset Management Asia Limited. All views and opinions expressed in this article are Beansprout's objective and professional opinions.
What happened?
Investors in Real Estate Investment Trusts (REITs) have seen mixed fortunes this year.
While a benchmark of Singapore REITs as measured by the iEdge S-REIT Index has declined by about 4% from January to August 2023, the returns of individual REITs have been widely divergent with interest rates expected to remain higher for longer. (Source: SGX)
For example, the performance of data centre REITs such as Keppel DC REIT has been strong, with a positive share price return of 23% year-to-date as of 31 August 2023 (Source: SGX)
On the other hand, the performance of US office REITs such as Manulife US REIT has been weak, with a share price decline of 77% year-to-date as of 31 August 2023 (Source: SGX)
With investors of REITs looking to own them to earn a stable dividend income, this inevitably leads to the question – Is there a way we can reduce the likelihood of such varied performance in our dividend portfolio?
Why diversification may help when investing in REITs
Before we look into various REIT investing strategies, we can take a look at what is driving the varied returns of the REITs.
By analysing the variations in returns over time, we generally see that the divergence performance may be mainly due to differences in the property and country segments they operate in, as well as their financial position.
#1 – Varied sector exposure may have led to differences in performance
REITs may own property assets across various segments, including office buildings, retail malls, industrial properties, and hotels.
With the uneven economic recovery post Covid-19, these segments appear to have seen mixed rental prospects over the past 12 months.
For example, the hotel segment has benefitted significantly from the global re-opening, with rising tourist arrivals and an improvement in hotel room rates. According to the Singapore Tourism Board, tourist arrivals into Singapore reached a multi-year high of 1.42 million in July 2023, close to double the number of arrivals a year ago. (Source: STB Singapore Tourism Analytics Network)
On the other hand, the office segment has faced more significant headwinds. According to property consultant JLL Research, the quarter-on-quarter growth in Singapore’s Grade A CBD rent tapered to just 0.2% in the second quarter of 2023. Furthermore, JLL Research expects rents to correct in the second half of 2023 with a slowdown in demand.
This may have led to weakness in the performance of REITs with office exposure compared to hospitality exposure. According to Beansprout’s estimates, office REITs fell by 17% on average, lagging the returns of hospitality REITs which generated a return of 6% on average year-to-date.
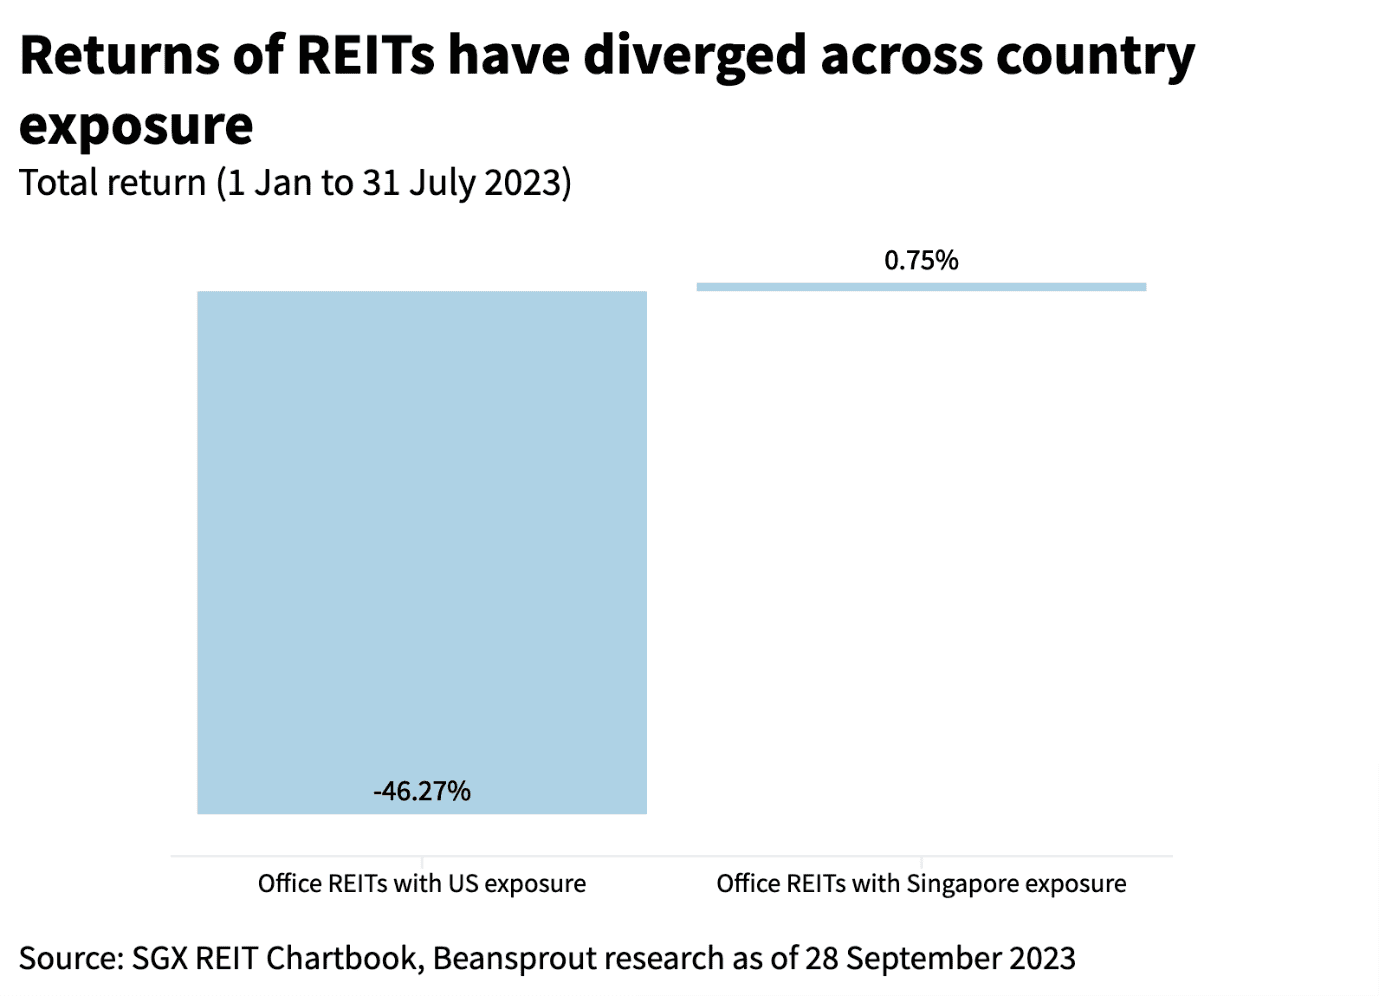
#2 – Varied country exposure may have led to differences in exposure
Apart from exposure to different property segments, REITs may also have varied exposure to different countries and markets.
Taking the office segment as an example, the occupancy of office assets in Singapore has held up significantly better than office assets in the US. This may be due to differences in the economic prospects in different markets, as well as the impact of structural changes such as the preference for employees to continue working from home (WFH).
According to Knight Frank, the occupancy rate of Grade A core CBD offices at Raffles Place in Singapore was 95.8% in the second quarter of 2023, even with slowing economic growth and inflationary pressures.
On the other hand, the occupancy rate of office buildings in the US is just 76% on average, with the occupancy in some states such as San Francisco falling to 65%.
This could be why performance of US office REITs were weaker compared to REITs with Singapore office exposure. According to Beansprout’s estimates, REITs with Singapore office exposure rose by 1% on average, significantly above the returns of US office REITs which declined by 46% year-to-date.
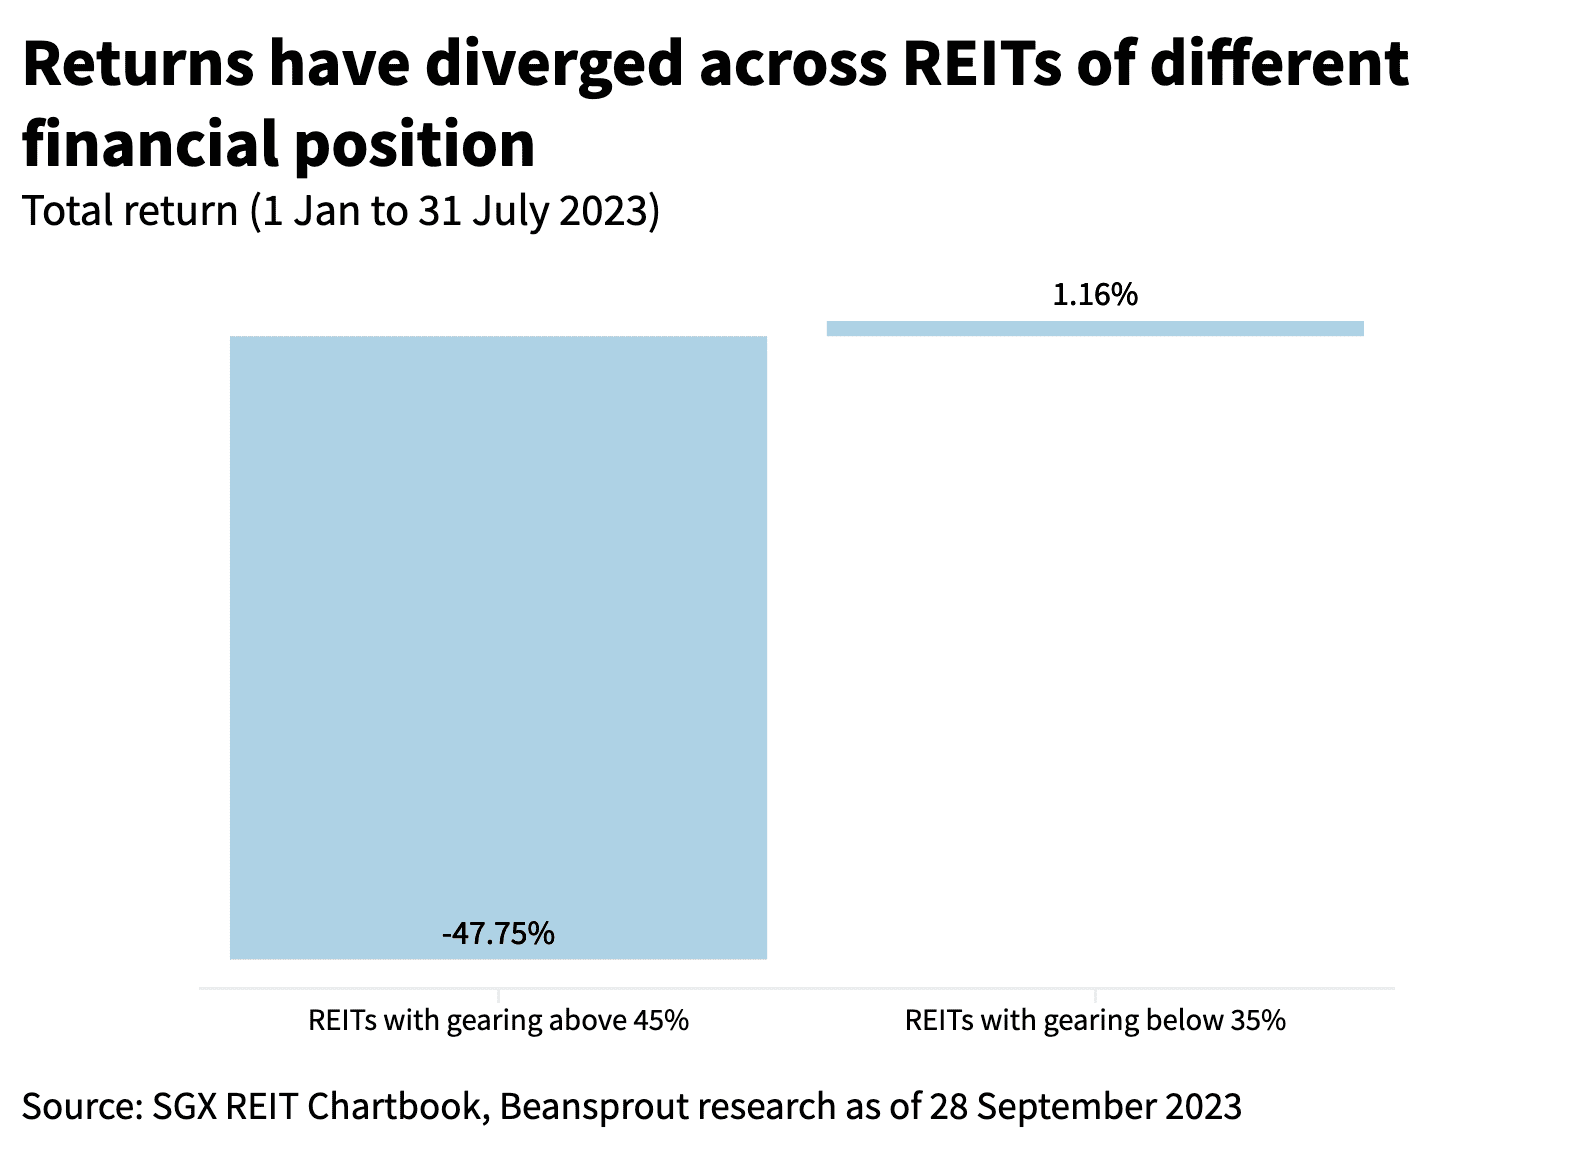
#3 – Varied financial position may have led to differences in performance
Lastly, with the significant interest rate hikes, REITs in a strong financial position with relatively low levels of debt have seen more resilience in their distributions, as interest expenses have not increased as much.
According to Beansprout’s estimates, REITs with a gearing ratio^ of above 45% declined by 48% on average year-to-date, while REITs with a gearing ratio of below 35% generated a positive return of 1% year-to-date.
How to diversify when investing in REITs
From the above examples, we can possibly see why the performance of REITs has been so varied over the past few months. Clearly, differences in the segment and country exposures as well as financial position can make a difference in the returns of the REIT.
We can perform our own analysis to pick the REITS that we believe can do well based on the property assets that they own and their financial strength. However, this may take time and significant research.
Alternatively, we can also choose to invest in a broad-based portfolio of REITs to gain diversified exposure and reduce market risks. By investing in many different REITs, our overall return would be less dependent on any one single REIT investment.
For example, if we have ten REITs in our portfolios, of which nine REITs generated a positive return of 10% and one REIT generated a negative return of 80%, we will still see a slightly positive return across our entire portfolio.
This can be done through an exchange traded fund (ETF) such as the NikkoAM-StraitsTrading Asia Ex Japan REIT ETF
Introducing the NikkoAM-StraitsTrading Asia Ex Japan REIT ETF
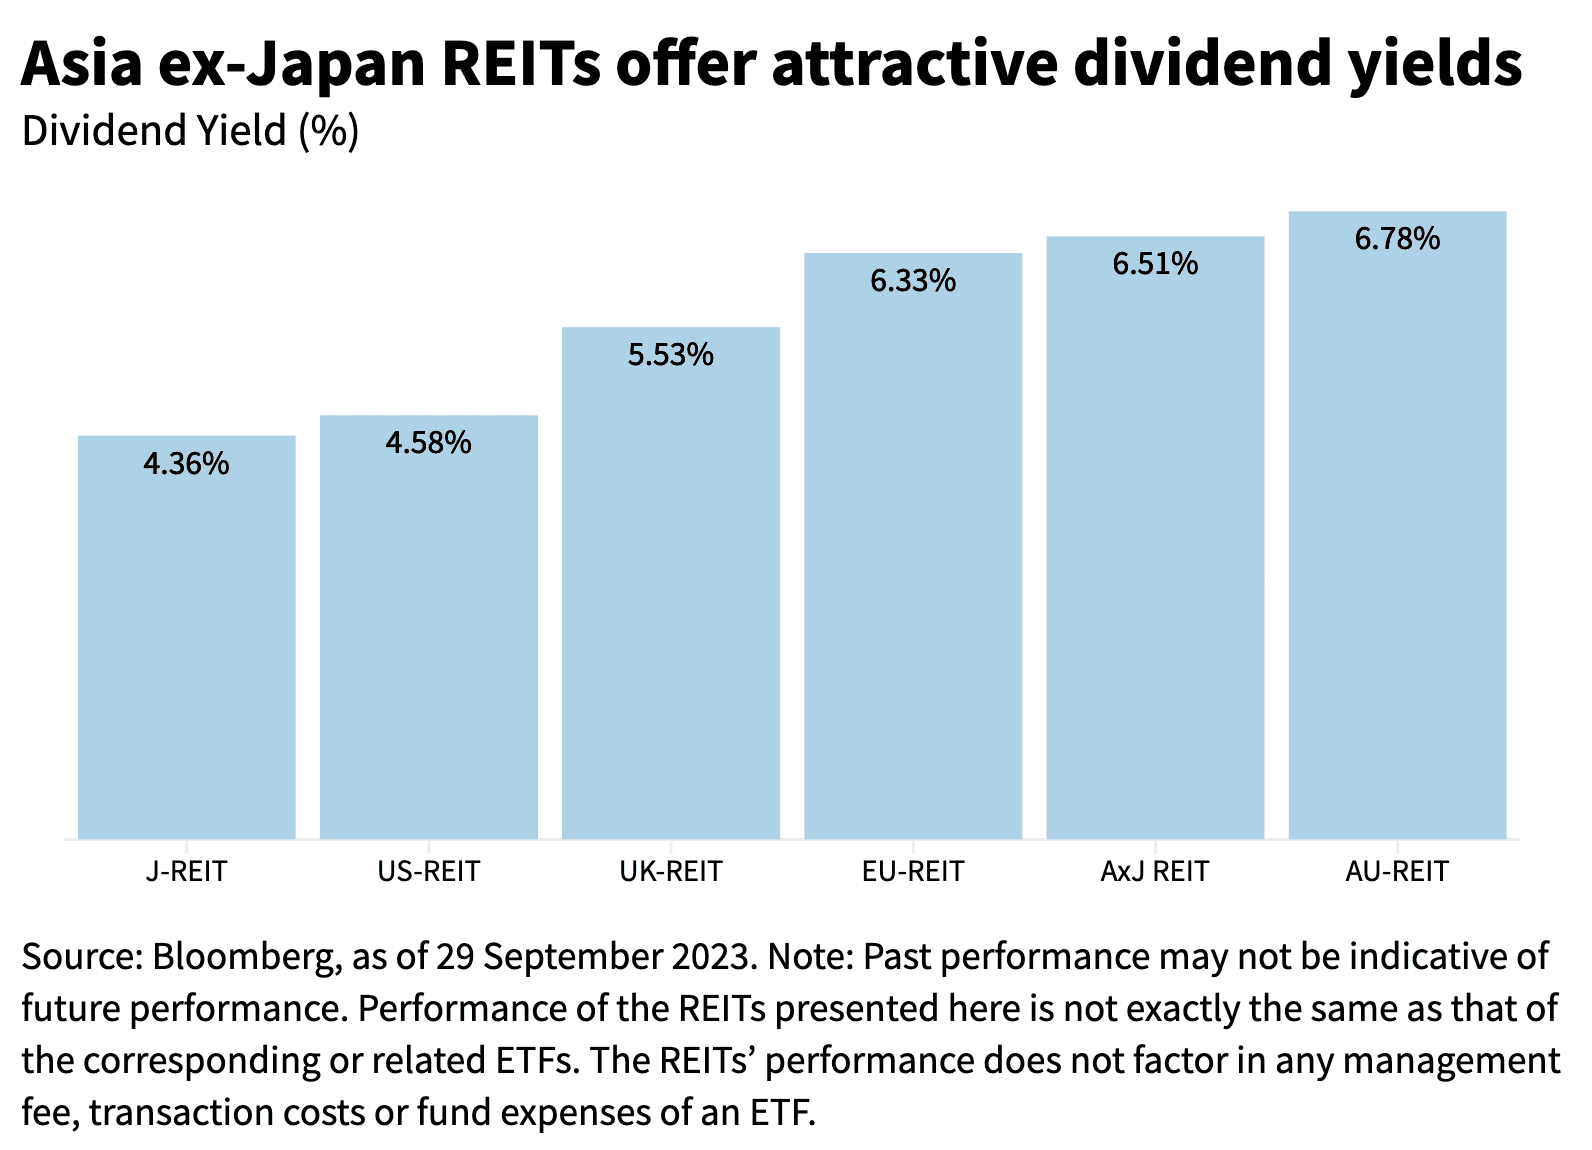
The NikkoAM-StraitsTrading Asia ex Japan REIT ETF offers investors easy access to a diversified portfolio of high quality regional REITs with some of the most attractive yields across the world.
#Refer to the footnote for more information on the indices
Based on its holdings as of 31 July 2023, this would include familiar REIT names such as CapitaLand Ascendas REIT and CapitaLand Integrated Commercial Trust. In addition, it also holds REITs listed outside of Singapore such as Link REIT.
| Top 10 Holdings as of 31 July 2023 | Weight as of 31 July 2023 |
| CapitaLand Ascendas REIT | 10.5% |
| CapitaLand Integrated Commercial Trust | 10.3% |
| Link REIT | 9.0% |
| Mapletree Logistics Trust | 7.1% |
| Mapletree Industrial Trust | 5.5% |
| Mapletree Pan Asia Commercial Trust | 4.8% |
| Frasers Logistics & Commercial Trust | 4.4% |
| Embassy Office Parks REIT | 3.9% |
| Keppel DC REIT | 3.6% |
| Suntec REIT | 3.5% |
| Source: NikkoAM as of 31 July 2023 | |
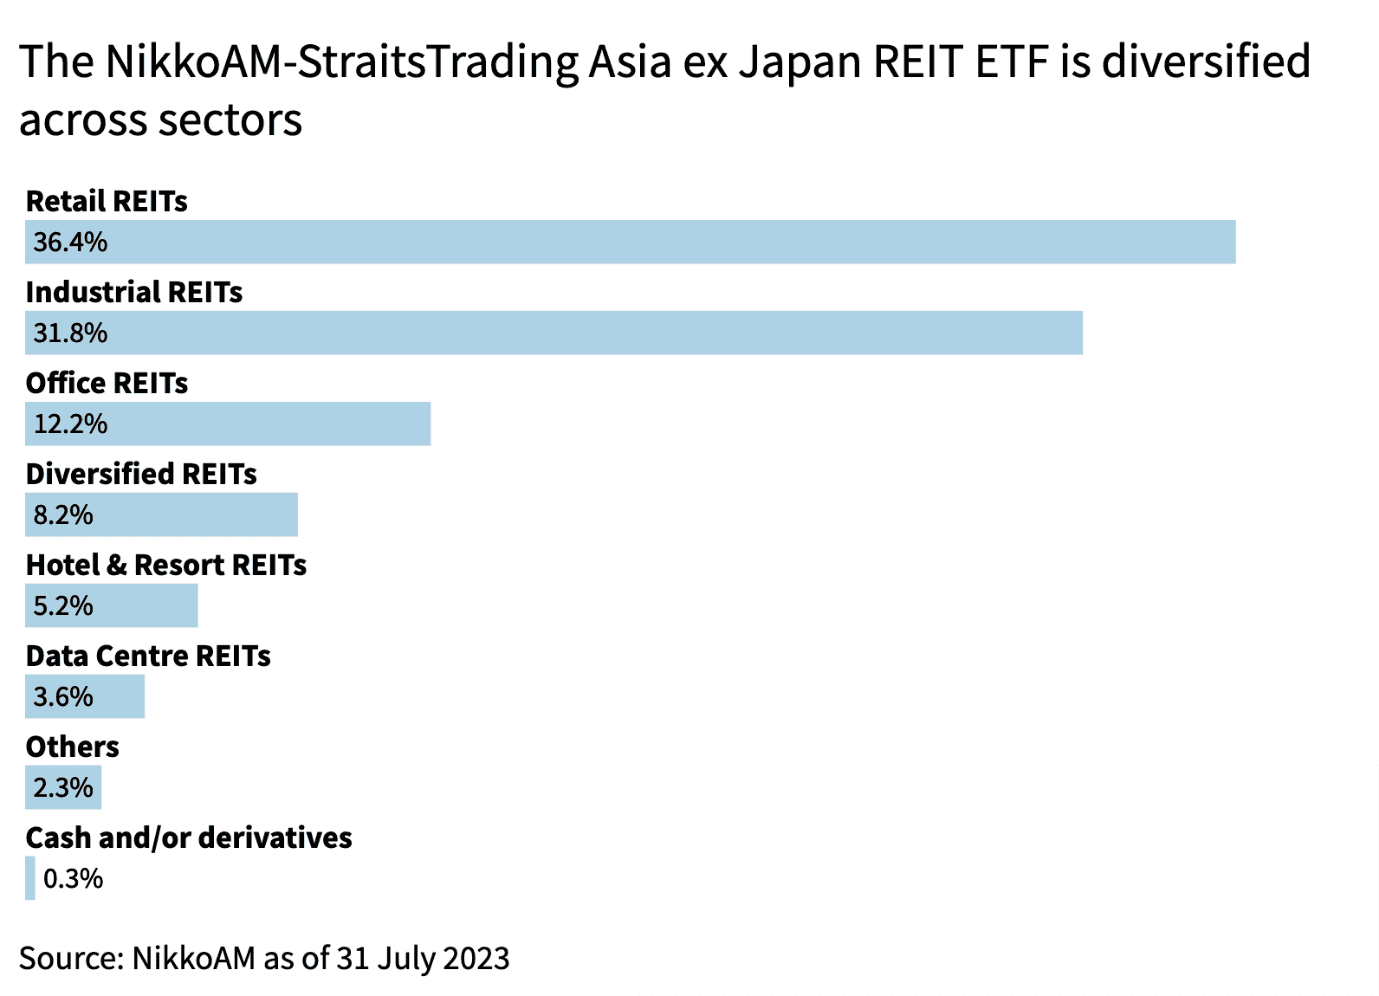
The NikkoAM-StraitsTrading Asia ex Japan REIT ETF offers exposure to diverse properties such as retail malls, office buildings, industrial properties and hotels. As of 31 July 2023, retail REITs represented about 36% of its holdings, while industrial REITs represented about 32% of its holdings (Source: Nikko AM).
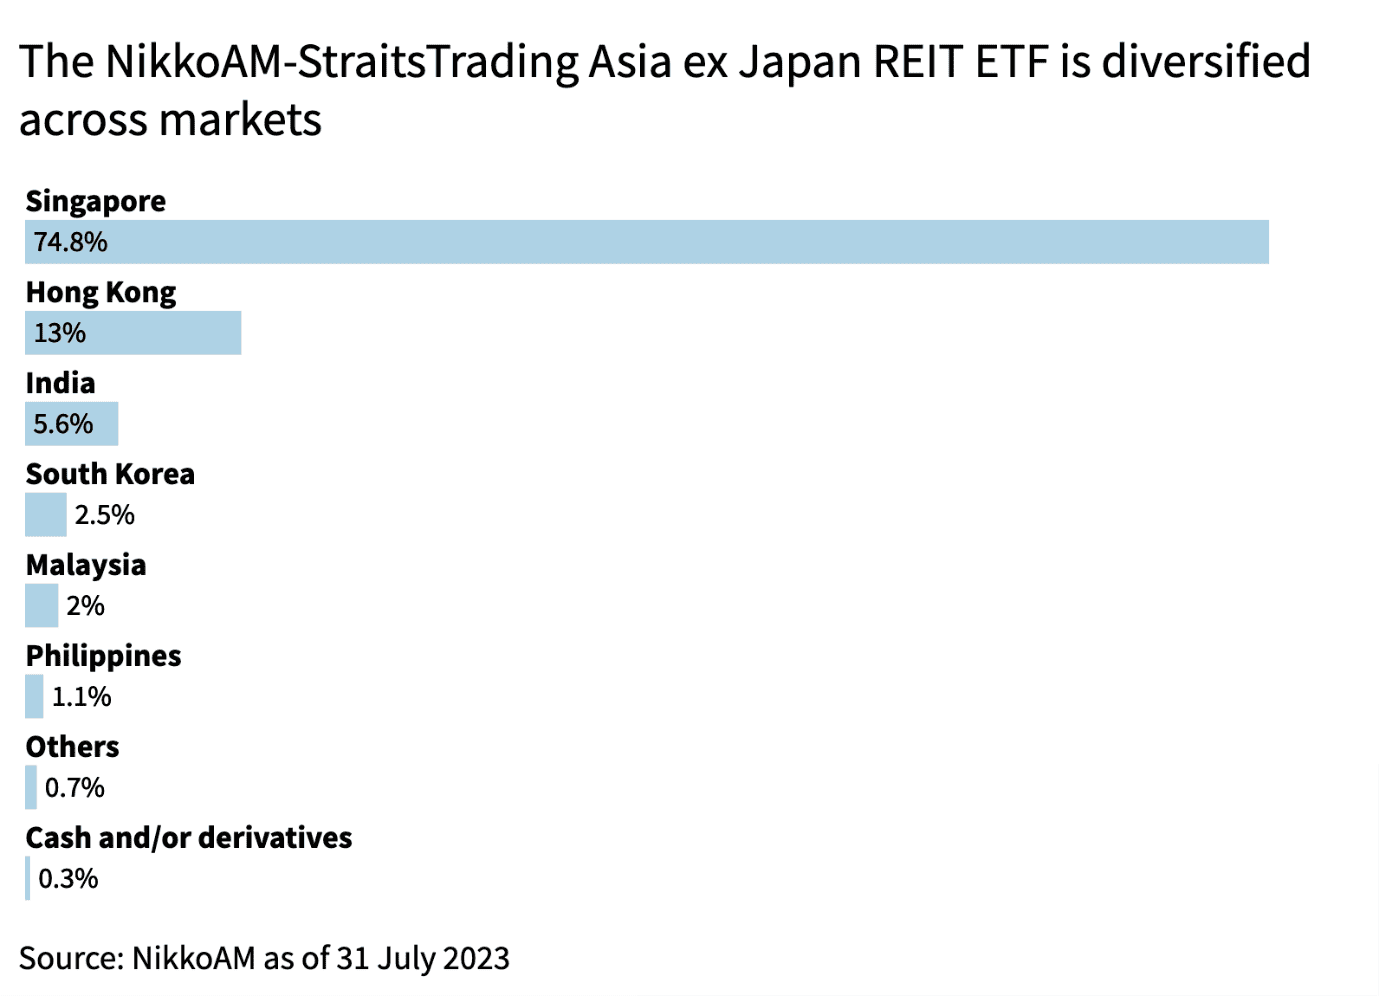
Apart from being diversified across property segments, the NikkoAM-StraitsTrading Asia ex Japan REIT ETF is also diversified across geographies. As of 31 July 2023, Singapore represents about 75% of the ETF, while Hong Kong represents about 13% (Source: Nikko AM).
The NikkoAM-StraitsTrading Asia ex Japan REIT ETF has a fund size of S$396 million as of 31 July 2023 (Source: Nikko AM), making it the largest REIT ETF in Singapore based on its assets under management.
It has the lowest expense ratio amongst the Singapore-listed REIT ETFs of 0.55% per annum (Source: Beansprout research).
Also, the NikkoAM-StraitsTrading Asia ex Japan REIT ETF is the only Singapore-listed REIT ETF that pays out distributions* on a quarterly basis (Source: Beansprout research).
What are the risks of investing in a REIT ETF?
All investments involve risks, and investing in a REIT ETF is no exception. Despite the benefits that may come through from diversification, there is still a possibility that you may lose your principal or capital invested.
In particular, the US Federal Reserve has signalled that interest rates may stay higher for longer. As a result, the distributions of REITs may be impacted if they are not able to generate a higher property income to offset the higher borrowing costs.
The distributions of REITs with overseas assets may also be impacted from a weakening in foreign currencies compared to the Singapore dollar. However, the diversification benefit of a ETF may partly help to mitigate the negative foreign currency impact of individual REITs.
What would Beansprout do?
With the economic outlook remaining uncertain and interest rates expected to stay high, the performance of REITs could remain divergent.
Hence, it is important for REIT investors to thoroughly analyse each REIT’s property assets and financial position.
If you would still like to gain exposure to the REIT sector without having to select individual REITs, a REIT ETF will allow you to get access to a diversified portfolio of REITs. You would still have to monitor the performance of the ETF, but it’s definitely a lot less work than scrutinising the financial statements of the REITs.
As shared before, the NikkoAM-StraitsTrading Asia ex Japan REIT ETF has the lowest expense ratio amongst Singapore-listed REIT ETFs and is the only one that pays out a quarterly distribution*.
To further reduce the volatility of your investments, you can smooth out your investment by applying a dollar-cost averaging approach using a regular savings plan.
Click here to find out more about the NikkoAM-StraitsTrading Asia ex Japan REIT ETF.
Footnotes:
^ Gearing ratio is a measurement of the amount of financial leverage a REIT has, and is calculated using its total borrowings over its total assets.
* Distributions are not guaranteed and are at the absolute discretion of the Managers. If the investment income is insufficient to fund a distribution for the Fund, the Managers may determine that such distributions should be paid from the capital of the Fund. Any distribution is expected to result in an immediate reduction of the Fund’s net asset value per unit. Please refer to the Fund Prospectus and Product Highlights Sheet for further details.
# The dividend yield for AxJ REIT is based on the FTSE EPRA Nareit Asia ex Japan REITs Index which represents REITs from China, Hong Kong, India, Indonesia, Malaysia, Pakistan, Philippines, Singapore, South Korea, Taiwan and Thailand.
The dividend yield for EU REIT is based on the FTSE EPRA Nareit Europe REITs Index which represents REITs from Austria, Belgium, Finland, France, Germany, Ireland, Italy, the Netherlands, Norway, Spain, Sweden, Switzerland and UK.
Table of Indices:
AXJ REIT | FTSE EPRA Nareit Asia ex Japan REITs Index |
J REIT | FTSE EPRA Nareit Developed REITs JAPAN Index USD |
AU REIT | FTSE EPRA Nareit Developed REITs AUSTRALIA Index USD |
US REIT | FTSE EPRA/NAREIT United States Index |
EU REIT | FTSE EPRA Nareit Europe REITs Index USD |
UK REIT | FTSE EPRA Nareit UK REITs USD |
Important Information by Nikko Asset Management Asia Limited
This document is purely for informational purposes only with no consideration given to the specific investment objective, financial situation and particular needs of any specific person. It should not be relied upon as financial advice. Any securities mentioned herein are for illustration purposes only and should not be construed as a recommendation for investment. You should seek advice from a financial adviser before making any investment. In the event that you choose not to do so, you should consider whether the investment selected is suitable for you. Investments in funds are not deposits in, obligations of, or guaranteed or insured by Nikko Asset Management Asia Limited (“Nikko AM Asia”).
Past performance or any prediction, projection or forecast is not indicative of future performance. The Fund or any underlying fund may use or invest in financial derivative instruments. The value of units and income from them may fall or rise. Investments in the Fund are subject to investment risks, including the possible loss of principal amount invested. You should read the relevant prospectus (including the risk warnings) and product highlights sheet of the Fund, which are available and may be obtained from appointed distributors of Nikko AM Asia or our website (www.nikkoam.com.sg) before deciding whether to invest in the Fund.
The information herein may not be copied, reproduced or redistributed without the express consent of Nikko AM Asia. Reasonable care has been taken to ensure the accuracy of the information, but Nikko AM Asia does not give any warranty or representation, and expressly disclaims liability for any errors or omissions. Information may be subject to change without notice. Nikko AM Asia accepts no liability for any loss, indirect or consequential damages, arising from any use of or reliance on this document. This advertisement has not been reviewed by the Monetary Authority of Singapore.
The performance of the ETF’s price on the Singapore Exchange Securities Trading Limited (“SGX-ST”) may be different from the net asset value per unit of the ETF. The ETF may also be suspended or delisted from the SGX-ST. Listing of the units does not guarantee a liquid market for the units. Investors should note that the ETF differs from a typical unit trust and units may only be created or redeemed directly by a participating dealer in large creation or redemption units.
The Central Provident Fund (“CPF”) Ordinary Account (“OA”) interest rate is the legislated minimum 2.5% per annum, or the 3-month average of major local banks' interest rates, whichever is higher, reviewed quarterly. The interest rate for Special Account (“SA”) is currently 4% per annum or the 12-month average yield of 10-year Singapore Government Securities plus 1%, whichever is higher, reviewed quarterly. Only monies in excess of $20,000 in OA and $40,000 in SA can be invested under the CPF Investment Scheme (“CPFIS”). Please refer to the website of the CPF Board for further information. Investors should note that the applicable interest rates for the CPF accounts and the terms of CPFIS may be varied by the CPF Board from time to time.
The units of NikkoAM-StraitsTrading Asia ex Japan REIT ETF are not in any way sponsored, endorsed, sold or promoted by FTSE International Limited ("FTSE''), by the London Stock Exchange Group companies ("LSEG''), Euronext N.V. ("Euronext"), European Public Real Estate Association ("EPRA"), or the National Association of Real Estate Investment Trusts ("NAREIT") (together the "Licensor Parties") and none of the Licensor Parties make any warranty or representation whatsoever, expressly or impliedly, either as to the results to be obtained from the use of the FTSE EPRA/NAREIT Asia ex Japan Net Total Return REIT Index (the "Index") and/or the figure at which the said Index stands at any particular time on any particular day or otherwise. The Index is compiled and calculated by FTSE. However, none of the Licensor Parties shall be liable (whether in negligence or otherwise) to any person for any error in the Index and none of the Licensor Parties shall be under any obligation to advise any person of any error therein. "FTSE®" is a trade mark of LSEG, "NAREIT®" is a trade mark of the National Association of Real Estate Investment Trusts and "EPRA®" is a trade mark of EPRA and all are used by FTSE under licence."
Nikko Asset Management Asia Limited. Registration Number 198202562H.
This article was first published on 12 October 2023 .
Read also
Gain financial insights in minutes
Subscribe to our free weekly newsletter for more insights to grow your wealth
 Comments
0 comments