REITs • 11 Nov 2026
Compare distribution yields, valuations and debt levels across Singapore REITs.
Updated on 11 Nov 2026
39 REITs
Name | Price | Consensus Share Price Target | Upside/Downside | Forward dividend yield | P/B | 1 Year return | Gearing ratio | Sector |
|---|---|---|---|---|---|---|---|---|
| Acrophyte Hospitality Trust (Formerly ARA US Hospitality Trust) SGX: XZL | USD 0.23 | 0.25 | +11.1% | 1.8% | 0.33 | -15.1% | 43.2% | Hospitality |
| AIMS APAC REIT SGX: O5RU | SGD 1.37 | 1.63 | +19.0% | 7.3% | 1.07 | -3.5% | 24.9% | Industrial |
| Alpha Integrated REIT SGX: M1GU | SGD 0.49 | N/A | N/A | 8.2% | 0.92 | +2.1% | 34.9% | Industrial |
| BHG Retail REIT SGX: BMGU | SGD 0.47 | N/A | N/A | 0.4% | 0.65 | +6.8% | 40.1% | Retail |
| CapitaLand Ascendas REIT SGX: A17U | SGD 2.23 | 2.96 | +32.9% | 6.9% | 0.98 | -21.2% | 39.7% | Large Cap |
| CapitaLand Ascott Trust SGX: HMN | SGD 0.84 | 0.94 | +11.5% | 7.1% | 0.73 | -10.6% | 37.7% | Hospitality |
| CapitaLand China Trust SGX: AU8U | SGD 0.62 | 0.71 | +16.1% | 8.1% | 0.59 | -23.6% | 40.4% | Diversified |
| CapitaLand India Trust SGX: CY6U | SGD 0.90 | 1.25 | +38.3% | 8.7% | 0.73 | -25.0% | 38.0% | Diversified |
| CDL Hospitality Trusts SGX: J85 | SGD 0.70 | 0.80 | +14.5% | 7.1% | 0.51 | -15.2% | 35.3% | Hospitality |
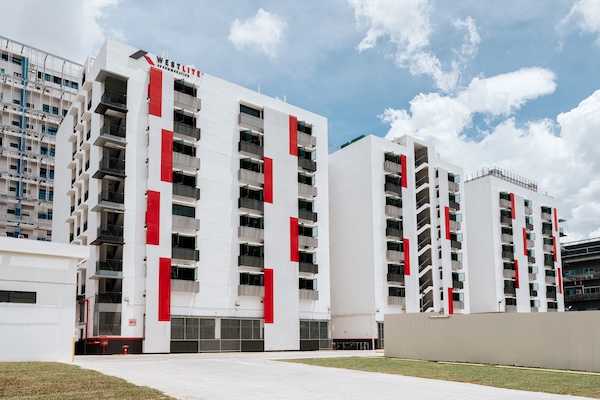
| Centurion Accommodation REIT SGX: 8C8U | SGD 1.05 | 1.32 | +25.9% | 6.9% | 1.20 | +1.0% | 29.9% | Hospitality |
| CICT: CapitaLand Integrated Commercial Trust SGX: C38U | SGD 2.34 | 2.63 | +12.4% | 5.1% | 1.09 | -0.8% | 37.4% | Large Cap |
| Daiwa House Logistics Trust SGX: DHLU | SGD 0.43 | 0.44 | +2.3% | 9.3% | 0.69 | -25.2% | 40.1% | Industrial |
| Digital Core REIT SGX: DCRU | USD 0.46 | 0.68 | +50.3% | 8.0% | 0.57 | -9.0% | 39.2% | Industrial |
| Elite UK REIT SGX: MXNU | GBP 0.30 | 0.40 | +33.3% | 10.0% | 0.68 | -16.7% | 40.7% | Office |
| ESR REIT SGX: 9A4U | SGD 2.05 | 2.84 | +38.5% | 10.7% | 0.82 | -26.3% | 41.4% | Industrial |
| Far East Hospitality Trust SGX: Q5T | SGD 0.51 | 0.65 | +28.2% | 7.0% | 0.58 | -15.7% | 32.8% | Hospitality |
| First REIT SGX: AW9U | SGD 0.18 | 0.23 | +31.4% | 11.4% | 0.76 | -36.4% | 45.7% | Healthcare |
| Frasers Centrepoint Trust SGX: J69U | SGD 2.14 | 2.50 | +16.6% | 5.6% | 0.92 | -6.1% | 40.0% | Retail |
| Frasers Logistics & Commercial Trust SGX: BUOU | SGD 0.89 | 1.01 | +13.8% | 6.8% | 0.81 | -7.8% | 35.4% | Large Cap |
| IREIT Global SGX: UD1U | SGD 0.16 | 0.25 | +50.4% | 6.1% | 0.36 | -43.8% | 45.5% | Office |
| Keppel DC REIT SGX: AJBU | SGD 2.17 | 2.56 | +18.1% | 3.7% | 1.26 | -9.6% | 34.0% | Large Cap |
| Keppel REIT SGX: K71U | SGD 0.83 | 0.93 | +11.8% | 6.3% | 0.67 | -21.7% | 40.0% | Office |
| KORE US REIT SGX: CMOU | USD 0.15 | 0.26 | +79.1% | 6.8% | 0.21 | -37.4% | 43.3% | Office |
| Landmark REIT SGX: D5IU | SGD 0.01 | N/A | N/A | N/A | 0.28 | -50.0% | 39.6% | Retail |
| Lendlease Global Commercial REIT SGX: JYEU | SGD 0.55 | 0.71 | +30.3% | 7.3% | 0.78 | -12.1% | 38.9% | Diversified |
| Manulife US REIT SGX: BTOU | USD 0.03 | 0.06 | +86.4% | N/A | 0.17 | -56.0% | 54.1% | Office |
| Mapletree Industrial Trust SGX: ME8U | SGD 1.73 | 1.89 | +9.5% | 6.9% | 1.07 | -15.2% | 37.5% | Large Cap |
| Mapletree Logistics Trust SGX: M44U | SGD 1.10 | 1.29 | +17.3% | 6.4% | 0.87 | -16.0% | 40.5% | Large Cap |
| Mapletree Pan Asia Commercial Trust SGX: N2IU | SGD 1.15 | 1.43 | +24.3% | 7.0% | 0.66 | -21.2% | 37.7% | Large Cap |
| NTT DC REIT SGX: NTDU | USD 0.90 | 1.21 | +33.9% | 8.7% | 0.78 | -10.9% | 31.0% | Industrial |
| OUE REIT SGX: TS0U | SGD 0.35 | 0.43 | +22.9% | 7.1% | 0.63 | +1.4% | 41.5% | Diversified |
| Parkway Life REIT SGX: C2PU | SGD 4.02 | 4.72 | +17.5% | 4.0% | 1.56 | +0.2% | 33.8% | Healthcare |
| Prime US REIT SGX: OXMU | USD 0.11 | 0.25 | +125.0% | 9.1% | 0.21 | -45.0% | 44.9% | Office |
| Sasseur REIT SGX: CRPU | SGD 0.62 | 0.88 | +41.9% | 11.3% | 0.75 | -8.8% | 25.6% | Retail |
| Starhill Global REIT SGX: P40U | SGD 0.49 | 0.63 | +30.4% | 8.2% | 0.68 | -16.4% | 35.8% | Retail |
| Stoneweg Europe Stapled Trust SGX: SET | EUR 1.47 | 1.92 | +30.3% | 8.8% | 0.73 | -3.9% | 43.3% | Diversified |
| Suntec REIT SGX: T82U | SGD 1.37 | 1.53 | +11.4% | 5.8% | 0.67 | 0.0% | 43.0% | Diversified |
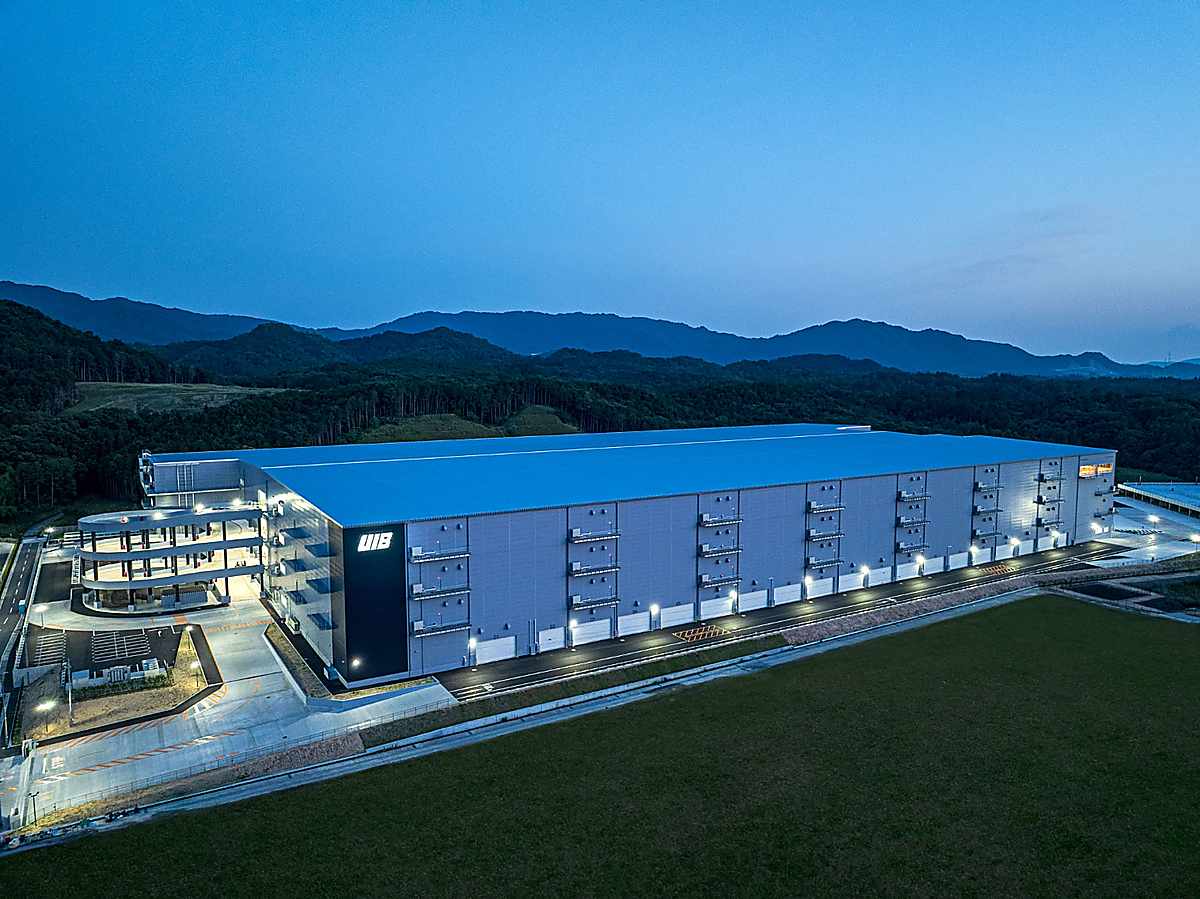
| UI Boustead REIT SGX: UIBU | SGD 0.77 | 1.01 | +32.5% | 8.5% | 0.90 | -5.0% | 36.4% | Industrial |
| United Hampshire US REIT SGX: ODBU | USD 0.44 | 0.67 | +54.0% | 9.2% | 0.60 | -12.1% | 40.4% | Retail |
Dive deeper into key metrics and compare Singapore REITs side by side.
Compare REITsOur perspective on the sector.
No sector view is currently available for REITs.
The research and perspectives behind the sector.
REITs • 11 Nov 2026
REITs • 06 Nov 2026
Stocks • 29 Oct 2026
REITs • 21 Oct 2026

REITs • 08 Oct 2025