DFI Retail Group in focus: Weekly Review with SIAS
Stocks
Powered by
By Gerald Wong, CFA • 08 Dec 2025
Why trust Beansprout? We’ve been awarded Best Investment Website at the SIAS Investors’ Choice Awards 2025
'%3e%3cpath%20fill-rule='evenodd'%20clip-rule='evenodd'%20d='M17.64%209.20455C17.64%208.56637%2017.5827%207.95273%2017.4764%207.36364H9V10.845H13.8436C13.635%2011.97%2013.0009%2012.9232%2012.0477%2013.5614V15.8195H14.9564C16.6582%2014.2527%2017.64%2011.9455%2017.64%209.20455V9.20455Z'%20fill='%234285F4'/%3e%3cpath%20fill-rule='evenodd'%20clip-rule='evenodd'%20d='M9%2018C11.43%2018%2013.4673%2017.1941%2014.9564%2015.8195L12.0477%2013.5614C11.2418%2014.1014%2010.2109%2014.4205%209%2014.4205C6.65591%2014.4205%204.67182%2012.8373%203.96409%2010.71H0.957275V13.0418C2.43818%2015.9832%205.48182%2018%209%2018V18Z'%20fill='%2334A853'/%3e%3cpath%20fill-rule='evenodd'%20clip-rule='evenodd'%20d='M3.96409%2010.71C3.78409%2010.17%203.68182%209.59318%203.68182%209C3.68182%208.40682%203.78409%207.83%203.96409%207.29V4.95818H0.957273C0.347727%206.17318%200%207.54773%200%209C0%2010.4523%200.347727%2011.8268%200.957273%2013.0418L3.96409%2010.71V10.71Z'%20fill='%23FBBC05'/%3e%3cpath%20fill-rule='evenodd'%20clip-rule='evenodd'%20d='M9%203.57955C10.3214%203.57955%2011.5077%204.03364%2012.4405%204.92545L15.0218%202.34409C13.4632%200.891818%2011.4259%200%209%200C5.48182%200%202.43818%202.01682%200.957275%204.95818L3.96409%207.29C4.67182%205.16273%206.65591%203.57955%209%203.57955V3.57955Z'%20fill='%23EA4335'/%3e%3c/g%3e%3cdefs%3e%3cclipPath%20id='clip0_0_2849'%3e%3crect%20width='18'%20height='18'%20fill='white'/%3e%3c/clipPath%3e%3c/defs%3e%3c/svg%3e)
Make Beansprout your preferred source on Google
Add us on Google to see more of our insights in your search results
We share about DFI Retail Group in the latest Weekly Market Review.

What happened?
In this week's Weekly Market Review in partnership with Securities Investors Association Singapore (SIAS), we discuss key developments in the global equity market alongside DFI Retail Group.
Watch the video to learn more about what we are looking out for this week.
Weekly Market Review
Macro Update
- Global markets saw modest gains over the past week, with the S&P 500 rising 0.3 percent and the Nasdaq up 0.9 percent on continued strength in technology stocks.
- Singapore’s STI also edged higher to 4,531 points, recording a 0.2 percent increase for the week.
- The positive sentiment was driven by growing expectations of a Federal Reserve rate cut at the upcoming 10 December meeting, with the probability of a cut climbing to about 86 percent from below 50 percent just two weeks earlier.
- This shift in expectations supported equity markets across the US and Singapore.
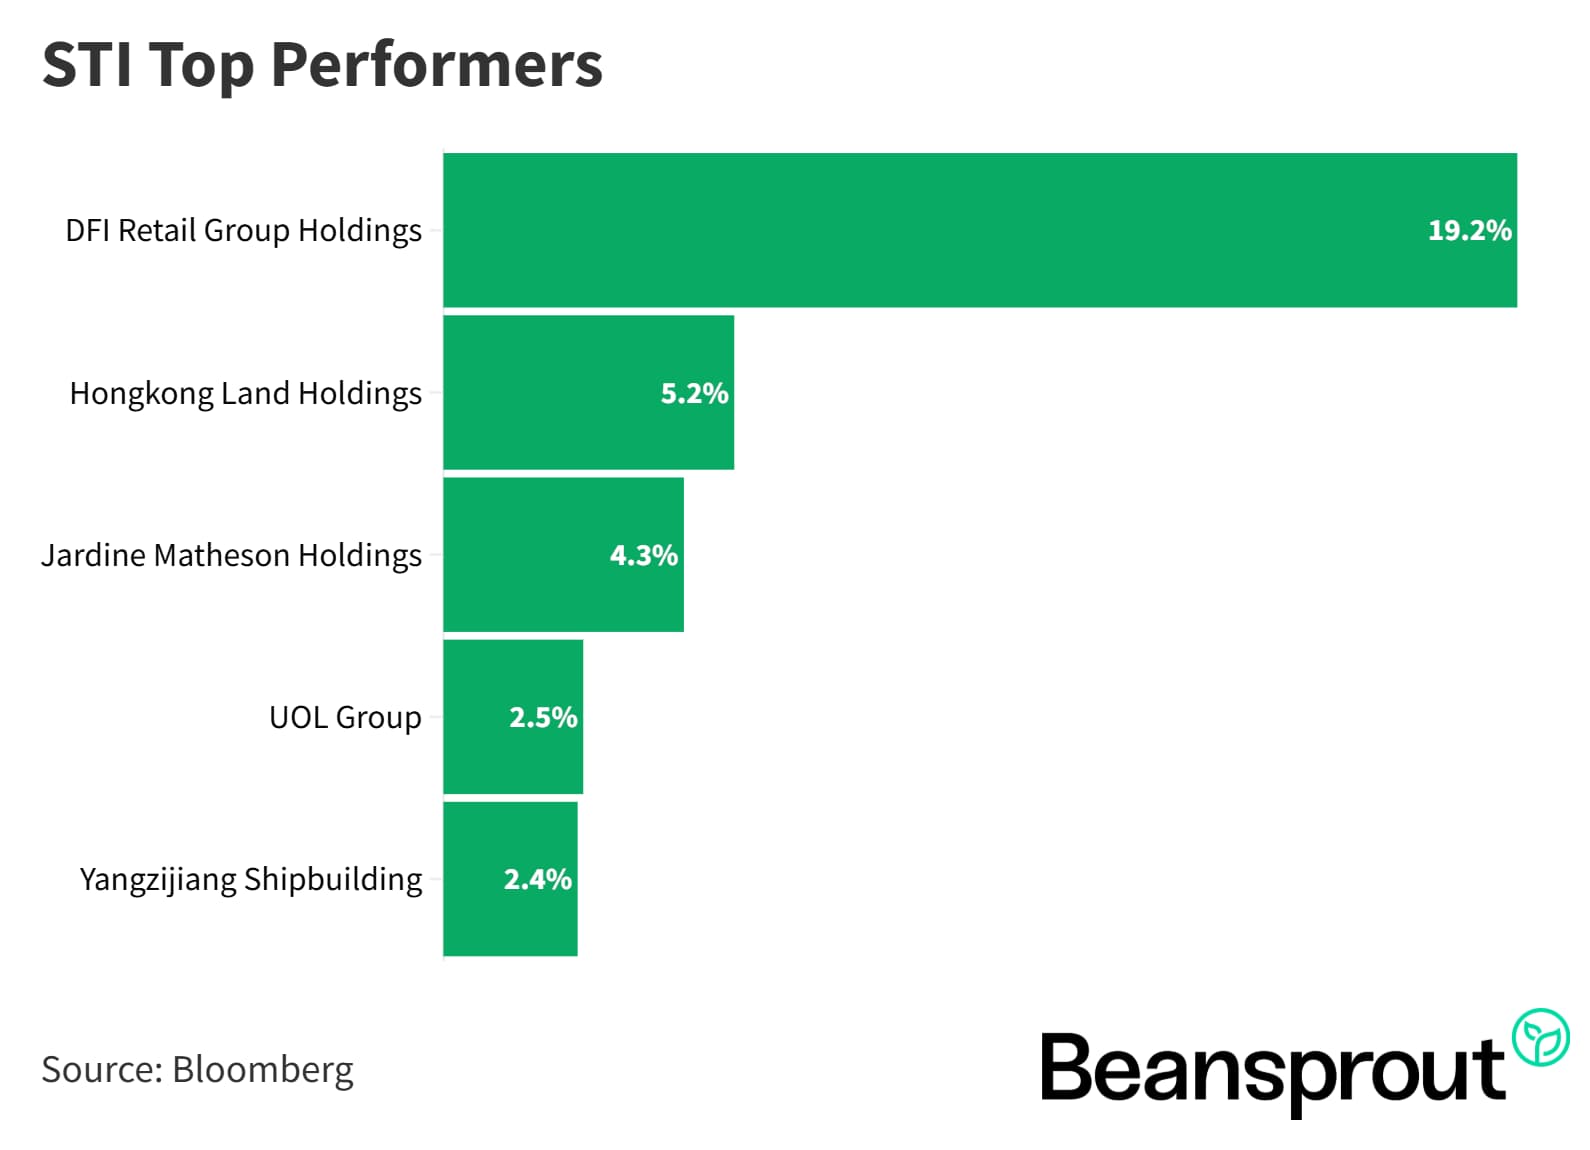
STI Top Performers:
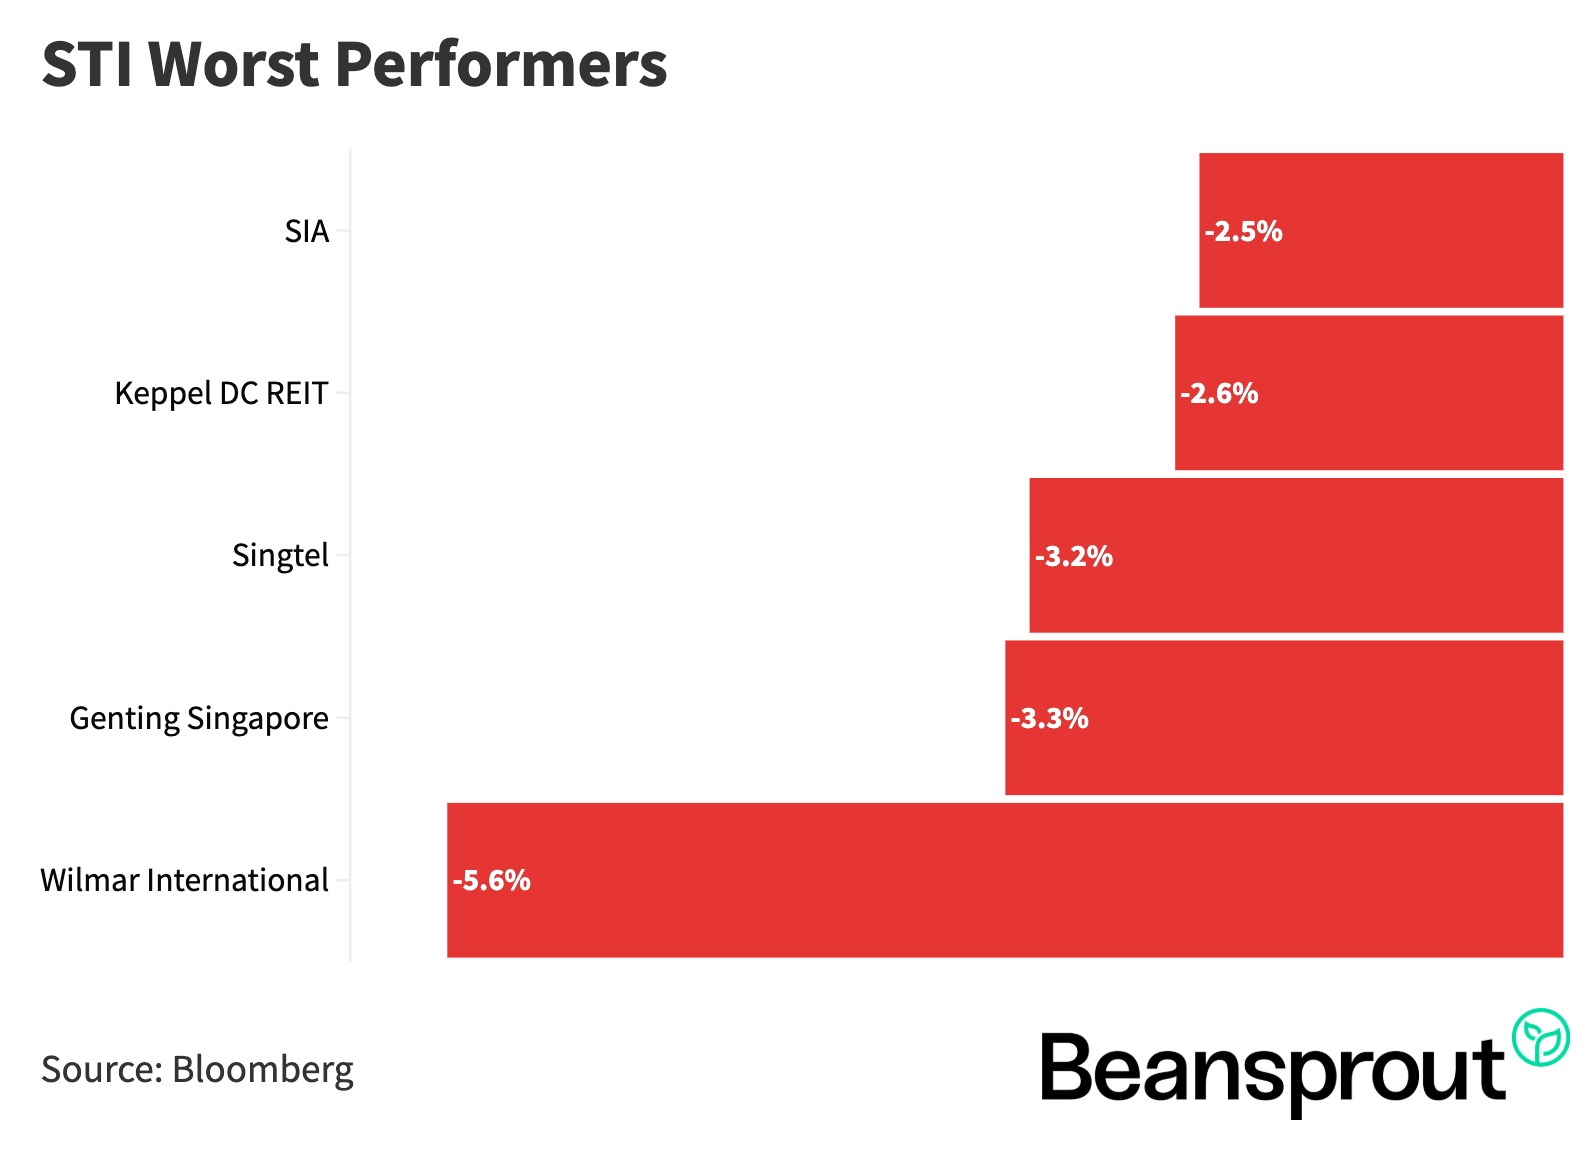
STI Worst Performers:
DFI Retail Group (SGX: D01)
- DFI Retail Group was one of the strongest performers on the STI this year, supported by strategic restructuring and improved profitability across its retail formats.
- The group operates familiar consumer brands such as Guardian and 7-Eleven in Singapore, and Mannings and 7-Eleven in Hong Kong, totaling 7,400 outlets across 12 Asian markets.
- It holds leading market positions, including No.1 in Hong Kong health and beauty, No.2 in Singapore and Malaysia health and beauty, No.1 in Hong Kong and Cambodia food retail, and No.1 in convenience stores across Hong Kong, Singapore and Macao.
- Revenue of about US$9B is diversified across food (36%), health and beauty (28%), convenience (28%), and home furnishings (8%).
- Total shareholder return reached 83 percent year-to-date including its special dividend, outperforming the STI, Hang Seng Index and S&P 500.
- Portfolio optimisation included divesting Yonghui Superstores, Robinson Retail and its Singapore food business, while refocusing on growth segments and margin expansion through cost optimisation.
- Operating margin improved from 2.3 percent in 2022 to 4 percent in 1H25, and underlying profit rose from US$29M in 2022 to US$201M in 2024, on track for US$250–270M in 2025.
- Balance sheet strengthened significantly, shifting from net debt to a net cash position of US$648M as of October 2025.
- Growth plans target 2–3 percent organic revenue CAGR through 2028, supported by higher store sales density, network expansion and disciplined capital deployment into higher-return businesses.
- Operating margin is targeted to rise to 5–7 percent by 2028, with SG&A savings of US$30–35M and improved e-commerce and retail media economics.
- Underlying profit is projected to increase to US$310–315M by 2028, driving return on capital employed toward ~15 percent.
- Dividend payout ratio raised from 60 percent to 70 percent, a move well-received by shareholders and supportive of recent share price gains.
Related Links:
Technical Analysis
Straits Times Index (STI)
- STI was largely neutral last week, giving back most of its earlier gains on Monday despite DFI’s sharp 20 percent surge, which had helped lift the index earlier in the week.
- The index is currently trading around 4,524, resting on its 20-day moving average, with December expected to remain range-bound as markets await the US Federal Reserve’s rate cut decision mid-week.
- Key levels to watch include resistance near the all-time high of 4,575 and support at the 50-day moving average around 4,455, closely aligned with the lower Bollinger Band at approximately 4,470, forming a trading range of 4,450 to 4,575.
- MACD shows fading momentum with a downward drift after rejecting the signal line, while RSI has eased from 64 to 54, indicating a neutral setup with limited upside momentum but no strong downside pressure.
- With rate cut expectations in focus, any surprise from the Fed could challenge these support or resistance levels, potentially creating opportunities for portfolio positioning into 2026.
Learn more about the Straits Times Index (STI) here.
Dow Jones Industrial Average
- The Dow Jones Index gained 0.22 percent last Friday, extending its positive momentum as markets priced in a high likelihood of a 25 basis point Fed rate cut, with expectations sitting above 80 percent ahead of the FOMC announcement this Thursday morning.
- The index is now trading near its year-to-date high at 47,955, just shy of the 48,000 level and close to the previous peak of 48,431 reached on 12 November. A confirmed rate cut could see the Dow retest this high.
- In the event the Fed does not cut rates, the Dow may pull back toward the 50-day moving average around 46,900 to 47,000, implying potential downside of about 900 points.
- Technical indicators remain constructive, with MACD showing strong positive momentum and RSI at a healthy 60, both signalling sustained buying interest and supporting the case for further near-term upside.
- Market catalysts to watch this week include FOMC commentary on future rate cuts and corporate earnings from Oracle, Adobe and Broadcom, which could influence sentiment, particularly for tech-linked components of the Dow.
S&P 500
- The S&P 500 rose about 0.2 percent last Friday and is now approaching its year-to-date high near 6,920, with the widely watched 7,000 level remaining the key year-end target.
- A Fed rate cut this week could provide the catalyst for the index to test the 7,000-point handle, which is viewed as a major resistance zone and a potential profit-taking level before reassessing positioning for 2026.
- Immediate support sits around 6,750, where the 20-day and 50-day moving averages have converged to form a strong pivot point. Additional support lies at the 100-day moving average near 6,598, last tested on 21 November.
- Technical indicators mirror the constructive setup seen in the Dow, with MACD showing positive momentum and RSI maintaining a healthy upward trend
Nasdaq Composite Index
- The Nasdaq Composite rose 0.31 percent last Friday and has extended its rebound over the past two weeks, supported by strong performance in large-cap tech ahead of the Fed rate decision.
- The next key resistance zone sits around 23,900 to 24,000, aligning with the upper Bollinger Band and the previous high of 24,019 seen on 29 October. A break above this level could signal a continuation of the uptrend.
- On the downside, the 100-day moving average at around 22,300 provides the major support, implying a potential 1,000-point pullback if the Fed refrains from cutting rates this week.
- The 20-day and 50-day moving averages, both clustered near the 23,000 level, now serve as the short-term pivot range where the index is likely to consolidate in the near term.
- Technical momentum remains constructive, with both MACD and RSI showing strong positive readings, indicating healthy upward momentum and increasing investor confidence.
What to look out for this week
Wednesday, 10 December 2025: US Federal Reserve Meeting, Oracle earnings
Get the full list of stocks with upcoming dividends here.
Follow us on Telegram, Youtube, Facebook and Instagram to get the latest financial insights.
Read also
Gain financial insights in minutes
Subscribe to our free weekly newsletter for more insights to grow your wealth
Most Popular

Comments
0 comments