Singapore Next 50 Indices in focus: Weekly Review with SIAS
Stocks
Powered by
By Gerald Wong, CFA • 22 Sep 2025
Why trust Beansprout? We’ve been awarded Best Investment Website at the SIAS Investors’ Choice Awards 2025
'%3e%3cpath%20fill-rule='evenodd'%20clip-rule='evenodd'%20d='M17.64%209.20455C17.64%208.56637%2017.5827%207.95273%2017.4764%207.36364H9V10.845H13.8436C13.635%2011.97%2013.0009%2012.9232%2012.0477%2013.5614V15.8195H14.9564C16.6582%2014.2527%2017.64%2011.9455%2017.64%209.20455V9.20455Z'%20fill='%234285F4'/%3e%3cpath%20fill-rule='evenodd'%20clip-rule='evenodd'%20d='M9%2018C11.43%2018%2013.4673%2017.1941%2014.9564%2015.8195L12.0477%2013.5614C11.2418%2014.1014%2010.2109%2014.4205%209%2014.4205C6.65591%2014.4205%204.67182%2012.8373%203.96409%2010.71H0.957275V13.0418C2.43818%2015.9832%205.48182%2018%209%2018V18Z'%20fill='%2334A853'/%3e%3cpath%20fill-rule='evenodd'%20clip-rule='evenodd'%20d='M3.96409%2010.71C3.78409%2010.17%203.68182%209.59318%203.68182%209C3.68182%208.40682%203.78409%207.83%203.96409%207.29V4.95818H0.957273C0.347727%206.17318%200%207.54773%200%209C0%2010.4523%200.347727%2011.8268%200.957273%2013.0418L3.96409%2010.71V10.71Z'%20fill='%23FBBC05'/%3e%3cpath%20fill-rule='evenodd'%20clip-rule='evenodd'%20d='M9%203.57955C10.3214%203.57955%2011.5077%204.03364%2012.4405%204.92545L15.0218%202.34409C13.4632%200.891818%2011.4259%200%209%200C5.48182%200%202.43818%202.01682%200.957275%204.95818L3.96409%207.29C4.67182%205.16273%206.65591%203.57955%209%203.57955V3.57955Z'%20fill='%23EA4335'/%3e%3c/g%3e%3cdefs%3e%3cclipPath%20id='clip0_0_2849'%3e%3crect%20width='18'%20height='18'%20fill='white'/%3e%3c/clipPath%3e%3c/defs%3e%3c/svg%3e)
Make Beansprout your preferred source on Google
Add us on Google to see more of our insights in your search results
We share about the iEdge Singapore Next 50 Indices in the latest Weekly Market Review.

What happened?
In this week's Weekly Market Review in partnership with Securities Investors Association Singapore (SIAS), we discuss key developments in the global equity market alongside the iEdge Singapore Next 50 Indices.
Watch the video to learn more about what we are looking out for this week.
Weekly Market Review
1:50 - Macro Update
- US stocks reached new record highs last week, with the S&P 500 climbing 1.2% to 6,664 points and the Nasdaq rising 2.2% on strong performances from technology names.
- The Federal Reserve delivered its first rate cut of the year, lowering interest rates by 25 basis points in line with expectations following softer inflation and employment data, though the move did not spark a major market reaction given it was widely anticipated.
- Bond yields moved lower, with the US one-year Treasury yield falling below 4% and Singapore’s one-year government bond yield easing to about 1.77%, reflecting investor positioning for easier monetary policy.
- The Fed also signaled another 50 basis points of rate cuts through the rest of 2025, potentially at the October and December meetings, and projected further easing into 2026, largely matching market expectations.
- In Singapore, the Straits Times Index slipped 0.9% to 4,303 points after recent strong gains, with Hongkong Land emerging as the top gainer on news related to its MCL Land unit, while banks such as DBS and OCBC fell 2–3% as investors priced in pressure on their net interest margins from lower rates.
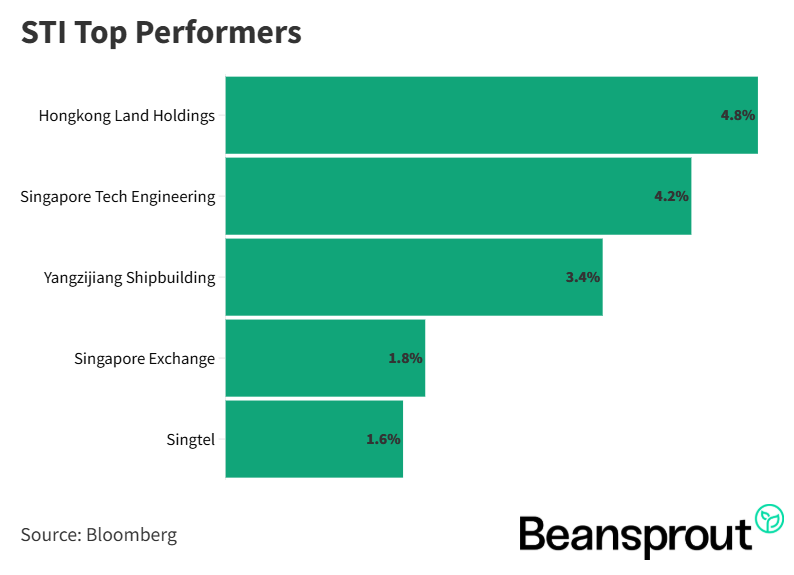
STI Top Performers:
- Hongkong Land Holdings
- Singapore Tech Engineering
- Yangzijiang Shipbuilding Holdings
- Singapore Exchange
- Singtel
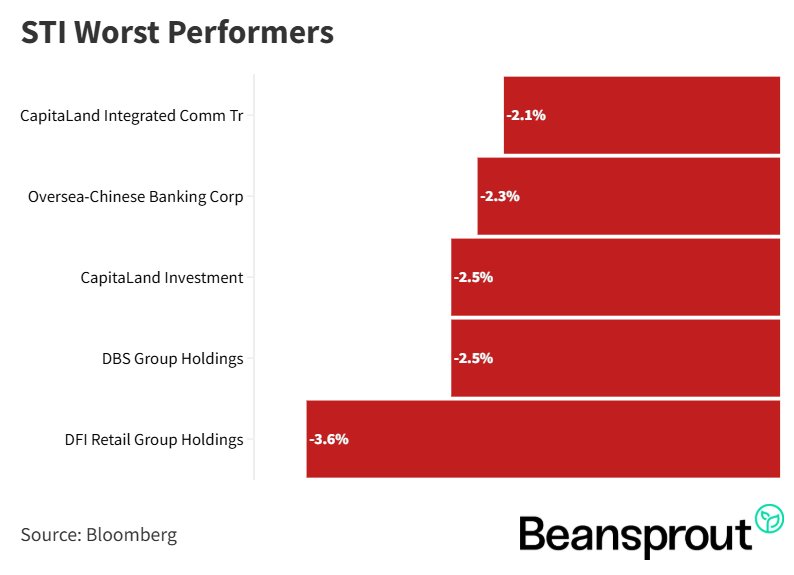
STI Worst Performers:
- CapitaLand Integrated Comm Trust
- Overseas-Chinese Banking Corp
- CapitaLand Investment
- DBS Group Holdings
- DFI Retail Group Holdings
iEdge Singapore Next 50 Indices
- The iEdge Singapore Next 50 Indices were launched to give investors exposure to opportunities beyond the Straits Times Index, tracking the next 50 largest and most liquid companies on the SGX mainboard that are not part of the STI.
- Two versions were introduced — the Next 50 Index and the Next 50 Liquidity Weighted Index. Both indices have rebalancing set quarterly in March, June, September, and December.
- Key names included in the indices are ComfortDelGro, Yangzijiang Financial, iFast, PropNex, NetLink Trust, Raffles Medical, Riverstone Holdings, and a wide range of REITs such as CapitaLand Ascott Trust, Suntec REIT, and Parkway Life REIT, with REITs forming the largest sector representation.
- Over the past ten years, the Next 50 Index delivered annualised returns of 5% and the liquidity-weighted version 3.1%, both below the STI’s 8.9%, though they have outperformed during certain periods such as 2019, 2021, and year-to-date 2025, where gains of around 25% exceeded the STI’s 19.3% rise.
- Currently, there is no ETF or mutual fund tracking these indices, so investors interested in exposure must invest directly in the underlying stocks, though future ETF launches may provide easier access.
Learn more about the iEdge Singapore Next 50 Indices here.
14:15 - Technical Analysis
- The Straits Times Index (STI) pulled back last week, mainly due to weakness in the banking stocks as the Fed’s rate cut raised concerns about pressure on net interest margins.
- Some capital also rotated away from Singapore into riskier U.S. markets following the Fed’s dovish outlook, but the STI still held above the 4,300 level after recently hitting an all-time high of 4,375 on 12 September.
- The 20-day moving average around 4,302 and the July–August double-top formation provide immediate support, while stronger support lies at the 4,250–4,240 range where the 50-day moving average and Bollinger Band converge.
- Technical indicators suggest the pullback may be temporary, with the MACD in negative territory but not showing strong downside momentum, and the RSI easing to 55 from 64, close to the neutral 50 mark that previously triggered rebounds in June.
- A sustained hold above 4,300 could set up conditions for a technical rebound back toward the 4,375 high, while dips below that level may present entry opportunities with 4,250 as the next support zone.
Learn more about the Straits Times Index (STI) here.
Dow Jones Industrial Average
- The Dow Jones rose 1% last week to a new all-time high of 46,396 points, closing near the top of its range and above the upper Bollinger Band at 46,250.
- Momentum remains strong, with the 20-day moving average acting as a near-term pivot, though better re-entry levels may lie closer to the 50-day average and lower Bollinger Band around 45,080–45,000.
- The MACD is currently positive but flattening, suggesting the rally may be losing steam and could shift into a consolidation phase.
- RSI stands at 65, just below the 70 overbought threshold, raising the risk of a pullback similar to the consolidation seen in early July.
- With the index elevated and near overbought levels, traders may consider partial profit-taking ahead of this week’s U.S. Core PCE release, while keeping watch for dips as potential buying opportunities.
S&P 500
- The S&P 500 ended last week at 6,664 points, just shy of its all-time high of 6,670, and is currently tracking the upper Bollinger Band near 6,666.
- Key support levels lie at the 20-day moving average of 6,524, followed by the 50-day moving average at 6,421 and the lower Bollinger Band around 6,382.
- The MACD indicator is stronger than that of the Dow Jones, suggesting the index retains more upside momentum and could continue to trend higher.
- This relative strength reflects how many S&P 500 constituents, particularly mid-sized companies, stand to benefit from the Fed’s rate cuts after having been more pressured during the hiking cycle.
- With two more rate cuts projected by year-end, the S&P 500 may have more room to run compared to the Dow, as easing financial conditions provide tailwinds for growth-sensitive sectors.
Nasdaq Composite Index
- The Nasdaq Composite was the best-performing U.S. index last week, gaining over 2% to close at 22,631 points, just shy of the intraday high of 22,645.
- Momentum is the strongest among the major indices, with the MACD showing the most positive reading, though the RSI has entered overbought territory at 74, raising the risk of a short-term pullback.
- Key levels to watch include the 20-day moving average at 21,861 as the near-term pivot, with additional support at the 50-day average of 21,420 and the lower Bollinger Band around 21,100.
- While technicals point to further upside potential, upcoming macro events such as the U.S. Core PCE release could trigger volatility if data surprises, making this a key catalyst for near-term direction.
- Despite the elevated levels, the index still retains headroom to extend gains, supported by strong momentum in technology and growth stocks as easing financial conditions take hold.
What to look out for this week
Thursday, 25 September 2025: Singapore 6-month T-Bill Auction, US Final GDP data, Singapore Savings Bond application closing date
Friday, 26 September 2025: US Core PCE Data
Get the full list of stocks with upcoming dividends here.
Follow us on Telegram, Youtube, Facebook and Instagram to get the latest financial insights.
Read also
Gain financial insights in minutes
Subscribe to our free weekly newsletter for more insights to grow your wealth
Most Popular

Comments
0 comments