Singapore Next 50 Indices - Explore opportunities beyond blue chips
Stocks
By Gerald Wong, CFA • 10 Apr 2026
Why trust Beansprout? We’ve been awarded Best Investment Website at the SIAS Investors’ Choice Awards 2025
'%3e%3cpath%20fill-rule='evenodd'%20clip-rule='evenodd'%20d='M17.64%209.20455C17.64%208.56637%2017.5827%207.95273%2017.4764%207.36364H9V10.845H13.8436C13.635%2011.97%2013.0009%2012.9232%2012.0477%2013.5614V15.8195H14.9564C16.6582%2014.2527%2017.64%2011.9455%2017.64%209.20455V9.20455Z'%20fill='%234285F4'/%3e%3cpath%20fill-rule='evenodd'%20clip-rule='evenodd'%20d='M9%2018C11.43%2018%2013.4673%2017.1941%2014.9564%2015.8195L12.0477%2013.5614C11.2418%2014.1014%2010.2109%2014.4205%209%2014.4205C6.65591%2014.4205%204.67182%2012.8373%203.96409%2010.71H0.957275V13.0418C2.43818%2015.9832%205.48182%2018%209%2018V18Z'%20fill='%2334A853'/%3e%3cpath%20fill-rule='evenodd'%20clip-rule='evenodd'%20d='M3.96409%2010.71C3.78409%2010.17%203.68182%209.59318%203.68182%209C3.68182%208.40682%203.78409%207.83%203.96409%207.29V4.95818H0.957273C0.347727%206.17318%200%207.54773%200%209C0%2010.4523%200.347727%2011.8268%200.957273%2013.0418L3.96409%2010.71V10.71Z'%20fill='%23FBBC05'/%3e%3cpath%20fill-rule='evenodd'%20clip-rule='evenodd'%20d='M9%203.57955C10.3214%203.57955%2011.5077%204.03364%2012.4405%204.92545L15.0218%202.34409C13.4632%200.891818%2011.4259%200%209%200C5.48182%200%202.43818%202.01682%200.957275%204.95818L3.96409%207.29C4.67182%205.16273%206.65591%203.57955%209%203.57955V3.57955Z'%20fill='%23EA4335'/%3e%3c/g%3e%3cdefs%3e%3cclipPath%20id='clip0_0_2849'%3e%3crect%20width='18'%20height='18'%20fill='white'/%3e%3c/clipPath%3e%3c/defs%3e%3c/svg%3e)
Make Beansprout your preferred source on Google
Add us on Google to see more of our insights in your search results
SGX has launched the iEdge Singapore Next 50 Indices that track the next tier of large and liquid mainboard companies beyond the 30 constituents of the Straits Times Index (STI).

What happened?
Singapore stocks have held up well in the first quarter of 2026 despite market volatility.
As of 8 April 2026, Singapore’s benchmark Straits Times Index (STI) has gone up by around 7.15% year-to-date.
We recently shared the 3 best-performing Singapore blue chip stocks in March as well as 3 Singapore REITs with dividend yields above 6% as they pullback in March.
However, investor interest has not just been centred on the STI.
There has also been growing attention on Singapore-listed companies outside the blue-chip index.
The increased visibility may potentially be supported by the launch of iEdge Singapore Next 50 Index last year which was aimed to track listed companies that are not constituents of the Straits Times Index (STI).
This follows the announcement of the S$5 billion Equity Market Development Programme (EQDP), where MAS will invest with selected fund managers with a strong focus on Singapore stocks, investing in a range of companies and not just index component stocks.
Let us find out more about the newly launched iEdge Singapore Next 50 Index, including its key constituents, latest rebalancing, and how you can gain exposure to the index.
What are the iEdge Singapore Next 50 indices?
The iEdge Singapore Next 50 indices were created to give investors a clearer view of opportunities beyond Singapore’s 30 largest listed companies, which make up the Straits Times Index (STI).
They track the performance of the next tier of large and liquid companies on the SGX Mainboard, essentially the “next in line” after the blue chips. There are two versions of the index:
- iEdge Singapore Next 50 Index
- iEdge Singapore Next 50 Liquidity Weighted Index
Both aim to highlight this broader market segment and provide visibility into companies that might one day grow into the STI.
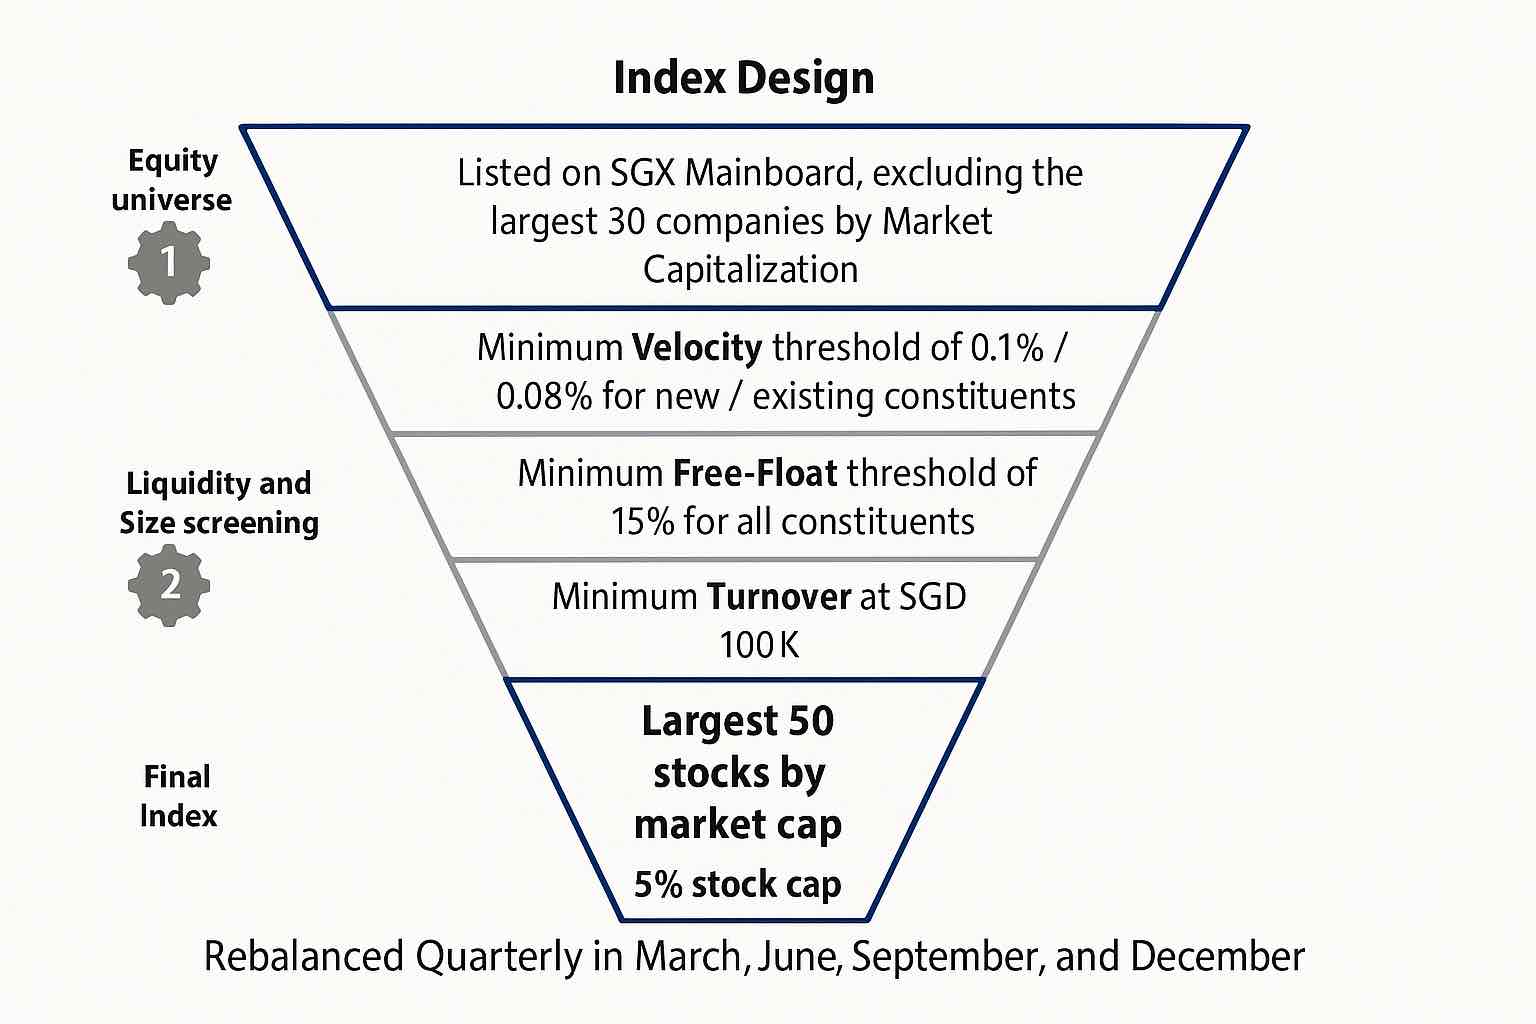
To be included, companies must meet several requirements:
- Listed on the SGX Mainboard (excluding the largest 30 companies by market cap)
- Minimum market cap of SGD 100 million
- Minimum trading turnover of SGD 100,000
- At least 15% free float
- Meet minimum trading velocity thresholds
From this screened universe, the largest 50 stocks by market cap are selected, with a cap of 5% per stock.
The indices are rebalanced quarterly in March, June, September, and December.
Following its June 2026 quarterly rebalancing, which took effect at the market open on 22 June 2026, the index saw several changes to its composition.
| Addition/Inclusions | Removal/Exclusions |
| AEM Holdings Ltd | Singapore Post Ltd |
| Top Glove Corporation Bhd | Digital Core REIT |
| UI Boustead REIT | Wee Hur Holdings Ltd |
| PC Partner Group Limited | China Sunsine Chemical Holdings Ltd |
The next rebalancing of the iEdge Singapore Next 50 indices is scheduled for September 2026.
Which stocks are in the iEdge Singapore Next 50 indices?
There are 50 stocks in the iEdge Singapore Next 50 indices.
Each constituent is subject to a 5% weighting cap at rebalancing.
However, due to strong price performance between rebalancing periods, several top holdings may drift above this threshold.
As of 31 March 2026, the stocks with the largest weighting on the iEdge Singapore Next 50 index are Suntec REIT, NetLink Trust, ComfortDelgro, Keppel Infrastructure Trust, Keppel REIT, CapitaLand Ascott Trust.
Driven by market movement since the last rebalance, the stocks with the largest weighting on the iEdge Singapore Next 50 Liquidity Weighted index are Suntec REIT at 5.1% and iFast at 5.1% weight respectively. Other leading constituents, including ComfortDelgro (4.9%), Keppel REIT (4.9%), and UMS Integration Ltd (4.8%) remain positioned near this maximum weighting.
| Name | Sector | Next 50 Weight | Next 50 Liquidity Weights |
|---|---|---|---|
| Suntec REIT | REITs | 5.4% | 5.1% |
| NetLink NBN Trust | Telecommunications | 5.1% | 3.3% |
| ComfortDelgro | Industrials | 4.9% | 4.9% |
| Keppel Infrastructure Trust | Non-Energy Materials | 4.9% | 1.8% |
| Keppel REIT | REITs | 4.8% | 4.9% |
| CapitaLand Ascott Trust | REITs | 4.7% | 2.9% |
| Haw Par Corp Ltd | Consumer Non-Cyclicals | 4.7% | 1.7% |
| Golden Agri-Resources Ltd | Consumer cyclicals | 4.0% | 2.1% |
| iFAST Corporation | Financials | 4.0% | 5.1% |
| Sheng Siong | Consumer Non-Cyclicals | 4.0% | 4.4% |
| Parkway Life REIT | REITs | 3.6% | 2.4% |
| ESR-REIT | REITs | 3.0% | 1.6% |
| Olam Group Ltd | Consumer Non-Cyclicals | 2.5% | 1.3% |
| Lendlease REIT | REITs | 2.5% | 4.6% |
| Centurion Accommodation REIT | REITs | 2.1% | 2.7% |
| UMS Integration | Technology | 2.0% | 4.8% |
| First Resources Ltd | Non-Energy Materials | 2.0% | 2.4% |
| CapitaLand India Trust | REITs | 1.9% | 1.4% |
| NTT DC REIT | REITs | 1.9% | 2.8% |
| UOB-Kay Hian | Financials | 1.7% | 1.0% |
| SIA Engineering | Industrials | 1.6% | 1.6% |
| Raffles Medical Group | Healthcare | 1.6% | 0.8% |
| AIMS APAC REIT | REITs | 1.6% | 1.4% |
| Starhill Global REIT | REITs | 1.6% | 0.4% |
| CapitaLand China Trust | REITs | 1.6% | 0.9% |
| CDL Hospitality Trust | REITs | 1.4% | 0.6% |
| Yangzijiang Maritime Development Pte Ltd | Financials | 1.3% | 3.1% |
| Frencken Group | Technology | 1.3% | 4.0% |
| CSE Global | Energy | 1.3% | 3.2% |
| Starhub | Telecommunications | 1.2% | 0.7% |
| Food Empire Holdings | Consumer Non-Cyclicals | 1.2% | 1.5% |
| Far East Hospitality Trust | REITs | 1.2% | 0.3% |
| Digital Core REIT | REITs | 1.1% | 1.1% |
| GuocoLand Ltd | Financials | 1.1% | 0.4% |
| Singapore Post | Industrials | 1.0% | 1.5% |
| China Aviation Oil (Singapore) | Energy | 1.0% | 0.9% |
| Boustead Singapore | Industrials | 1.0% | 0.7% |
| Yangzijiang Financial | Financials | 1.0% | 4.3% |
| UltraGreen.ai Ltd | Healthcare | 0.9% | 2.2% |
| Hong Leong Asia | Industrials | 0.9% | 1.8% |
| Riverstone | Consumer Cyclicals | 0.8% | 1.5% |
| Pan-United | Non-Energy Materials | 0.8% | 0.2% |
| Sasseur REIT | REITs | 0.7% | 0.4% |
| Centurion | Financials | 0.7% | 1.3% |
| Yanlord | Financials | 0.7% | 0.8% |
| PropNex | Financials | 0.5% | 1.4% |
| Wee Hur | Financials | 0.5% | 1.3% |
| China Sunsine Chemical Holdings | Non-Energy Materials | 0.4% | 0.4% |
| BRC Asia | Non-Energy Materials | 0.4% | 0.2% |
| Valuemax Group Ltd | Financials | 0.3% | 0.2% |
| Source: SGX as of 31 March 2026 | |||
Which sectors have a more significant weighting in the iEdge Singapore Next 50 indices?
As can be seen from the list above, Singapore REITs make up a significant portion of the iEdge Singapore Next 50 indices.
Of the 50 stocks in the iEdge Singapore Next 50 indices, 16 are Singapore REITs, 5 are industrials and 10 are in the finance sector.
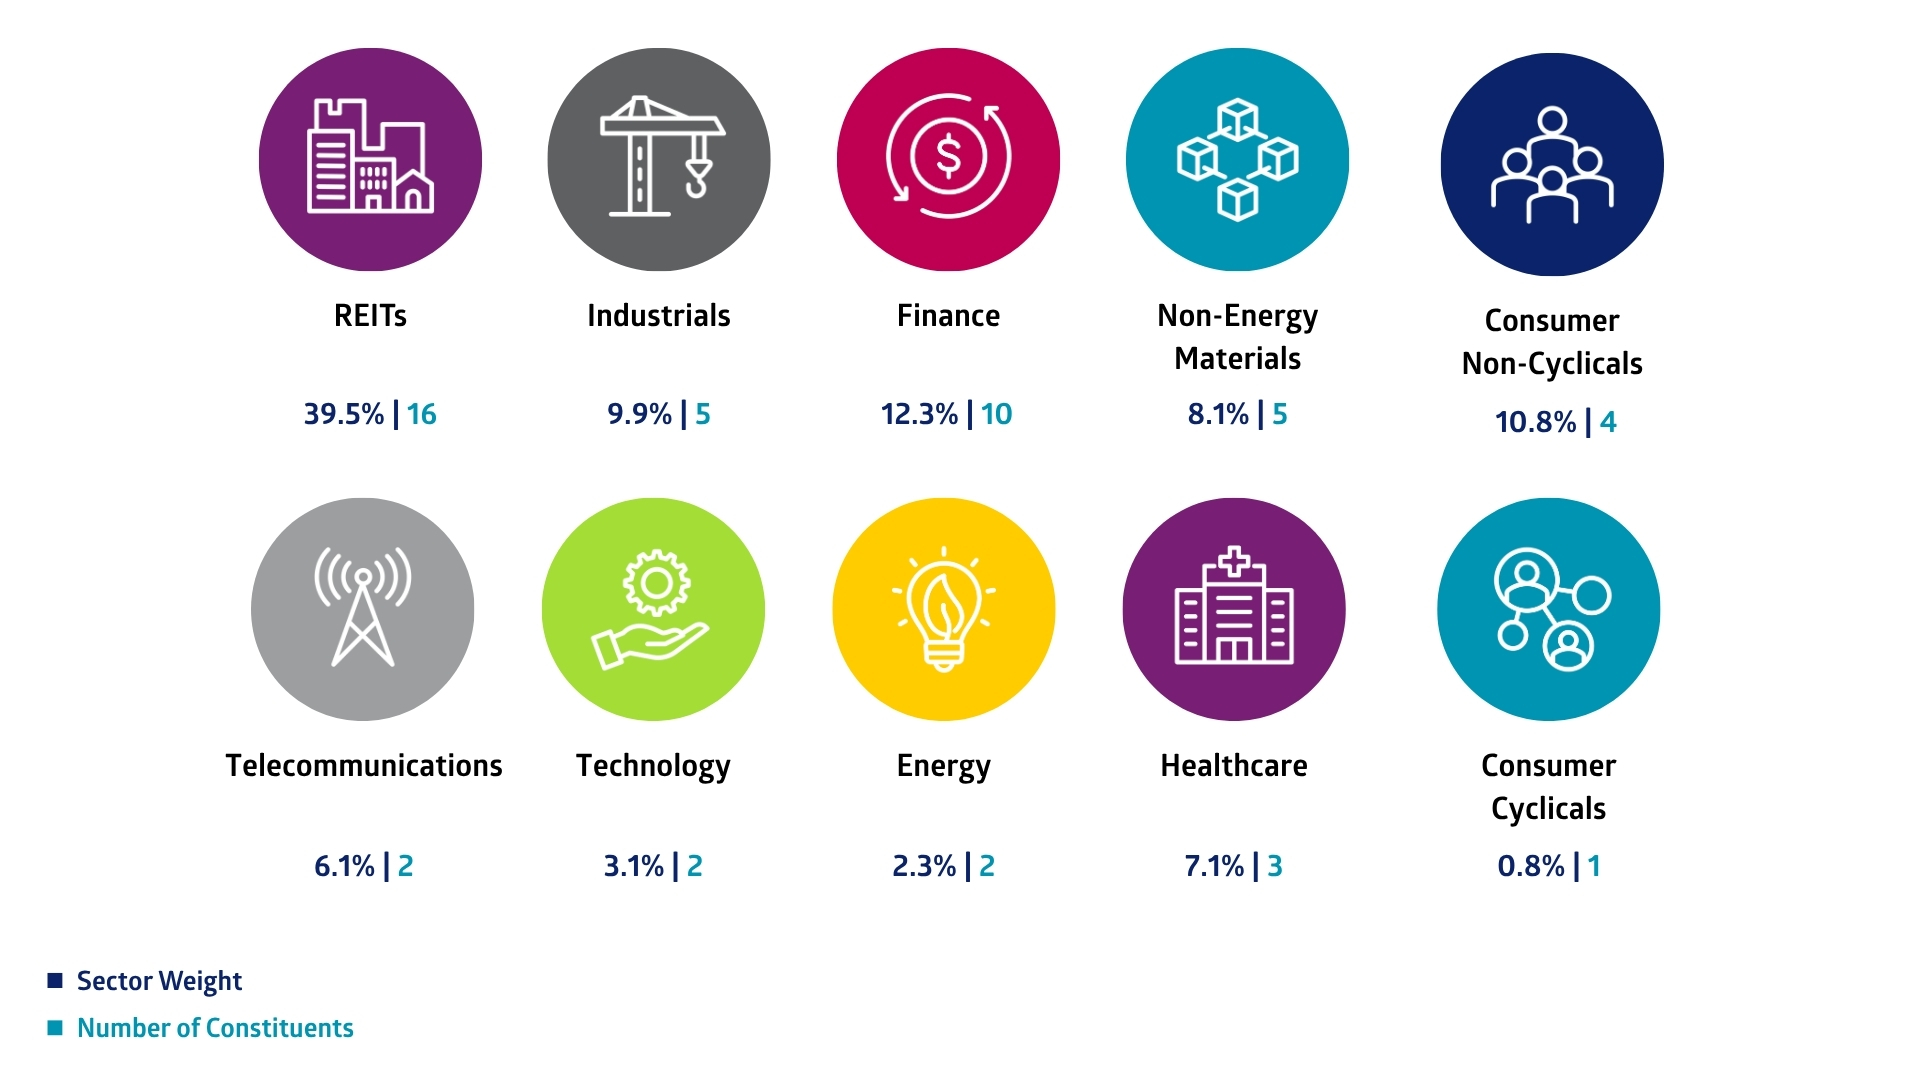
Based on our estimates, Singapore REITs would make up about 42.38% of the total weight of the iEdge Singapore Next 50 index, and 38.48% of the total weight of the iEdge Singapore Next 50 Liquidity index.
This is followed by the Industrials sector, which would make up about 8.52% of the total weight of the iEdge Singapore Next 50 index, and 8.84% of the total weight of the iEdge Singapore Next 50 Liquidity index.
Lastly, the Financials sector would make up about 5.56% of the total weight of the iEdge Singapore Next 50 index, and 8.41% of the total weight of the iEdge Singapore Next 50 Liquidity index.
How has the iEdge Singapore Next 50 Index performed?
As of 31 March 2026, the iEdge Singapore Next 50 index has delivered an average return of 3.94% per year over the past 5 years, falling short of the Straits Times Index (STI), which returned around 14.1% per year.
Performance has been even weaker for the iEdge Singapore Next 50 Liquidity Weighted index, which posted a 5-year return of 3.04% per year.
Between 2021 and 2025, the STI outperformed the iEdge Singapore Next 50 indices in 3 out of 5 years.
That said, there have been bright spots. The iEdge Singapore Next 50 indices have at times pulled ahead of the STI.
Most notably, the iEdge Singapore Next 50 indices outperformed the STI by at least 15% in 2019.
In 2025, the iEdge Singapore Next 50 index gained 27.03%, and the Liquidity Weighted index rose 27.42%, both on par with STI’s 28.6% gain.
| Year | iEdge Singapore Next 50 Index (i) | iEdge Singapore Next 50 Liquidity Weighted Index (ii) | Straits Times Index (iii) | Outperformance Vs STI (i)-(iii) | Outperformance Vs STI (ii)-(iii) |
|---|---|---|---|---|---|
| 2015 | -8.5% | -11.1% | -11.2% | 3% | 0% |
| 2016 | 0.5% | -10.2% | 3.8% | -3% | -14% |
| 2017 | 21.6% | 17.6% | 22.1% | -1% | -5% |
| 2018 | -13.3% | -17.1% | -6.4% | -7% | -11% |
| 2019 | 24.1% | 27.7% | 9.4% | 15% | 18% |
| 2020 | -5.0% | -1.6% | -8.1% | 3% | 7% |
| 2021 | 16.7% | 19% | 13.6% | 3% | 5% |
| 2022 | -11.2% | -13.8% | 8.4% | -20% | -22% |
| 2023 | 4.6% | 5.3% | 4.8% | 0% | 1% |
| 2024 | -0.9% | -6.2% | 23.5% | -24% | -30% |
| 2025 | 27.0 | 27.4 | 28.6 | -1.6% | -1.2% |
| 6 Months | 19.2% | 20.7% | 19.8% | -0.6% | 0.9% |
| 3 Year Ann. | 9.8% | 8.2% | 15.4% | -5.6% | -7.2% |
| 5 Year Ann. | 6.7% | 5.4% | 13.3% | -6.7% | -7.9% |
| Source: SGX as of 31 March 2025 | |||||
What is the objective of the iEdge Singapore Next 50 indices?
The iEdge Singapore Next 50 indices were created to broaden the investment universe in Singapore by tracking 50 of the most liquid and sizable companies beyond the Straits Times Index (STI).
Their key objectives are:
- Enhancing market engagement – Provide new benchmarks for investors and fund managers, helping to draw more attention and liquidity to the wider market.
- Spotlighting mid-cap companies – Increase visibility for quality but often overlooked names, which can in turn attract greater institutional and retail interest.
- Broadening investment options – Pave the way for ETFs or funds that make it easier and more cost-effective to gain diversified exposure beyond the STI.
- Revitalising capital markets – Support SGX’s efforts, alongside initiatives like the S$5 billion EQDP, to boost vibrancy and diversify investor interest.
Can you buy the iEdge Singapore Next 50 indices?
At this point, getting exposure to the iEdge Singapore Next 50 index is not as straightforward as many investors might hope.
There isn’t yet a Singapore ETF or mutual fund that tracks the index, which means those keen to mirror its performance would need to buy the individual stocks one by one.
For most retail investors, this can be time-consuming and costly, and may limit how quickly the index attracts meaningful participation.
For the index to reach its full potential, the next step would be for product issuers to roll out investment vehicles such as ETFs that track it directly.
Having such products available would make it much easier, and more cost-effective, for investors to gain diversified exposure to the broader Singapore equity market through a single purchase.
What would Beansprout do?
By expanding the investable universe to 50 mid-cap names, the new indices bring attention to companies that may have been overlooked.
However, these stocks tend to be smaller and less liquid than STI constituents, which means higher volatility and liquidity risks.
If you are keen to gain exposure to the index, it is important to first understand how these indices differ from the Straits Times Index (STI), and whether they suit your investment objectives and risk appetite.
For now, you can’t buy into the iEdge Singapore Next 50 indices directly, as no ETFs or mutual funds track them yet.
If you are looking to gain broad Singapore equity exposure, you can do so through an STI ETF or Singapore mutual fund.
Learn more about the STI ETF and how to choose the best STI ETF for your portfolio.
Overall, we see that Singapore stocks are still worth looking at in 2026. You can find out more about the 4 growth themes we are watching in Singapore stocks here.
If you are looking for Singapore stock ideas linked to long-term growth themes, you can explore our high-conviction curated stock opportunities here.
Learn more about Beansprout's four pots of wealth framework to grow your wealth with clarity here.
If you’d like to screen for Singapore stocks with attractive dividend yields and potential upside, you can explore our Singapore dividend stocks screener.
If you have a question about the Singapore Next 50 Indices, leave us a comment below or ask away in the Beansprout telegram group.
Check out Beansprout guide to the best stock trading platforms in Singapore with the latest promotions to invest in the STI ETF.
Enjoyed this insight? Follow Beansprout on Telegram, Youtube, Facebook and Instagram, and add Beansprout as your preferred source on Google so you never miss an update.
Read also
Gain financial insights in minutes
Subscribe to our free weekly newsletter for more insights to grow your wealth
Most Popular

Comments
0 comments