Singtel and SATS in focus: Weekly Review with SIAS
Stocks
Powered by
By Gerald Wong, CFA • 26 May 2025
Why trust Beansprout? We’ve been awarded Best Investment Website at the SIAS Investors’ Choice Awards 2025
'%3e%3cpath%20fill-rule='evenodd'%20clip-rule='evenodd'%20d='M17.64%209.20455C17.64%208.56637%2017.5827%207.95273%2017.4764%207.36364H9V10.845H13.8436C13.635%2011.97%2013.0009%2012.9232%2012.0477%2013.5614V15.8195H14.9564C16.6582%2014.2527%2017.64%2011.9455%2017.64%209.20455V9.20455Z'%20fill='%234285F4'/%3e%3cpath%20fill-rule='evenodd'%20clip-rule='evenodd'%20d='M9%2018C11.43%2018%2013.4673%2017.1941%2014.9564%2015.8195L12.0477%2013.5614C11.2418%2014.1014%2010.2109%2014.4205%209%2014.4205C6.65591%2014.4205%204.67182%2012.8373%203.96409%2010.71H0.957275V13.0418C2.43818%2015.9832%205.48182%2018%209%2018V18Z'%20fill='%2334A853'/%3e%3cpath%20fill-rule='evenodd'%20clip-rule='evenodd'%20d='M3.96409%2010.71C3.78409%2010.17%203.68182%209.59318%203.68182%209C3.68182%208.40682%203.78409%207.83%203.96409%207.29V4.95818H0.957273C0.347727%206.17318%200%207.54773%200%209C0%2010.4523%200.347727%2011.8268%200.957273%2013.0418L3.96409%2010.71V10.71Z'%20fill='%23FBBC05'/%3e%3cpath%20fill-rule='evenodd'%20clip-rule='evenodd'%20d='M9%203.57955C10.3214%203.57955%2011.5077%204.03364%2012.4405%204.92545L15.0218%202.34409C13.4632%200.891818%2011.4259%200%209%200C5.48182%200%202.43818%202.01682%200.957275%204.95818L3.96409%207.29C4.67182%205.16273%206.65591%203.57955%209%203.57955V3.57955Z'%20fill='%23EA4335'/%3e%3c/g%3e%3cdefs%3e%3cclipPath%20id='clip0_0_2849'%3e%3crect%20width='18'%20height='18'%20fill='white'/%3e%3c/clipPath%3e%3c/defs%3e%3c/svg%3e)
Make Beansprout your preferred source on Google
Add us on Google to see more of our insights in your search results
We share about Singtel and SATS in the latest Weekly Market Review.

What happened?
In this week's Weekly Market Review in partnership with Securities Investors Association Singapore (SIAS), we discuss key developments in the global equity market alongside Singtel and SATS.
Watch the video to learn more about what we are looking out for this week.
Weekly Market Review
1:57 - Macro Update
- S&P 500 fell 2.6% to 5,803 points, while STI declined 0.4% to 3,882 points.
- Declines were driven by rising US bond yields, a US credit rating downgrade, and renewed tariff threats from Trump.
- US 30-year bond yield climbed back above 5%, while the 10-year yield rose to 4.6% from 4% in early April.
- Singapore bond yields remained stable, with the 10-year yield at 2.5% and 6-month T-bill yield falling to 2.2%.
- The Fed is still expected to cut rates twice in 2025, with potential cuts in September and December.
- Top gainers included Singapore Airlines and Singtel; worst performers were Frasers Logistics (-6.6%) and MPACT (-3.3%).

STI Top performers:
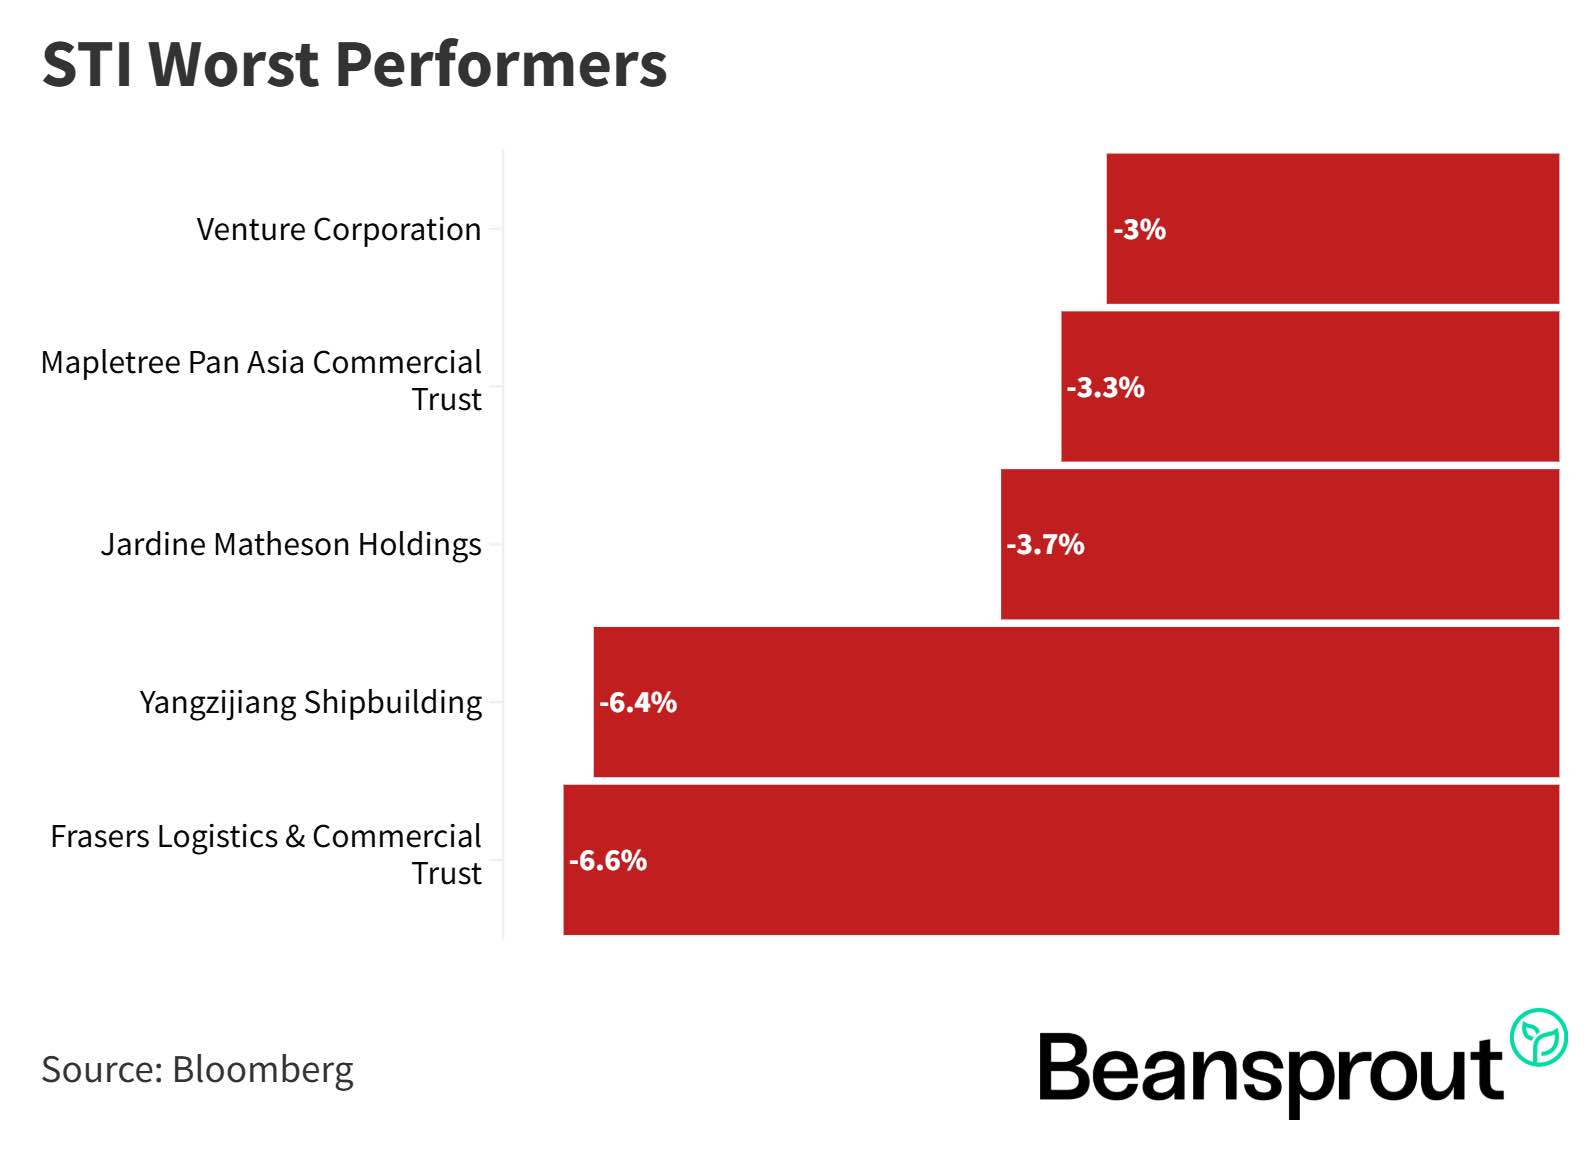
STI worst performers:
- Venture Corp
- Mapletree Pan Asia Commercial Trust
- Jardine Matheson
- Yangzijiang Shipbuilding
- Frasers Logistics & Commercial Trust
5:30 - Singtel
- Singtel's share price hit a 52-week high, closing near $3.90 after reporting a 9% rise in underlying net profit.
- Despite stable revenue, higher profits supported an increased dividend payout, with FY25 total dividend at $0.17, above guidance.
- Optus (Australia) saw strong operating profit growth due to better mobile performance and cost controls; Singapore profits were flat due to competition.
- Growth businesses like NCS delivered strong earnings from improved margins and cost optimization.
- Regional associates' profit after tax rose 4%, led by AIS (Thailand) and Airtel (India).
- Singtel achieved 20% operating profit growth growth, hit cost-saving targets, and raised its asset recycling goal to $9 billion (from $6 billion).
- Announced a $2 billion value realisation share buyback over 3 years (till FY28), supported by excess capital alongside a continued core dividend payout ratio of 70–90%.
Related Links:
11:00 - SATS
- SATS' share price rebounded to around $3 after falling to $2.50 due to easing trade war concerns.
- Q4 FY25 net profit rose 18% YoY to $38.7 million, bringing full-year net profit to $243.8 million.
- Growth was driven by higher volumes in flights handled, air cargo, and aviation meals.
- Revenue, EBITDA margin, and free cash flow all improved in the fourth quarter.
- Final dividend of $0.035 was declared, bringing total FY25 dividend to $0.05.
- Meals served rose 21% YoY, though flights and cargo tonnage handled dipped slightly in Q4 due to seasonality and weaker trade volumes.
- Strong cash flow generation helped reduce net debt and supports confidence in future dividend payouts.
Related Links:
14:35 - Technical Analysis
Dow Jones Industrial Average
- Dow Jones fell over 2% last week and is now below its 200-day moving average, hovering near the 20-day support.
- Key support levels to watch are around 41,039 (50-day MA) and 40,075 (lower Bollinger Band).
- Resistance levels are at 42,346 (200-day MA) and 43,088 (upper Bollinger Band).
- MACD shows weakening momentum with a likely bearish crossover, signaling potential downtrend.
- RSI dropped from 63 to 51, indicating a loss in bullish momentum and nearing neutral territory.
S&P 500 Index
- S&P 500 closed at 5,800, holding just above key support levels at the 200-day (5,773) and 20-day (5,752) moving averages.
- Technical indicators are showing similar weakness to the Dow Jones, suggesting potential downside ahead.
- Next key support levels are the 50-day moving average at 5,584 and the lower Bollinger Band at 5,461.
- The 5,500 level is seen as a critical support zone, with a potential double bottom pattern indicating possible buyer interest.
- MACD is likely to turn negative this week, signaling further downside risk towards the 5,500 level.
- RSI is trending towards the neutral 50 mark, and if it dips below, further pullback to lower support levels like 5,461 is expected.
NASDAQ Composite Index
- NASDAQ has rebounded 30% from its April 7 low but remains below its all-time high.
- Recent pullback has brought the index near key support levels, with confluence around the 100-day, 200-day, and 20-day moving averages at ~18,412 points.
- Next support levels are the 50-day moving average at 17,564 and the lower Bollinger Band at 17,000.
- Technical indicators like MACD are turning negative, signaling a likely technical pullback.
- RSI has weakened to 59, trending toward the neutral 50 level, indicating a loss of bullish momentum.
- A pullback to the 17,500–17,000 range is expected in the next 1–2 weeks as support levels converge.
Straits Times Index
- The STI has rebounded about 17% from its low to the recent high near the 4,000 level on 13 May.
- Over the past week, the STI was nearly flat, with less than 0.5% movement, reflecting market indecision.
- Bollinger Bands are converging, and moving averages are not providing a strong directional signal.
- The 200-day moving average at 3,715 serves as a key support level, roughly 150 points below the current index level.
- MACD turned negative and is flattening, indicating low momentum and lack of clear direction.
- RSI is neutral at 56, closely aligned with its 14-day average of 58, suggesting the index is neither overbought nor oversold and likely to remain range-bound.
What to look out for this week
- Monday, 26 May: iFast ex-dividend, US Holiday
- Tuesday, 27 May: Singapore Savings Bonds (SSB) application closing date
- Wednesday, 28 May: Jardine Cycle & Carriage, NetLink NBN Trust ex-dividend, Nvidia earnings
- Thursday, 29 May: US GDP data
Get the full list of stocks with upcoming dividends here.
Join our Beansprout Telegram group for the latest insights on Singapore stocks, REITs, bonds and ETFs.
Read also
Gain financial insights in minutes
Subscribe to our free weekly newsletter for more insights to grow your wealth
Most Popular

Comments
0 comments