Frasers Logs & Comm Trust in focus: Weekly Review with SIAS
Stocks
Powered by
By Gerald Wong, CFA • 01 Dec 2025
Why trust Beansprout? We’ve been awarded Best Investment Website at the SIAS Investors’ Choice Awards 2025
'%3e%3cpath%20fill-rule='evenodd'%20clip-rule='evenodd'%20d='M17.64%209.20455C17.64%208.56637%2017.5827%207.95273%2017.4764%207.36364H9V10.845H13.8436C13.635%2011.97%2013.0009%2012.9232%2012.0477%2013.5614V15.8195H14.9564C16.6582%2014.2527%2017.64%2011.9455%2017.64%209.20455V9.20455Z'%20fill='%234285F4'/%3e%3cpath%20fill-rule='evenodd'%20clip-rule='evenodd'%20d='M9%2018C11.43%2018%2013.4673%2017.1941%2014.9564%2015.8195L12.0477%2013.5614C11.2418%2014.1014%2010.2109%2014.4205%209%2014.4205C6.65591%2014.4205%204.67182%2012.8373%203.96409%2010.71H0.957275V13.0418C2.43818%2015.9832%205.48182%2018%209%2018V18Z'%20fill='%2334A853'/%3e%3cpath%20fill-rule='evenodd'%20clip-rule='evenodd'%20d='M3.96409%2010.71C3.78409%2010.17%203.68182%209.59318%203.68182%209C3.68182%208.40682%203.78409%207.83%203.96409%207.29V4.95818H0.957273C0.347727%206.17318%200%207.54773%200%209C0%2010.4523%200.347727%2011.8268%200.957273%2013.0418L3.96409%2010.71V10.71Z'%20fill='%23FBBC05'/%3e%3cpath%20fill-rule='evenodd'%20clip-rule='evenodd'%20d='M9%203.57955C10.3214%203.57955%2011.5077%204.03364%2012.4405%204.92545L15.0218%202.34409C13.4632%200.891818%2011.4259%200%209%200C5.48182%200%202.43818%202.01682%200.957275%204.95818L3.96409%207.29C4.67182%205.16273%206.65591%203.57955%209%203.57955V3.57955Z'%20fill='%23EA4335'/%3e%3c/g%3e%3cdefs%3e%3cclipPath%20id='clip0_0_2849'%3e%3crect%20width='18'%20height='18'%20fill='white'/%3e%3c/clipPath%3e%3c/defs%3e%3c/svg%3e)
Make Beansprout your preferred source on Google
Add us on Google to see more of our insights in your search results
We share about Frasers Logistics & Commercial Trust in the latest Weekly Market Review.

What happened?
In this week's Weekly Market Review in partnership with Securities Investors Association Singapore (SIAS), we discuss key developments in the global equity market alongside Frasers Logistics & Commercial Trust.
Watch the video to learn more about what we are looking out for this week.
Weekly Market Review
1:46 - Macro Update
Global markets rebounded strongly last week, with the S&P 500 up 3.7%, NASDAQ surging 4.9% driven by tech stocks, and Singapore's STI rising to 4,524 points.
The market bounce stems from heightened expectations for a Federal Reserve rate cut at the December meeting, from below 50% two weeks ago to above 80%.
Bond yields declined alongside rate cut hopes, including the US 10-year yield falling below 4% and the one-year yield dropping to 3.6% from 3.7% a week prior.
Singapore REITs recovered notably, led by Fraser's Logistics and Commercial Trust up 5%, while worst performers saw only minor 1% declines.
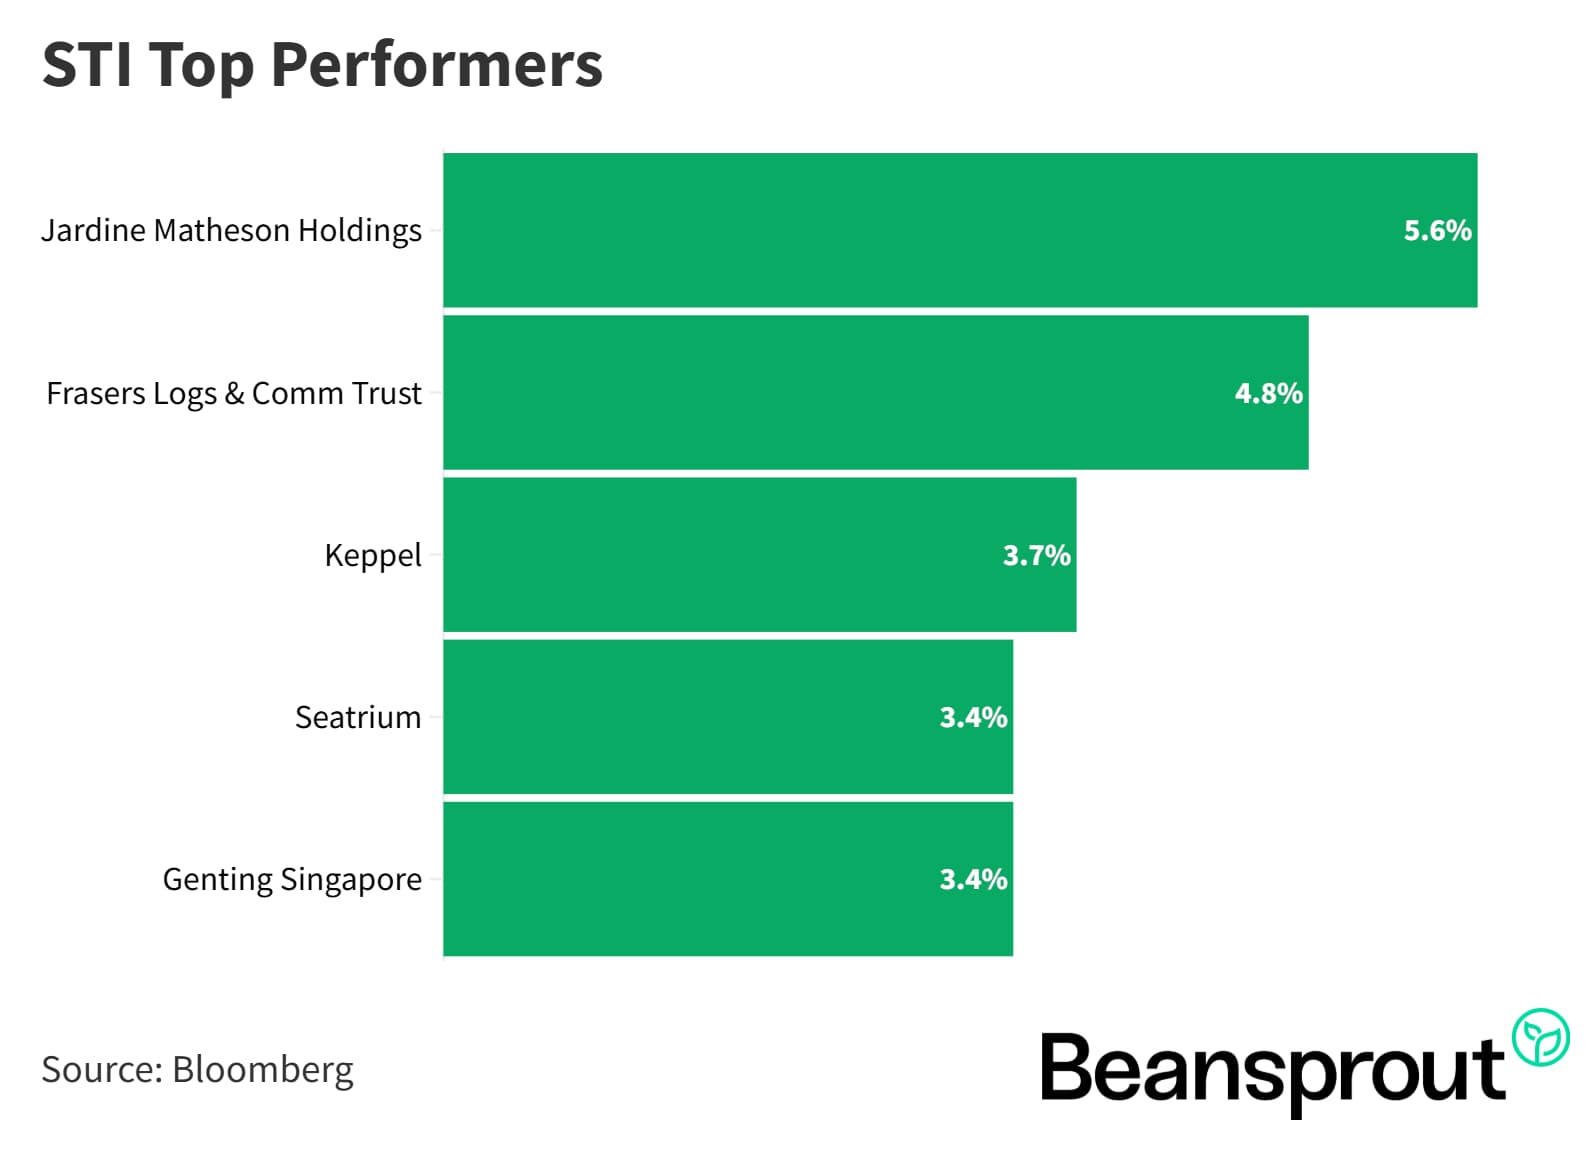
STI Top Performers:
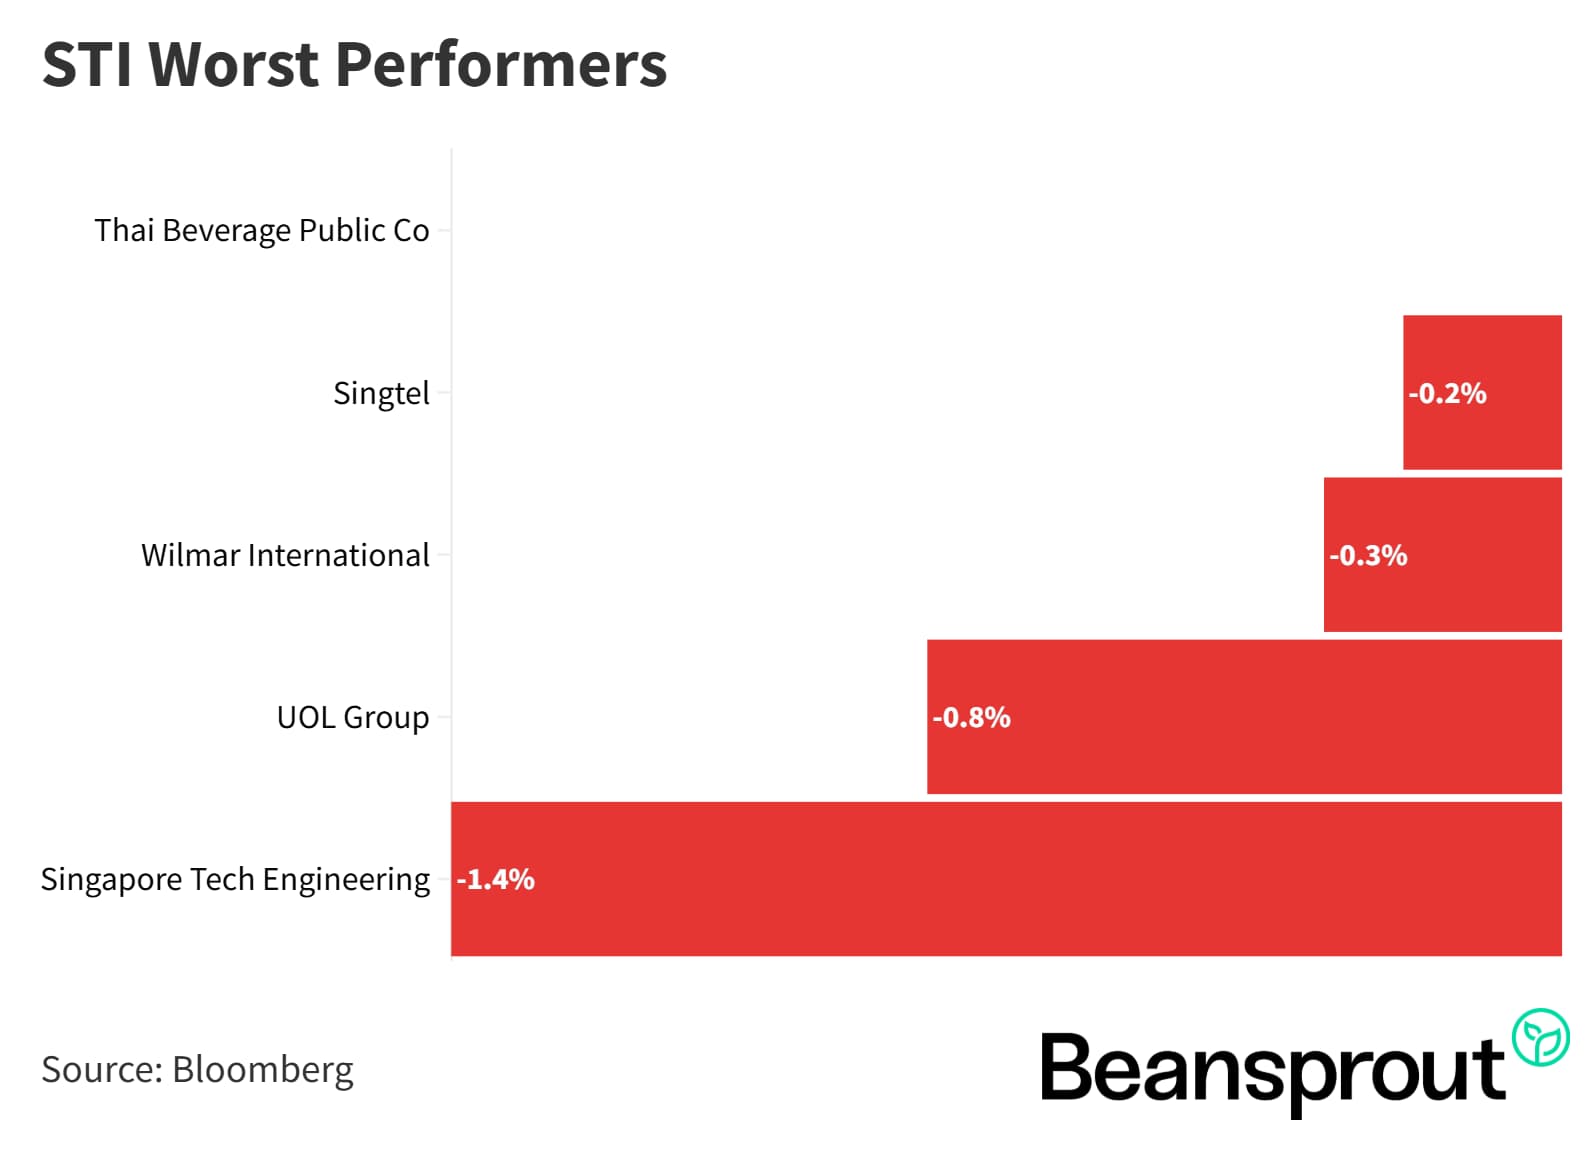
STI Worst Performers:
Frasers Logistics & Commercial Trust (FLCT)
FLCT topped STI performers last week and recovered strongly from April lows below $0.80/share to $0.98/share, with 113 properties valued at $6.9B SGD.
For 2HFY25, revenue rose 3.7% and net property income 2.2%, but higher financing costs reduced distributable income and DPU.
Occupancy improved in Singapore logistics & industrial to 91.6% (from 73.5% in Jun 2025) and Alexandra Technopark to 77.9% (from 74.3%), while Australia/Europe/UK logistics hit 100%; overall rent reversions positive at 7.1%.
Balance sheet shows 3.1% trailing borrowing cost, 35.7% aggregate leverage, trading at 0.9x price-to-book and 6.1% dividend yield.
FY2026 guidance expects lower full-year capital distribution than 2HFY25, with 75% management fees in units.
Read our analysis of how falling interest rates are making Singapore REITs more attractive here.
Related Links:
Frasers Logistics & Commercial Trust share price history and share price target.
Frasers Logistics & Commercial Trust dividend history and dividend forecast.
11:17 - Technical Analysis
Straits Times Index (STI)
STI rose 1.2% last week, driven by Jardine Matheson up 5.6% post-Q3 updates in line with expectations, FLCT, and Jardine Cycle & Carriage and Keppel gaining around 4% and above, lifting the index.
November saw STI pullback from tech overvaluation concerns, but it has rebounded above 4,500, with REITs attracting inflows as potential beneficiaries of anticipated rate cuts.
Key level resistance at prior YTD high of 4,575, support at strong 50-day moving average coinciding with lower Bollinger Band around 4,430, forming December range of 4,430 to 4,580.
MACD negative momentum subsiding with potential crossover this week, RSI at 61 crossing above 14-day average, indicating building uptrend momentum ahead of rate cut decision.
Learn more about the Straits Times Index (STI) here.
Dow Jones Industrial Average
Dow Jones cleared key pivots: 20-day and 50-day moving averages around 46,747 psychological level.
Support holds at 100-day moving average and Bollinger lower bound near 45,800, forming December range of 45,800 to 48,400.
MACD shows positive reading last Friday, signaling potential new uptrend toward higher YTD highs in December, with RSI at 59, indicating strong healthy momentum.
S&P 500
S&P 500 rebounded strongly following major tech stock recovery, with resistance seen at 6,900 to 7,000 level.
Index bounced off supportive 100-day moving average and Bollinger Bands lower bound, confirming historical technical support levels amid positive indicators.
MACD shows positive reading with a recent "golden cross" crossover, signaling likely further upside momentum.
RSI at 58 points indicates healthy positive momentum above the 50-point neutral line.
Nasdaq Composite Index
NASDAQ Composite jumped 4.9% last week despite slight November negativity from tech valuation concerns, it has crossed above 20-day and 50-day moving averages, forming a strong foundation for further gains.
Technical indicators align bullishly: MACD positive reading, RSI above 50-point neutral and 14-day moving average, signaling positive momentum as growth tech stocks sensitive to rate cuts.
Resistance targets upper Bollinger Band at 23,995, with support firm at 100-day moving average and Bollinger lower bound both at 22,161.
Rate cut materialization this month likely to propel NASDAQ higher.
What to look out for this week
Thursday, 4 December 2025: Singapore 6-month T-bill auction
Friday, 5 December 2025: US PCE Price Index data, SIA ex-dividend
Get the full list of stocks with upcoming dividends here.
Follow us on Telegram, Youtube, Facebook and Instagram to get the latest financial insights.
Read also
Gain financial insights in minutes
Subscribe to our free weekly newsletter for more insights to grow your wealth
Most Popular

Comments
0 comments