City Developments and UOL in focus: Weekly Review with SIAS
Stocks
Powered by
By Gerald Wong, CFA • 12 Jan 2026
Why trust Beansprout? We’ve been awarded Best Investment Website at the SIAS Investors’ Choice Awards 2025
'%3e%3cpath%20fill-rule='evenodd'%20clip-rule='evenodd'%20d='M17.64%209.20455C17.64%208.56637%2017.5827%207.95273%2017.4764%207.36364H9V10.845H13.8436C13.635%2011.97%2013.0009%2012.9232%2012.0477%2013.5614V15.8195H14.9564C16.6582%2014.2527%2017.64%2011.9455%2017.64%209.20455V9.20455Z'%20fill='%234285F4'/%3e%3cpath%20fill-rule='evenodd'%20clip-rule='evenodd'%20d='M9%2018C11.43%2018%2013.4673%2017.1941%2014.9564%2015.8195L12.0477%2013.5614C11.2418%2014.1014%2010.2109%2014.4205%209%2014.4205C6.65591%2014.4205%204.67182%2012.8373%203.96409%2010.71H0.957275V13.0418C2.43818%2015.9832%205.48182%2018%209%2018V18Z'%20fill='%2334A853'/%3e%3cpath%20fill-rule='evenodd'%20clip-rule='evenodd'%20d='M3.96409%2010.71C3.78409%2010.17%203.68182%209.59318%203.68182%209C3.68182%208.40682%203.78409%207.83%203.96409%207.29V4.95818H0.957273C0.347727%206.17318%200%207.54773%200%209C0%2010.4523%200.347727%2011.8268%200.957273%2013.0418L3.96409%2010.71V10.71Z'%20fill='%23FBBC05'/%3e%3cpath%20fill-rule='evenodd'%20clip-rule='evenodd'%20d='M9%203.57955C10.3214%203.57955%2011.5077%204.03364%2012.4405%204.92545L15.0218%202.34409C13.4632%200.891818%2011.4259%200%209%200C5.48182%200%202.43818%202.01682%200.957275%204.95818L3.96409%207.29C4.67182%205.16273%206.65591%203.57955%209%203.57955V3.57955Z'%20fill='%23EA4335'/%3e%3c/g%3e%3cdefs%3e%3cclipPath%20id='clip0_0_2849'%3e%3crect%20width='18'%20height='18'%20fill='white'/%3e%3c/clipPath%3e%3c/defs%3e%3c/svg%3e)
Make Beansprout your preferred source on Google
Add us on Google to see more of our insights in your search results
We share about the Singapore property sector in the latest Weekly Market Review.

What happened?
In this week's Weekly Market Review in partnership with Securities Investors Association Singapore (SIAS), we discuss key developments in the global equity market alongside the Singapore property sector.
Watch the video to learn more about what we are looking out for this week.
Weekly Market Review
1:33 - Macro Update
S&P 500 up 1.6% to 6,966 and the STI outperforming with a 1.9% gain to 4,745 points.
Rising geopolitical tensions, particularly developments in Venezuela, did not derail markets; despite holding one of the world’s largest proven crude reserves.
Investors are prioritising global economic growth and earnings outlook, with Singapore’s Q4 GDP and US growth over the last two quarters both showing strong, positive momentum.
Within the STI, property developers were the standout performers: City Developments (+10.6%), Jardine Matheson (+10.5%), Hongkong Land (+9.6%), and ST Engineering climbed (+6.7%) amid geopolitical tensions.
Some REITs lagged, with Keppel DC REIT down 1% and Frasers Centrepoint Trust down 2.6%.
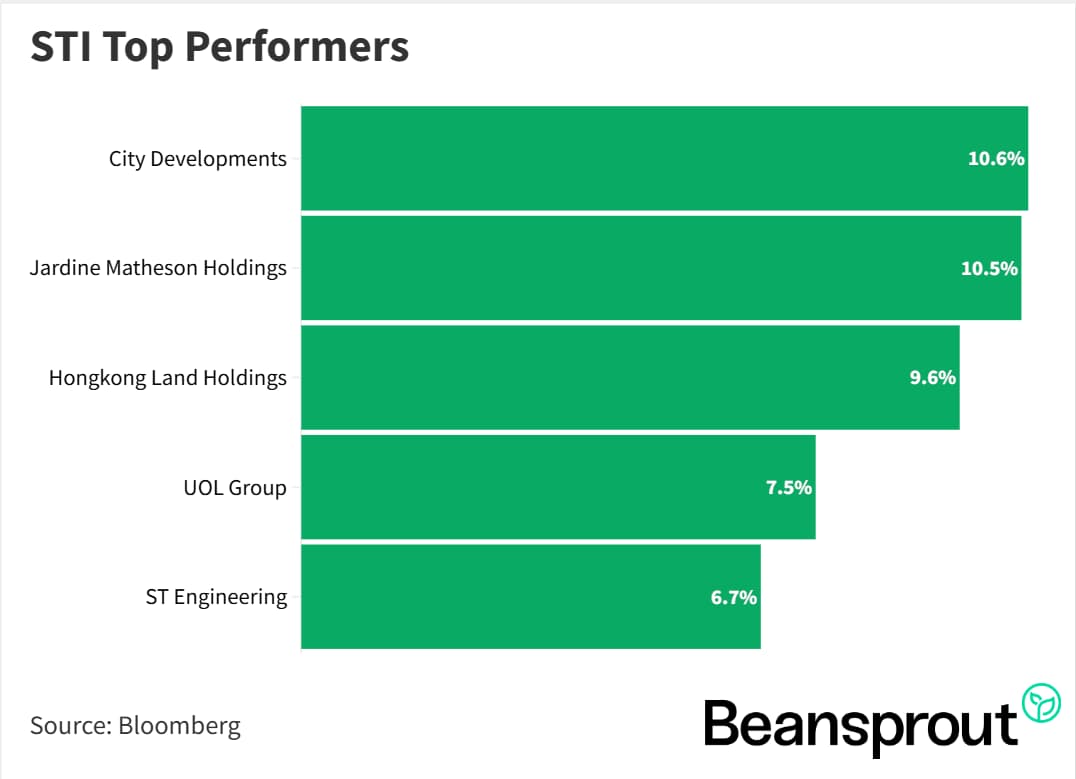
STI Top Performers:
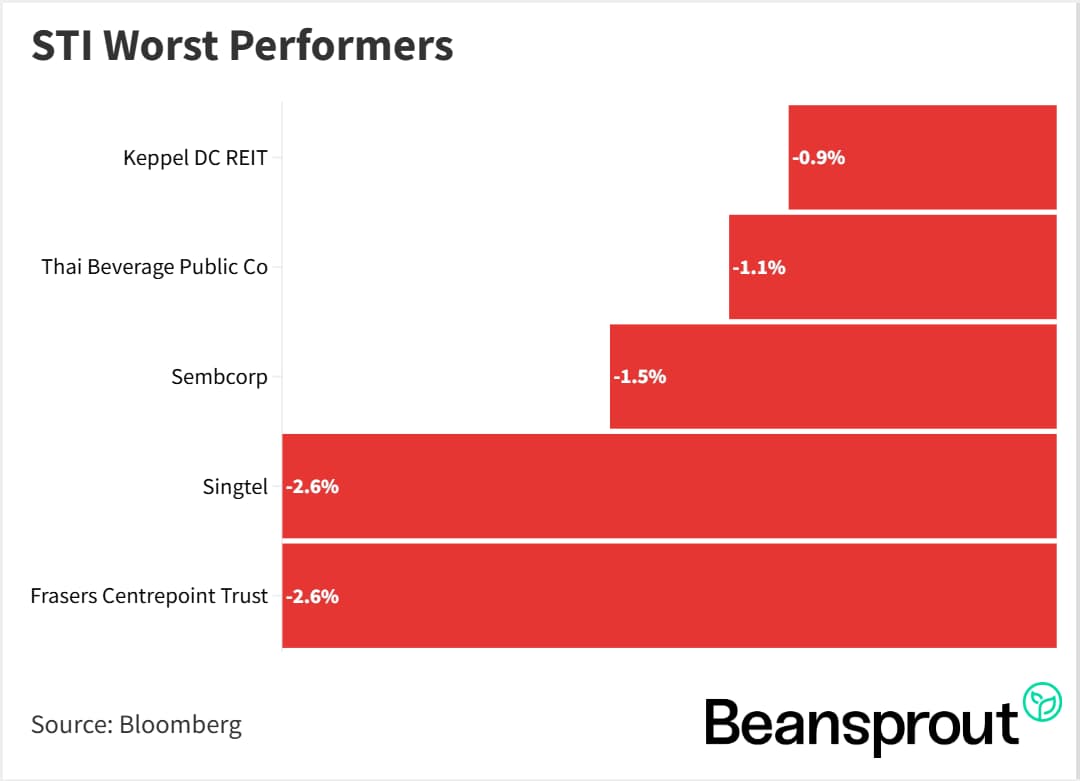
STI Worst Performers:
Singapore Property Sector (City Developments, UOL)
Optimism toward Singapore property developers is underpinned by improving fundamentals, with private residential transaction volumes picking up since Q4 2024, including a 38% YoY rise to 7,400 units in Q3 2025.
A sharp decline in the Singapore overnight rate (from about 3% to around 1.2% in 2025) has improved affordability, supporting higher transaction volumes and an increase in the private residential price index (+5.1% YoY and +0.9% QoQ) in Q3.
Compared with HDB resale prices, private residential prices are now showing slightly stronger QoQ growth, signalling a strengthening of the private segment versus public housing.
Rental market indicators also point to a healthy environment, with private residential rent index rose 1.2% QoQ and 2.4% YoY in Q3
Lower vacancy rate of about 6.9% and a continued decline in unsold units to ~17,200 from a peak of 20,758 units in Q2 2024.
Read also: Are Singapore property stocks still a good buy
Technical Analysis
Straits Times Index (STI)
The STI touched a new all-time high of 4,767 this morning, amid continued strength in property stocks that drove double-digit gains in the first full trading week of 2026.
Post-NFP, FedWatch tool probabilities have dropped for early 2026 rate cuts, now pricing in no cuts for the January, March, or likely April meetings, reflecting confidence in economic stability.
RSI at 81 on Monday morning, testing last week's high and facing next resistance at the upper Bollinger band (4,778), yet supported by Singapore's strong 4.8% GDP growth last year and upcoming positive earnings season.
Any pullbacks offer buying opportunities toward key supports at the 20-day moving average (4,650) or 50-day moving average (4,564)
Learn more about the Straits Times Index (STI) here.
Dow Jones Industrial Average
The Dow Jones outperformed among major US indices in the first full trading week of 2026, rising +0.48% to 49,504 on Friday, buoyed by earnings anticipation for its big bank constituents.
The index has already surpassed the upper Bollinger band (49,491) and remains below the overbought 70-point RSI threshold, suggesting further upside potential toward the 50,000 level.
Key supports include the 20-day moving average at 48,569 (expected to hold amid earnings season), dips below 49,000 as buying opportunities, and stronger confluence at the 50-day moving average (47,784) aligning with the lower Bollinger band (~47,700).
Overall technicals remain bullish, with a positively expanding MACD and RSI not yet overbought, indicating the Dow has headroom to advance higher.
S&P 500
The S&P 500 hit a new all-time high and closing high last week, now sitting just 40 points shy of the 7,000 psychological level, with the upper Bollinger band near 6,997 acting as a key resistance point to watch.
Early earnings season performance will provide directional clues for the broad index, as it has only just begun.
Technical momentum supports further gains, with a strongly positive MACD, healthy RSI at 61 (room to reach 70 before overbought), and confidence that the index will breach 7,000 within the next couple of weeks.
Nasdaq Composite Index
The Nasdaq Composite nows standing at 23,671 with upside targets at the upper Bollinger band (23,853) and the prior all-time high near 24,019 from late October, aiming for the 24,000 handle if big tech shines in earnings season.
Key support levels include a pivot point around 23,300 where the 20-day and 50-day moving averages converge, followed by confluence at the 100-day moving average and lower Bollinger band near 22,860.
Bullish momentum persists with a very positive MACD indicating uptrend continuation, and RSI at 58.
What to look out for this week
Tuesday, 13 January 2026: US CPI Data, JP Morgan Earnings
Wednesday, 14 January 2026: US PPI Data, Wells Fargo, Citigroup Earnings
Thursday, 15 January 2026: 6 Month Singapore T-Bill Auction, Morgan Stanley, Goldman Sachs, Blackrock Earnings
Get the full list of stocks with upcoming dividends here.
Follow us on Telegram, Youtube, Facebook and Instagram to get the latest financial insights.
Read also
Gain financial insights in minutes
Subscribe to our free weekly newsletter for more insights to grow your wealth
Most Popular

Comments
0 comments