SATS in focus: Weekly Review with SIAS
Stocks
Powered by
By Gerald Wong, CFA • 25 Aug 2025
Why trust Beansprout? We’ve been awarded Best Investment Website at the SIAS Investors’ Choice Awards 2025
'%3e%3cpath%20fill-rule='evenodd'%20clip-rule='evenodd'%20d='M17.64%209.20455C17.64%208.56637%2017.5827%207.95273%2017.4764%207.36364H9V10.845H13.8436C13.635%2011.97%2013.0009%2012.9232%2012.0477%2013.5614V15.8195H14.9564C16.6582%2014.2527%2017.64%2011.9455%2017.64%209.20455V9.20455Z'%20fill='%234285F4'/%3e%3cpath%20fill-rule='evenodd'%20clip-rule='evenodd'%20d='M9%2018C11.43%2018%2013.4673%2017.1941%2014.9564%2015.8195L12.0477%2013.5614C11.2418%2014.1014%2010.2109%2014.4205%209%2014.4205C6.65591%2014.4205%204.67182%2012.8373%203.96409%2010.71H0.957275V13.0418C2.43818%2015.9832%205.48182%2018%209%2018V18Z'%20fill='%2334A853'/%3e%3cpath%20fill-rule='evenodd'%20clip-rule='evenodd'%20d='M3.96409%2010.71C3.78409%2010.17%203.68182%209.59318%203.68182%209C3.68182%208.40682%203.78409%207.83%203.96409%207.29V4.95818H0.957273C0.347727%206.17318%200%207.54773%200%209C0%2010.4523%200.347727%2011.8268%200.957273%2013.0418L3.96409%2010.71V10.71Z'%20fill='%23FBBC05'/%3e%3cpath%20fill-rule='evenodd'%20clip-rule='evenodd'%20d='M9%203.57955C10.3214%203.57955%2011.5077%204.03364%2012.4405%204.92545L15.0218%202.34409C13.4632%200.891818%2011.4259%200%209%200C5.48182%200%202.43818%202.01682%200.957275%204.95818L3.96409%207.29C4.67182%205.16273%206.65591%203.57955%209%203.57955V3.57955Z'%20fill='%23EA4335'/%3e%3c/g%3e%3cdefs%3e%3cclipPath%20id='clip0_0_2849'%3e%3crect%20width='18'%20height='18'%20fill='white'/%3e%3c/clipPath%3e%3c/defs%3e%3c/svg%3e)
Make Beansprout your preferred source on Google
Add us on Google to see more of our insights in your search results
We share about SATS in the latest Weekly Market Review.

What happened?
In this week's Weekly Market Review in partnership with Securities Investors Association Singapore (SIAS), we discuss key developments in the global equity market alongside SATS.
Watch the video to learn more about what we are looking out for this week.
Weekly Market Review
1:29 - Macro Update
- The S&P 500 finished the week with a gain of 0.3%, closing at 6,467 points, recovering from an initial tech-led selloff. Meanwhile, the Nasdaq ended the week down about 0.6%, mainly due to profit-taking in major AI-related tech stocks.
- The decline in AI-related stocks was driven by investor concerns over high levels of spending in the sector, combined with broader profit-taking after strong gains earlier in the year.
- Federal Reserve Chairman Jerome Powell spoke at the Jackson Hole symposium, where he acknowledged signs of weakness in the labor market but also indicated that current economic conditions could justify a potential interest rate cut.
- Investors interpreted Powell’s remarks as a signal that a rate cut may occur at the upcoming Federal Reserve meeting on September 17. According to the CME FedWatch tool, there is now a 75 percent probability of a cut to 4 to 4.25%, with another potential cut expected in December, bringing the total to two cuts in 2025.
- U.S. government bond yields fell in response to these expectations, with the one-year yield dropping from about 4.1 percent in late July to around 3.9%.
- In Singapore, the Straits Times Index rose by 0.5% to 4,253 points. Real estate investment trusts such as Mapletree Logistics Trust and CapitaLand Integrated Commercial Trust performed well, supported by falling local bond yields. On the other hand, stocks like ST Engineering and Yangzijiang Shipbuilding saw declines due to profit-taking after strong performances earlier in the year.
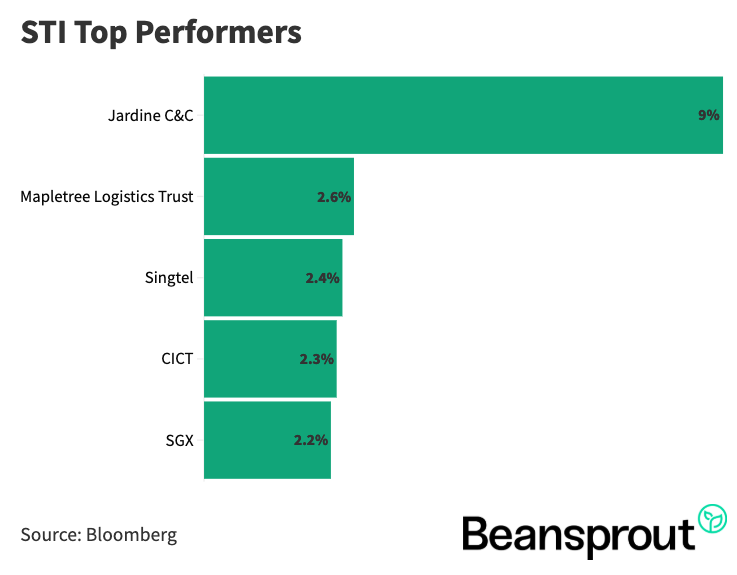
STI Top Performers:
- Jardine Cycle & Carriage
- Mapletree Logistics Trust
- Singtel
- CapitaLand Integrated Commercial Trust
- Singapore Exchange
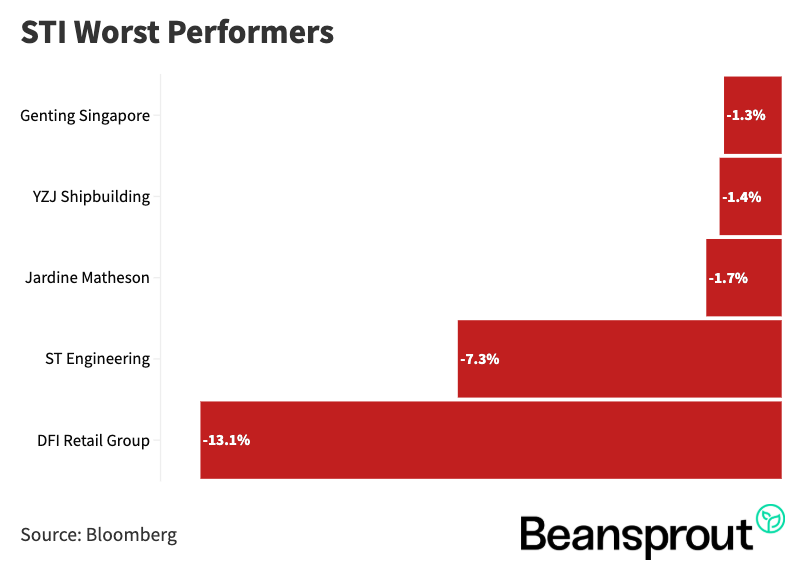
STI Worst Performers:
5:08 - SATS
- For Q1 FY2026 (ending June 2025), revenue rose 9% year-on-year while net profit increased 9.1% to 70.9 million dollars, supported by higher cargo, flights, and aviation meals handled.
- Cargo volume grew 10.4% year-on-year, outpacing the industry for seven consecutive quarters, driving a 12% rise in cargo revenue; gateway services revenue expanded 11% and food solutions revenue grew 6%, though non-aviation meals declined.
- Revenue grew across all regions with Singapore and the Americas each contributing about 35%, and cargo now accounts for 52% of total revenue, followed by ground handling at 26% and aviation food solutions at 16%.
- Margin remained stable with profit after tax margin at 4.7%
- Balance sheet metrics improved, with gross debt to EBITDA falling to 3.5 times and interest coverage strengthening to 4.4 times.
- Valuation stands at around 16x price-to-earnings, below the historical average
Related links:
11:35 - Technical Analysis
Straits Times Index
- The STI gained about 0.5% last week, reaching around 4,260 points, close to its year-to-date high of 4,282 on 14 August. Resistance remains strong around the 4,270–4,280 range, forming a potential double top.
- Profit taking in US markets ahead of the Jackson Hole meeting led to a flight to safety, which benefited Singapore as a more risk-averse, yield-seeking market.
- Support levels for STI include the 20-day moving average at 4,224, the lower Bollinger band at 4,166, and the 50-day moving average at 4,123, with confluence near the 4,150 region where prior lows were observed.
- Technical indicators suggest caution: MACD remains slightly negative without a confirmed breakout, while RSI has rebounded to 61 and could approach 70 if the index retests 4,282, signaling potential overbought conditions.
Dow Jones Industrial Average
- The Dow Jones hit a new all-time high at 45,757 points last Friday, rising about 1.9% or over 800 points. Key support levels are at 44,116 (moving average) and 43,580.
- The Fed has signaled potential monetary easing, with investors closely watching upcoming US economic data: PCE index on 29 August, non-farm payrolls in early September, and CPI on 11 September ahead of the 17 September Fed decision.
- The index could trend along the upper Bollinger Band in the near term, similar to its behavior in early July.
- MACD has turned positive after the recent rally, signaling further upside potential.
- RSI is at 67, close to the overbought threshold of 70, suggesting there is still limited room for further gains before hitting resistance.
S&P 500
- The S&P 500 reached a new all-time high at 6,481 on 15 August but saw profit-taking last week ahead of the Jackson Hole Symposium. After confirmation of market expectations, it rebounded to 6,466 on Friday, up 1.5% or about 100 points.
- The index is expected to trend along the upper Bollinger Band, with the 30-day moving average acting as the first support at 6,385. Stronger support lies around 6,265–6,269 where the 50-day moving average aligns with the lower Bollinger Band.
- MACD remains slightly negative, though the gap between the MACD and signal lines is narrowing, with a potential crossover signaling a new uptrend in the coming weeks.
- RSI stands at 62, moving above its 14-day average and trending towards 70, indicating strong upward momentum.
- Given the momentum, the index could test the upper Bollinger Band at 6,505 within the next two to three weeks.
- Overall, short-term corrections appear contained, with technical indicators pointing to potential continuation of the uptrend if momentum holds.
Nasdaq Composite Index
- The Nasdaq Composite rose 1.88% or nearly 400 points last Friday to 21,496, rebounding after a volatile week of profit-taking ahead of Jackson Hole. It remains about 300 points below its all-time high of 21,803 set on 13 August.
- Resistance is expected near 21,803 with the upper Bollinger Band at 21,855, likely the next target in the coming weeks if momentum continues.
- MACD is still slightly negative and showing weaker convergence than the Dow or S&P, reflecting concerns that the tech rally may be peaking and growth could rotate to other sectors.
- RSI stands at 59, up from just below 50 last week, signaling a positive rebound and room for further gains in the short term.
- NVIDIA earnings this week are seen as a key catalyst that could determine whether the Nasdaq retests its all-time high.
- Broader sentiment also depends on the upcoming Federal Reserve meeting, with markets highly sensitive to signals of potential rate cuts.
What to look out for this week
- Monday, 25 August 2025: PropNex ex-dividend
- Tuesday, 26 August 2025: Singapore Savings Bonds (SSB) application closing date
- Wednesday, 27 August 2025: Nvidia earnings, Delfi, Genting Singapore ex-dividend
- Thursday, 28 August 2025: APAC Realty ex-dividend, Singapore 6-month Singapore T-bill auction
- Friday, 29 August 2025: Alibaba earnings
Get the full list of stocks with upcoming dividends here.
Follow us on Telegram, Youtube, Facebook and Instagram to get the latest financial insights.
Read also
Gain financial insights in minutes
Subscribe to our free weekly newsletter for more insights to grow your wealth
Most Popular

Comments
0 comments