Singapore Airlines and OCBC in focus: Weekly Review with SIAS
Stocks
Powered by
By Gerald Wong, CFA • 04 Aug 2025
Why trust Beansprout? We’ve been awarded Best Investment Website at the SIAS Investors’ Choice Awards 2025
'%3e%3cpath%20fill-rule='evenodd'%20clip-rule='evenodd'%20d='M17.64%209.20455C17.64%208.56637%2017.5827%207.95273%2017.4764%207.36364H9V10.845H13.8436C13.635%2011.97%2013.0009%2012.9232%2012.0477%2013.5614V15.8195H14.9564C16.6582%2014.2527%2017.64%2011.9455%2017.64%209.20455V9.20455Z'%20fill='%234285F4'/%3e%3cpath%20fill-rule='evenodd'%20clip-rule='evenodd'%20d='M9%2018C11.43%2018%2013.4673%2017.1941%2014.9564%2015.8195L12.0477%2013.5614C11.2418%2014.1014%2010.2109%2014.4205%209%2014.4205C6.65591%2014.4205%204.67182%2012.8373%203.96409%2010.71H0.957275V13.0418C2.43818%2015.9832%205.48182%2018%209%2018V18Z'%20fill='%2334A853'/%3e%3cpath%20fill-rule='evenodd'%20clip-rule='evenodd'%20d='M3.96409%2010.71C3.78409%2010.17%203.68182%209.59318%203.68182%209C3.68182%208.40682%203.78409%207.83%203.96409%207.29V4.95818H0.957273C0.347727%206.17318%200%207.54773%200%209C0%2010.4523%200.347727%2011.8268%200.957273%2013.0418L3.96409%2010.71V10.71Z'%20fill='%23FBBC05'/%3e%3cpath%20fill-rule='evenodd'%20clip-rule='evenodd'%20d='M9%203.57955C10.3214%203.57955%2011.5077%204.03364%2012.4405%204.92545L15.0218%202.34409C13.4632%200.891818%2011.4259%200%209%200C5.48182%200%202.43818%202.01682%200.957275%204.95818L3.96409%207.29C4.67182%205.16273%206.65591%203.57955%209%203.57955V3.57955Z'%20fill='%23EA4335'/%3e%3c/g%3e%3cdefs%3e%3cclipPath%20id='clip0_0_2849'%3e%3crect%20width='18'%20height='18'%20fill='white'/%3e%3c/clipPath%3e%3c/defs%3e%3c/svg%3e)
Make Beansprout your preferred source on Google
Add us on Google to see more of our insights in your search results
We share about Singapore Airlines and OCBC in the latest Weekly Market Review.

What happened?
In this week's Weekly Market Review in partnership with Securities Investors Association Singapore (SIAS), we discuss key developments in the global equity market alongside Singapore Airlines and OCBC.
Watch the video to learn more about what we are looking out for this week.
Weekly Market Review
1:40 - Macro Update
- The past week saw a market pullback, with the S&P 500 falling by 2.4% and the STI declining by 2.5% to below the 4,200 mark, largely due to a Friday drop triggered by disappointing US jobs data.
- The July US jobs data came in below expectations, with revised figures for May and June showing an average job growth of about 35,000 per month, raising concerns about the health of the US economy.
- US government bond yields fell sharply on Friday, dropping from about 4.4% to 4.2% reflecting economic concerns.
- There is now an increased market expectation for US Federal Reserve rate cuts, with the probability of a rate cut at the September meeting rising to about 80% after the jobs data release.
- In Singapore, only a few stocks saw gains during the week, with Venture and SGX among the STI’s top performers on the back of stronger than expected earnings.
- The STI’s worst performers included several industrial names such as Singapore Airlines, SATS, and Seatrium.
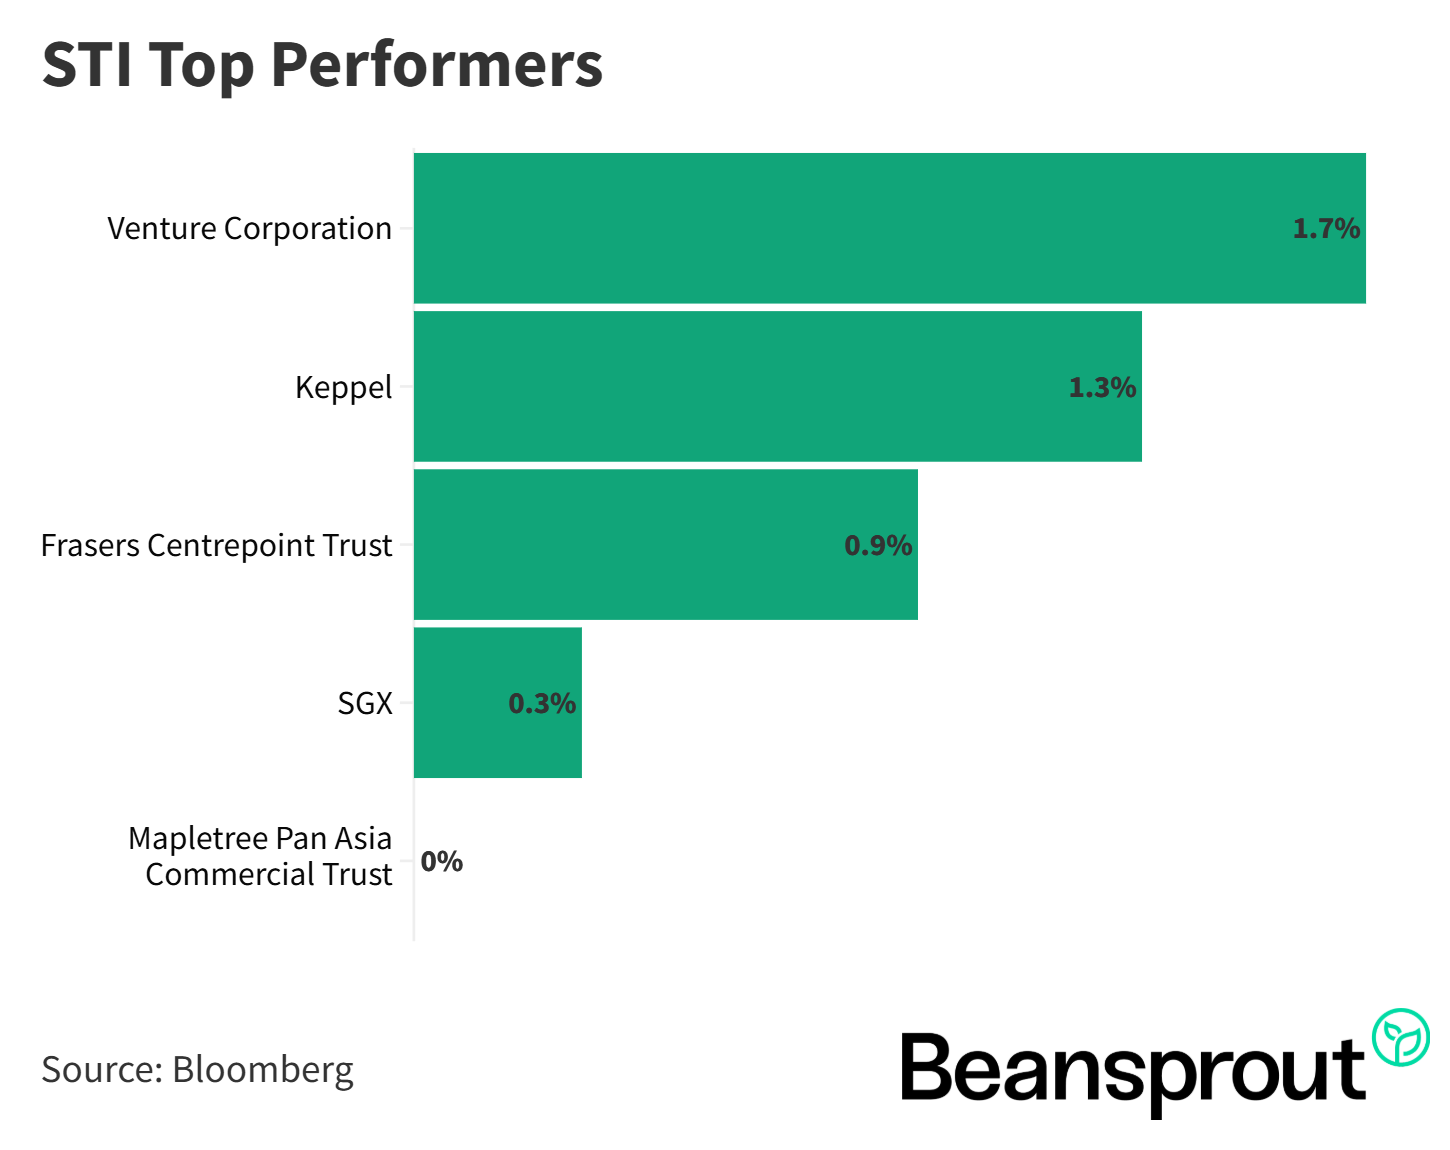
STI Top Performers:
- Venture Corporation
- Keppel Limited
- Frasers Centrepoint Trust
- SGX: Singapore Exchange Limited
- Mapletree Pan Asia Commercial Trust
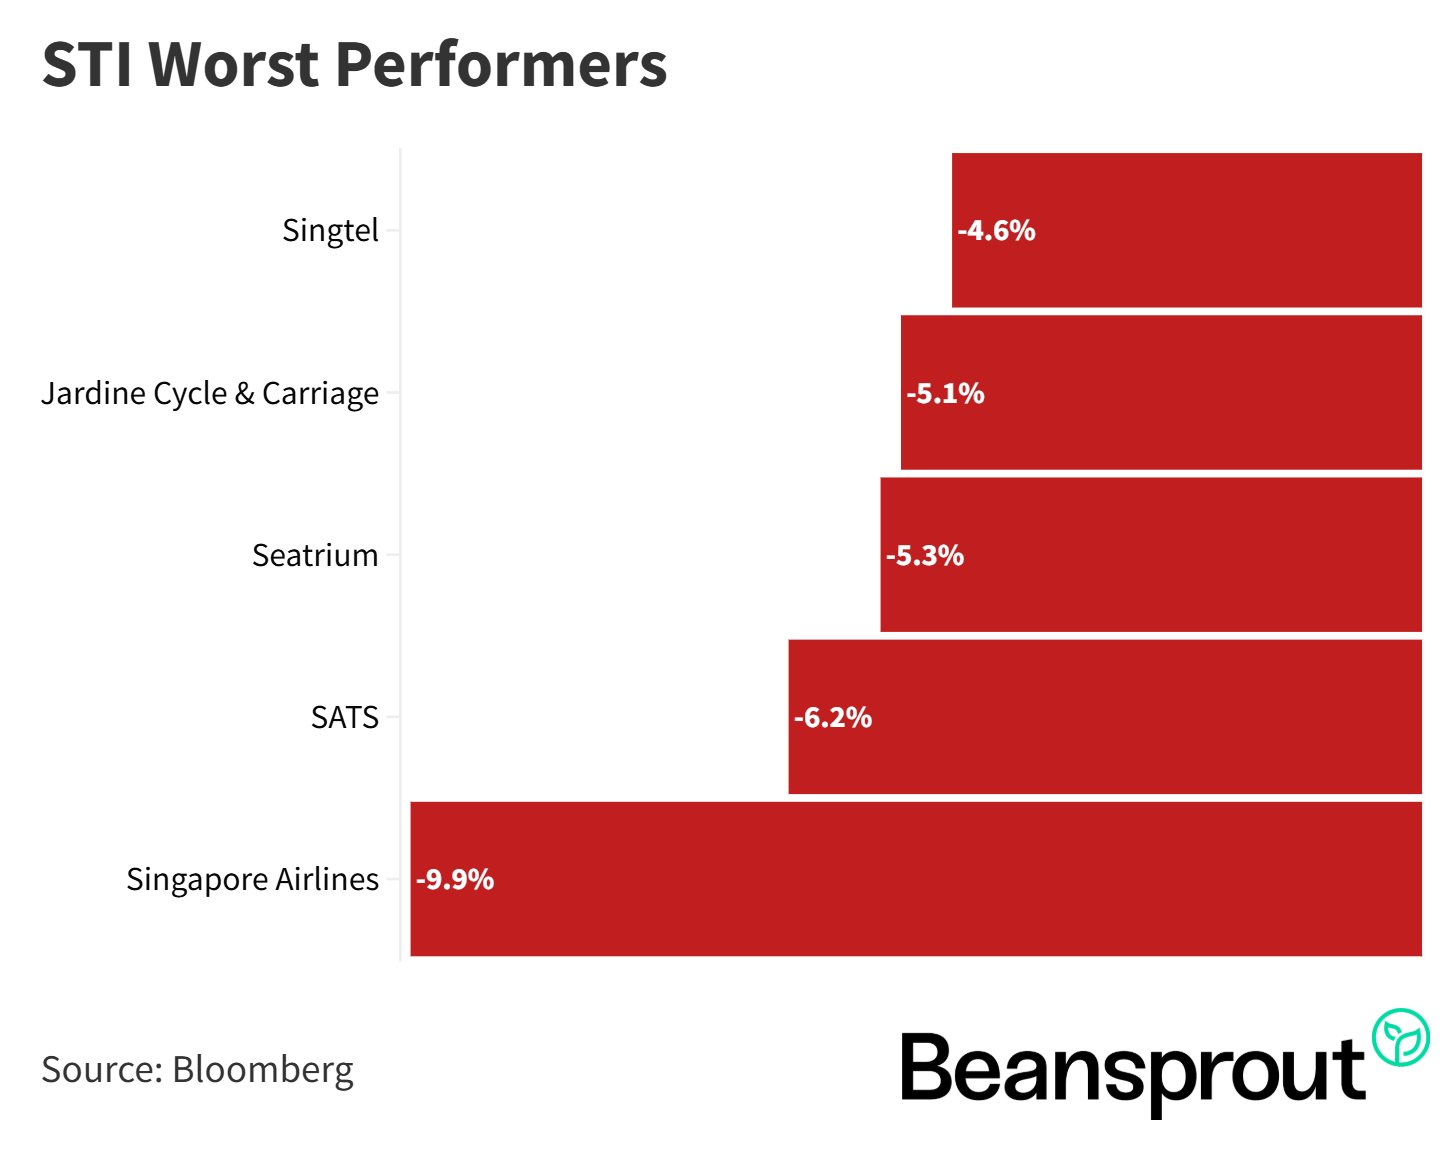
STI Worst Performers:
4:30 - Singapore Airlines
- Singapore Airlines’ share price dropped nearly 10%, from above $7.50 to about $6.80, following its Q1 2025 earnings announcement.
- Net profit for the quarter ended June 2025 fell 58.8% year-on-year to $186 million from $452 million, despite a 1.5% increase in revenue, which was mainly driven by growth in passenger flown revenue.
- The increase in overall expenditure, up by about 3.2% due to higher non-fuel costs (with a slight decrease in fuel costs), led to a 14% decline in group operating profit to $405 million.
- Losses from associated companies, especially Air India, further weighed on results, reducing SIA’s group net profit by about $122 million and contributing to the sharp decline in profit.
- The combination of higher costs and associate losses caused a pronounced drop in net profit, which in turn triggered the decline in SIA’s share price.
Read also:
- Singapore Airlines (SIA) share price history and share price target
- Singapore Airlines (SIA) dividend yield
7:40 - OCBC
- OCBC's group net profit fell by about 6% in the first half of 2025, mainly due to a 5% decline in net interest income driven by lower net interest margins.
- The net interest margin dropped to 1.92% in the second quarter of 2025 (from 2.2% a year ago), reflecting lower interest rates; for the first half, it decreased to 1.98% from 2.23% in the same period last year.
- Non-interest income provided some support, growing 8% year-on-year in the first half and 5% in the second quarter, largely powered by a rise in wealth management fees (from $212 million to $279 million year-on-year in Q2).
- For 2025, OCBC targets a mid-single-digit decline in net interest income with the net interest margin expected between 1.9% and 1.95%; credit costs are projected at 20–25 basis points.
- OCBC maintains a dividend payout target of 60% for 2025, offers an interim dividend of $0.41 (down from $0.44), and continues its share buyback program. The interim payout ratio stands at 50%.
Read also:
11:50 - Technical Analysis
Straits Times Index
- JP Morgan’s year-end target for the Straits Times Index (STI) remains at 4,500 (base case) and 5,000 (bull case), and this target is still considered valid despite a weak start to August, which historically is a softer month.
- The recent slight pullback in STI, from a high of 4,274 on July 24 to around 4,170, is seen as a healthy correction rather than the start of a deeper decline; the mid-term uptrend appears intact, supported by ongoing REIT and property counter strength.
- Key technical support levels to watch are 4,167 (20-day moving average), 4,035 (lower Bollinger Band), and 4,026 (50-day moving average), which cluster around the 4,030 area—a previous resistance zone that now offers strong support.
- If the STI continues to decline, strong support is expected at 4,030 and 4,100 points, suggesting these are potential re-entry points for investors; the current RSI of 59 signals a healthy market state, no longer in overbought territory.
- Technicals indicate stabilisation and resilience despite some sector-specific pressures such as from bank earnings.
Dow Jones Industrial Average
- August is typically the DJIA’s weakest month, and it saw a 2%+ drop last week due to tariffs and a weak jobs report.
- The DJIA is now at 43,588, between key support at the 50-day moving average (43,434) and the lower Bollinger Band (43,800); Friday’s close showed late buying support.
- The next major support is the 200-day moving average at 42,882, with technical buyers expected around the 43,000 level if further downside occurs.
- MACD is negative and RSI is at 42, suggesting possible further consolidation or declines, but not in oversold territory yet.
- A high probability of a Fed rate cut in September could act as a positive catalyst for the DJIA.
S&P 500
- The S&P 500 dropped 1.6% last Friday but closed above the session low, staying within the Bollinger Band channel and broader uptrend.
- At 6,223, the index is above the lower Bollinger Band (6,196) and the 50-day moving average (6,129); buyers are expected to step in if it drops toward the 6,150 level.
- The MACD indicator is negative, suggesting possible further short-term downside, especially with key CPI data ahead this week.
- The RSI is just below 50, not yet in oversold territory; if it hits the 30 level as in April, it could signal a good re-entry point for investors.
- Overall, while there may be more short-term pressure, the S&P 500 remains technically supported, and oversold signals should be watched for value opportunities.
Nasdaq Composite Index
- The NASDAQ Composite closed at 20,650 last Friday, about 200 points above the lower Bollinger Band at 20,354, and remains well above the 50-day moving average at 20,090, showing stronger support compared to the Dow and S&P 500, partly due to big tech earnings last week.
- Key support levels to watch are 20,500, 20,354 (lower Bollinger Band), and the 60-day moving average at 20,200; these areas should see technical buying if tested.
- The MACD indicator is slightly negative, so more downward pressure is expected, but no major breakdown is currently indicated.
- The RSI is neutral at 50, and with elevated VIX and upcoming CPI data, further volatility is likely; if RSI drops below 30 as in previous periods (April, early March), it would be a potential buy signal.
- Despite headline pressure from tariffs and job numbers, strong corporate earnings and a possible September rate cut may help the index maintain its uptrend towards all-time highs.
What to look out for this week
- Monday, 4 August 2025: CapitaLand Ascendas REIT, Lendlease REIT, Frasers Hospitality Trust earnings
- Tuesday, 5 August 2025: CapitaLand Integrated Commercial Trust earnings
- Wednesday, 6 August 2025: Acrophyte Hospitality Trust, Parkway Life REIT, Venture Corporation earnings
- Thursday, 7 August 2025: BHG Retail REIT, IREIT Global, DBS, UOB, Frasers Property, Genting Singapore earnings
- Friday, 8 August 2025: Daiwa House Logistics Trust, Sembcorp, SGX earnings
Get the full list of stocks with upcoming dividends here.
Join our Beansprout Telegram group for the latest insights on Singapore stocks, REITs, bonds and ETFs.
Read also
Gain financial insights in minutes
Subscribe to our free weekly newsletter for more insights to grow your wealth
Most Popular

Comments
0 comments