Keppel REIT in focus: Weekly Review with SIAS
Stocks
Powered by
By Gerald Wong, CFA • 13 Oct 2025
Why trust Beansprout? We’ve been awarded Best Investment Website at the SIAS Investors’ Choice Awards 2025
'%3e%3cpath%20fill-rule='evenodd'%20clip-rule='evenodd'%20d='M17.64%209.20455C17.64%208.56637%2017.5827%207.95273%2017.4764%207.36364H9V10.845H13.8436C13.635%2011.97%2013.0009%2012.9232%2012.0477%2013.5614V15.8195H14.9564C16.6582%2014.2527%2017.64%2011.9455%2017.64%209.20455V9.20455Z'%20fill='%234285F4'/%3e%3cpath%20fill-rule='evenodd'%20clip-rule='evenodd'%20d='M9%2018C11.43%2018%2013.4673%2017.1941%2014.9564%2015.8195L12.0477%2013.5614C11.2418%2014.1014%2010.2109%2014.4205%209%2014.4205C6.65591%2014.4205%204.67182%2012.8373%203.96409%2010.71H0.957275V13.0418C2.43818%2015.9832%205.48182%2018%209%2018V18Z'%20fill='%2334A853'/%3e%3cpath%20fill-rule='evenodd'%20clip-rule='evenodd'%20d='M3.96409%2010.71C3.78409%2010.17%203.68182%209.59318%203.68182%209C3.68182%208.40682%203.78409%207.83%203.96409%207.29V4.95818H0.957273C0.347727%206.17318%200%207.54773%200%209C0%2010.4523%200.347727%2011.8268%200.957273%2013.0418L3.96409%2010.71V10.71Z'%20fill='%23FBBC05'/%3e%3cpath%20fill-rule='evenodd'%20clip-rule='evenodd'%20d='M9%203.57955C10.3214%203.57955%2011.5077%204.03364%2012.4405%204.92545L15.0218%202.34409C13.4632%200.891818%2011.4259%200%209%200C5.48182%200%202.43818%202.01682%200.957275%204.95818L3.96409%207.29C4.67182%205.16273%206.65591%203.57955%209%203.57955V3.57955Z'%20fill='%23EA4335'/%3e%3c/g%3e%3cdefs%3e%3cclipPath%20id='clip0_0_2849'%3e%3crect%20width='18'%20height='18'%20fill='white'/%3e%3c/clipPath%3e%3c/defs%3e%3c/svg%3e)
Make Beansprout your preferred source on Google
Add us on Google to see more of our insights in your search results
We share about the Keppel REIT in the latest Weekly Market Review.

What happened?
In this week's Weekly Market Review in partnership with Securities Investors Association Singapore (SIAS), we discuss key developments in the global equity market alongside the Keppel REIT.
Watch the video to learn more about what we are looking out for this week.
Weekly Market Review
1:33 - Macro Update
- US equities pulled back for the week, with the S&P 500 −2.4% and Nasdaq −2.5%. The bulk of the decline came on Friday after headlines on a sharp US-China escalation hit risk sentiment.
- President Trump announced 100% tariffs on Chinese imports effective 1 Nov, on top of existing duties. Markets interpreted this as a step-change in protectionism that could weigh on supply chains, margins, and global growth expectations.
- China had earlier flagged export controls on rare earth materials, signalling potential pressure on key inputs for electronics/EVs. This tit-for-tat dynamic raised fears of broader retaliation and longer-lasting trade uncertainty.
- In Singapore, the STI still finished higher for the week because the tariff news arrived after the local market closed. That timing muted immediate selling locally, though spillover risk remains for the next session.
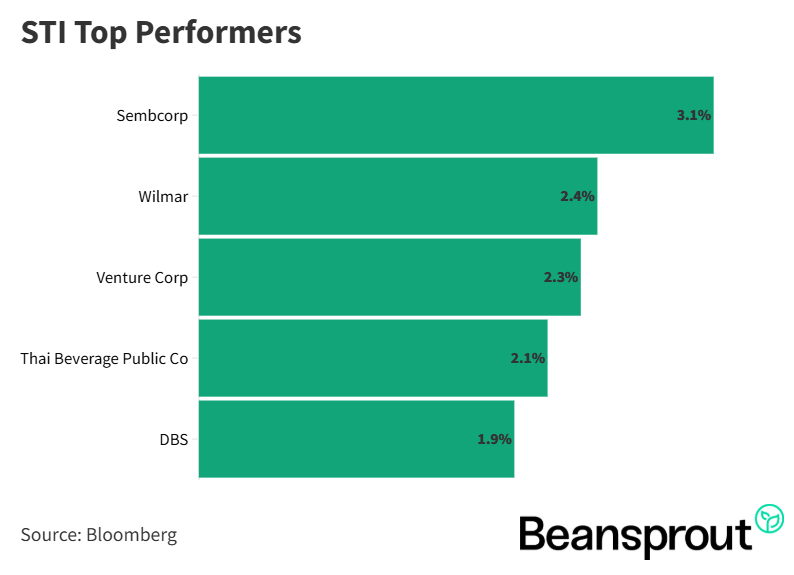
STI Top Performers:
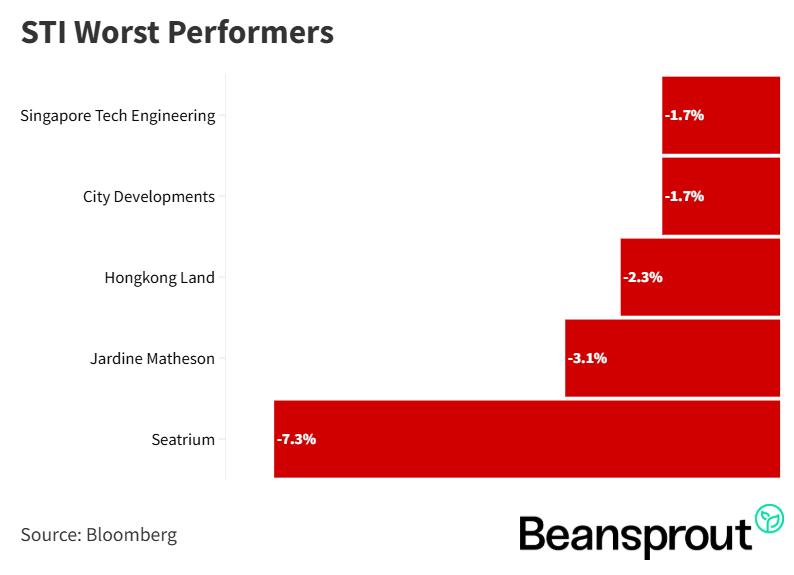
STI Worst Performers:
Keppel REIT
- Keppel REIT has performed well year-to-date, rebounding strongly from April lows to above S$1.00, supported by positive sentiment and portfolio expansion news.
- The REIT announced the acquisition of a 75% stake in Top Ryde City Shopping Centre in Sydney, Australia, marking its first pure retail asset investment and a strategic diversification away from its traditional office-heavy portfolio.
- The A$394 million acquisition features 96% occupancy and a 4.2-year Weighted Average Lease Expiry, and is expected to be DPU-accretive by around 1.3%, reflecting prudent capital allocation and stable income visibility.
- The mall is located in a fast-growing, affluent Sydney suburb, where the population has grown 16% since 2015 and household incomes exceed the regional average — supporting resilient foot traffic and retail demand.
- The asset’s income stream is defensive, with 77% of rental income from non-discretionary tenants (including six supermarkets contributing over 40% of total tenant sales), benefiting from Australia’s post-COVID retail recovery and improving consumer sentiment.
- To finance the acquisition, Keppel REIT issued 112.5 million units at S$0.983 through a three-times oversubscribed private placement. Upon completion in 1Q 2026, portfolio value will increase from S$9.4B to S$9.8B, retail exposure will rise to 4.2%, and Australian exposure to 20.2%. The REIT currently trades at 0.8× P/B with a 5.5% yield, both near its historical averages.
Related links:
9:34 - Technical Analysis
- The Straits Times Index (STI) opened about 1% lower at around 4,381, falling below the 4,400 level following last Friday’s sharp selloff in the US markets. Despite the gap down, the index has yet to test its 20-day moving average (around 4,350), which acts as the first short-term pivot level.
- Key support level is expected around 4,300 points (the 50-day moving average), while a deeper downside would next test the lower Bollinger Band near 4,217, though such a move is seen as less likely in the near term.
- Technical indicators show that while the MACD remains positive, the lines are narrowing toward a potential crossover, which could indicate further short-term downside momentum.
- The RSI reading at 56 suggests the STI is still above neutral territory but moving closer to the 50 mark, where the index has historically shown stabilisation or rebound after prior pullbacks.
- Overall, the STI is holding up better than US indices, with limited retracement despite global weakness. The current dip may be a potential buying opportunity, particularly for resilient blue-chip counters and bank stocks, which continue to dominate index weightage.
Learn more about the Straits Times Index (STI) here.
Dow Jones Industrial Average
- The Dow Jones Industrial Average was the worst performer among the three major US indices, declining for five consecutive sessions and closing at around 45,479 points for the week.
- The index is now hovering just above its 50-day moving average at 45,511, and close to the lower Bollinger Band at 45,629, marking this zone as a key short-term support level to watch.
- A technical rebound is likely if buying support emerges, with potential upside toward the 20-day moving average, though further direction will depend on US-China trade discussions expected later in the month.
- The MACD indicator remains negative, signalling ongoing downside momentum, but traders should watch for any slowing of that negative momentum as an early sign of stabilisation or reversal.
- The RSI reading of 39 indicates the Dow is nearing the oversold threshold of 30, suggesting limited downside and potential for a technical rebound if sentiment improves.
- Overall, analysts view the 45,000 level as a key accumulation zone, especially with major US banks set to kick off earnings season, which could provide a near-term boost to the index given their heavy weighting in the Dow.
S&P 500
- The S&P 500 fell sharply by about 2.7% last Friday, forming a large red candle and breaking below its 20-day moving average, signalling renewed selling pressure across US equities.
- The index is currently hovering near the lower Bollinger Band at around 6,559 points, with the next key support at 6,529, corresponding to its 50-day moving average, which could serve as a short-term floor.
- Technical indicators show persistent weakness: the MACD remains negative, indicating strong downward momentum, while the RSI at 42 points suggests the market is drifting closer to oversold territory (RSI 30) before a potential rebound.
- Should selling continue, the 6,500 level is viewed as a critical support zone where bargain hunting could emerge, making it a potential entry point for investors seeking broad market exposure through S&P 500 ETFs.
- Despite near-term weakness, the broader uptrend remains largely intact, and sentiment could stabilise ahead of the upcoming earnings season, which may act as a catalyst for recovery.
Nasdaq Composite Index
- The Nasdaq Composite Index was the worst performer last Friday, plunging about 3.5% and closing near 22,200 points, losing its hold on the 23,000 level as profit-taking hit tech stocks.
- The index has fallen below its 20-day moving average and is now hovering just above the lower Bollinger Band (≈22,136), with the 50-day moving average at 21,947 providing the next key support zone around the 22,000 handle.
- Technical indicators show clear weakness. The MACD is sharply negative, signalling strong downward momentum, while the RSI has dipped below the neutral 50 mark, reflecting short-term bearish sentiment.
- Historically, when the RSI approaches or dips below 50, the Nasdaq has often seen stabilisation or rebound phases, suggesting that a technical bounce near 22,000 remains possible.
- The current pullback could represent a buying opportunity for investors to re-enter high-quality tech names at more reasonable valuations, especially ahead of the upcoming US earnings season which may provide catalysts for recovery.
- Overall, the 22,000 level acts as a key inflection point — a sustained hold above it could set the stage for a rebound, while further weakness below that may signal a deeper consolidation phase.
What to look out for this week
Tuesday, 14 October 2025: JPMorgan, Goldman Sachs, Citigroup earnings
Wednesday, 15 October 2025: Keppel REIT Ex-Dividend, US CPI Data, Singapore 1-year T-Bill Auction, Bank of America earnings
Thursday, 16 October 2025: SGX Ex-Dividend, US PPI Data
Get the full list of stocks with upcoming dividends here.
Follow us on Telegram, Youtube, Facebook and Instagram to get the latest financial insights.
Read also
Gain financial insights in minutes
Subscribe to our free weekly newsletter for more insights to grow your wealth
Most Popular

Comments
0 comments