Keppel DC REIT preferential offering in focus: Weekly Review with SIAS
Stocks
Powered by
By Gerald Wong, CFA • 06 Oct 2025
Why trust Beansprout? We’ve been awarded Best Investment Website at the SIAS Investors’ Choice Awards 2025
'%3e%3cpath%20fill-rule='evenodd'%20clip-rule='evenodd'%20d='M17.64%209.20455C17.64%208.56637%2017.5827%207.95273%2017.4764%207.36364H9V10.845H13.8436C13.635%2011.97%2013.0009%2012.9232%2012.0477%2013.5614V15.8195H14.9564C16.6582%2014.2527%2017.64%2011.9455%2017.64%209.20455V9.20455Z'%20fill='%234285F4'/%3e%3cpath%20fill-rule='evenodd'%20clip-rule='evenodd'%20d='M9%2018C11.43%2018%2013.4673%2017.1941%2014.9564%2015.8195L12.0477%2013.5614C11.2418%2014.1014%2010.2109%2014.4205%209%2014.4205C6.65591%2014.4205%204.67182%2012.8373%203.96409%2010.71H0.957275V13.0418C2.43818%2015.9832%205.48182%2018%209%2018V18Z'%20fill='%2334A853'/%3e%3cpath%20fill-rule='evenodd'%20clip-rule='evenodd'%20d='M3.96409%2010.71C3.78409%2010.17%203.68182%209.59318%203.68182%209C3.68182%208.40682%203.78409%207.83%203.96409%207.29V4.95818H0.957273C0.347727%206.17318%200%207.54773%200%209C0%2010.4523%200.347727%2011.8268%200.957273%2013.0418L3.96409%2010.71V10.71Z'%20fill='%23FBBC05'/%3e%3cpath%20fill-rule='evenodd'%20clip-rule='evenodd'%20d='M9%203.57955C10.3214%203.57955%2011.5077%204.03364%2012.4405%204.92545L15.0218%202.34409C13.4632%200.891818%2011.4259%200%209%200C5.48182%200%202.43818%202.01682%200.957275%204.95818L3.96409%207.29C4.67182%205.16273%206.65591%203.57955%209%203.57955V3.57955Z'%20fill='%23EA4335'/%3e%3c/g%3e%3cdefs%3e%3cclipPath%20id='clip0_0_2849'%3e%3crect%20width='18'%20height='18'%20fill='white'/%3e%3c/clipPath%3e%3c/defs%3e%3c/svg%3e)
Make Beansprout your preferred source on Google
Add us on Google to see more of our insights in your search results
We share about the Keppel DC REIT in the latest Weekly Market Review.

What happened?
In this week's Weekly Market Review in partnership with Securities Investors Association Singapore (SIAS), we discuss key developments in the global equity market alongside the Keppel DC REIT.
Watch the video to learn more about what we are looking out for this week.
Weekly Market Review
2:05 - Macro Update
- Both the S&P 500 and Singapore’s STI reached new record highs last week, with the S&P 500 closing at 6,716 and the STI surpassing 4,400 points. This reflected continued investor optimism even amid political uncertainty.
- The NASDAQ advanced by 1.3 percent, led by strong momentum in technology stocks as enthusiasm surrounding artificial intelligence continued to drive investor sentiment.
- Weaker private sector labour data in the United States reinforced expectations for further interest rate cuts, leading markets to interpret soft economic indicators as positive for equities.
- The U.S. government shutdown delayed the release of important economic data, including the non-farm payrolls and potentially the September CPI report, creating more uncertainty around the Federal Reserve’s next policy decision.
- Singapore’s market outperformed global peers, rising 3.4 percent amid perceptions of stability and several measures introduced this year to strengthen domestic equity participation.
- Among the top performers were SGX with a 5.9 percent gain, DBS up 5.1 percent, and City Developments also up 5.1 percent, while Genting and Singtel were the only STI constituents with weekly declines.
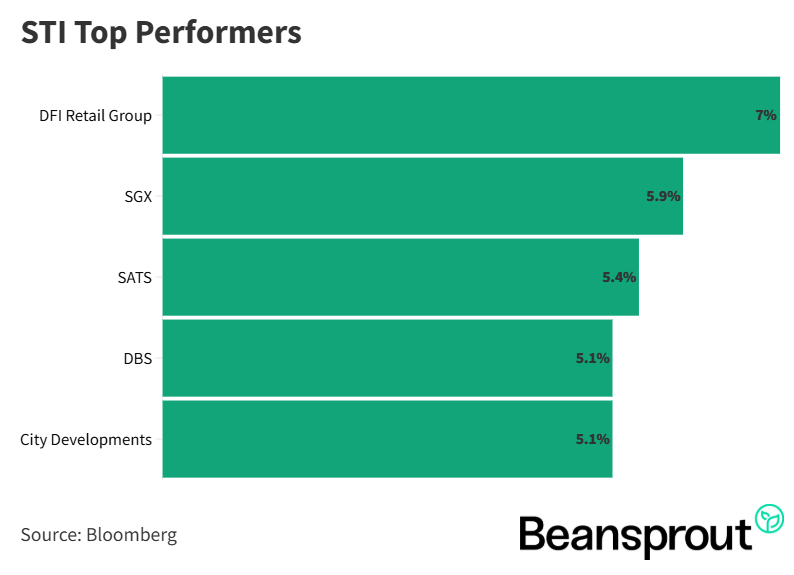
STI Top Performers:
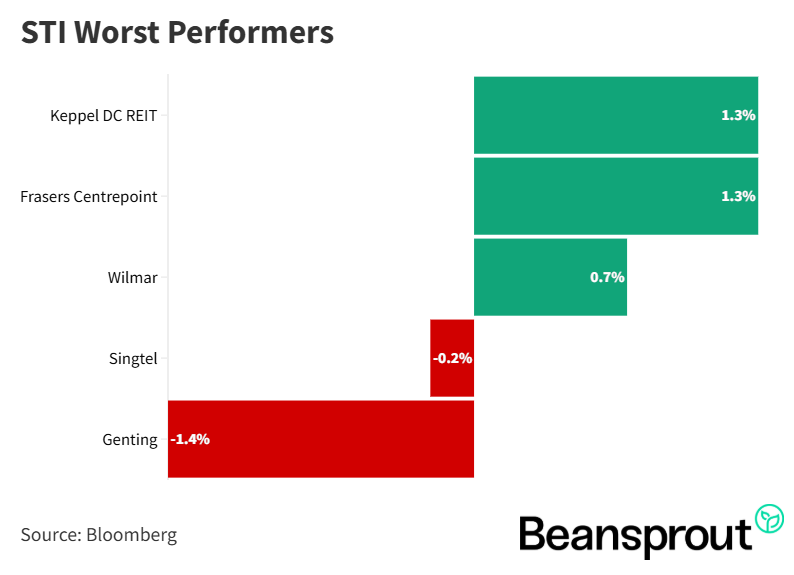
STI Worst Performers:
Keppel DC REIT
- Keppel DC REIT’s share price has recovered strongly since April, supported by lower interest rates and growing investor confidence in the structural demand for data centres across Asia. It remains one of the best-performing REITs within its sector.
- Keppel DC REIT announced the acquisition of a newly completed data centre in Tokyo valued at about S$707 million on a 100 percent basis. The asset is freehold and fully leased to a leading global hyperscaler under a 15-year contract with an additional five-year renewal option and annual rent escalation.
- Japan’s data centre market is viewed as a strategic hub connecting Asia and the United States, providing long-term growth potential for Keppel DC REIT. The Tokyo asset is located in a well-established data centre cluster with strong connectivity and low seismic risk.
- The acquisition is expected to be accretive to unitholders, increasing distributions by about 2.8 percent based on pro forma 2024 figures. Portfolio occupancy is set to improve to 95.9 percent, and the weighted average lease expiry will lengthen to 7.2 years, enhancing income stability.
- To fund the acquisition, Keppel DC REIT launched a preferential offering at an issue price of $2.24 per unit, representing a discount to the last traded price. Eligible investors can subscribe to 80 new units for every 1,000 units held, with the offer period running from 10 to 13 October.
- Following these developments, the REIT trades at a price-to-book ratio of about 1.5 times and offers a yield of around 4.2 percent, reflecting continued investor optimism about data centre growth and portfolio quality.
Learn more about Keppel DC REIT's Preferential Offering here.
Related links:
12:34 - Technical Analysis
- The Straits Times Index (STI) jumped by 3.4 percent last week, breaking above the 4,400 level and marking a strong continuation of its recent rally. However, most technical indicators are now flashing overbought signals, suggesting limited short-term upside.
- The index currently trades around 4,415 points, only about 80 to 85 points below the next psychological resistance at 4,500. This level is expected to act as a ceiling where traders may begin taking profits.
- Analysts noted that the previous rebound occurred at the lower Bollinger Band around 4,275 points in late September. Those who missed that entry are advised not to chase the current rally given the stretched risk-to-reward ratio.
- A potential technical pullback is anticipated once the index tests the 4,500 resistance. The first support is seen at the 20-day moving average near 4,300, followed by stronger support at the 50-day moving average around 4,275.
- From the current level, the potential upside to 4,500 is about 85 points, while the downside risk toward 4,275 amounts to roughly 100 points. This imbalance suggests that risk management and patience are key for traders waiting for a more favourable entry point.
- The preferred strategy is to wait for a retracement toward the 4,300–4,275 zone before re-entering positions, aligning with the moving average supports and a more balanced risk-reward setup.
Learn more about the Straits Times Index (STI) here.
Dow Jones Industrial Average
- The Dow Jones Industrial Average reached a new all-time high last week, touching 47,049 points before closing slightly below the 47,000 mark at 46,758, representing a 0.5 percent gain for the day and over 1 percent for the week.
- Despite the positive momentum, the index is now trading in a zone of limited upside. Technical indicators suggest caution, as the Dow is hovering near overbought levels with the RSI reading at 68, close to the 70 threshold that previously triggered consolidation in July.
- The first support level is identified at 46,110, corresponding to the 20-day moving average, while the next key support lies around 45,336, near the 50-day moving average. These levels have previously acted as reliable pivot zones for rebounds.
- The MACD indicator remains largely neutral, showing little directional momentum. This points to a potential period of range-bound trading as the market digests recent gains and awaits new catalysts.
- Investors are advised not to chase the rally at record levels but to consider incremental accumulation if the index retreats toward its support levels. The likely short-term trading range is expected to hold between 45,757 and 47,000 points through late October.
- Overall, time in the market remains more important than timing the market, with near-term consolidation expected following the strong advance.
S&P 500
- The S&P 500 gained about 1.1 percent last week, touching a new high near 6,750 before closing around 6,715.
- Key supports sit at the 20 day moving average near 6,627 and the 50 day moving average close to 6,500. Pullbacks toward these areas have held in late July and early September.
- MACD is slightly positive but flat, implying limited directional momentum in the near term.
- RSI is around 69 and close to the prior peak near 74 to 75 seen on 22 September, so conditions are near overbought and a pause would be typical.
- A constructive approach is to wait for RSI to recycle toward 50 with price holding the 20 day moving average, then look to ride the prevailing uptrend.
- If the trend persists into year end, a move toward the 7,000 psychological level remains a reasonable upside reference.
Nasdaq Composite Index
- The NASDAQ Composite Index was the best performer among the major U.S. indices last week, rising about 1.32 percent to a high of 22,925 points, just short of the 23,000 psychological level.
- The 20 day moving average near 22,400 serves as the immediate pivot level, while stronger support lies around the 50 day moving average at 21,780. This lower zone also aligns with the bottom of the Bollinger Band and a prior double top formation, suggesting potential change in polarity if retested.
- Momentum indicators show moderation, with MACD reading as neutral and RSI nearing the overbought level of 70. This signals that a short term cooling phase could emerge before the next leg higher.
- A more attractive setup would be for RSI to retrace toward 50, with price consolidating near the 50 day moving average, creating a base for renewed upside momentum.
- Investors can wait for such a pullback to ride the continuing AI led tech wave, as the broader uptrend in the NASDAQ remains intact despite stretched short term technicals.
What to look out for this week
- Thursday, 9 October 2025: Singapore 6-month T-bill auction
- Friday, 10 October 2025: University of Michigan Consumer Sentiment
Get the full list of stocks with upcoming dividends here.
Follow us on Telegram, Youtube, Facebook and Instagram to get the latest financial insights.
Read also
Gain financial insights in minutes
Subscribe to our free weekly newsletter for more insights to grow your wealth
Most Popular

Comments
0 comments