With falling interest rates, do Singapore REITs look attractive?
REITs
By Gerald Wong, CFA • 15 Feb 2026
Global Wealth Technology Pte. Ltd. is regulated by the Monetary Authority of Singapore (MAS) as a licensed Financial Adviser.
'%3e%3cpath%20fill-rule='evenodd'%20clip-rule='evenodd'%20d='M17.64%209.20455C17.64%208.56637%2017.5827%207.95273%2017.4764%207.36364H9V10.845H13.8436C13.635%2011.97%2013.0009%2012.9232%2012.0477%2013.5614V15.8195H14.9564C16.6582%2014.2527%2017.64%2011.9455%2017.64%209.20455V9.20455Z'%20fill='%234285F4'/%3e%3cpath%20fill-rule='evenodd'%20clip-rule='evenodd'%20d='M9%2018C11.43%2018%2013.4673%2017.1941%2014.9564%2015.8195L12.0477%2013.5614C11.2418%2014.1014%2010.2109%2014.4205%209%2014.4205C6.65591%2014.4205%204.67182%2012.8373%203.96409%2010.71H0.957275V13.0418C2.43818%2015.9832%205.48182%2018%209%2018V18Z'%20fill='%2334A853'/%3e%3cpath%20fill-rule='evenodd'%20clip-rule='evenodd'%20d='M3.96409%2010.71C3.78409%2010.17%203.68182%209.59318%203.68182%209C3.68182%208.40682%203.78409%207.83%203.96409%207.29V4.95818H0.957273C0.347727%206.17318%200%207.54773%200%209C0%2010.4523%200.347727%2011.8268%200.957273%2013.0418L3.96409%2010.71V10.71Z'%20fill='%23FBBC05'/%3e%3cpath%20fill-rule='evenodd'%20clip-rule='evenodd'%20d='M9%203.57955C10.3214%203.57955%2011.5077%204.03364%2012.4405%204.92545L15.0218%202.34409C13.4632%200.891818%2011.4259%200%209%200C5.48182%200%202.43818%202.01682%200.957275%204.95818L3.96409%207.29C4.67182%205.16273%206.65591%203.57955%209%203.57955V3.57955Z'%20fill='%23EA4335'/%3e%3c/g%3e%3cdefs%3e%3cclipPath%20id='clip0_0_2849'%3e%3crect%20width='18'%20height='18'%20fill='white'/%3e%3c/clipPath%3e%3c/defs%3e%3c/svg%3e)
Make Beansprout your preferred source on Google
Add us on Google to see more of our insights in your search results
Interest rates are falling. We assess the fundamentals of Singapore REITs and find out if they are worthwhile investing in.
What happened?
I have been sharing about how Singapore REITs can offer a a source of passive income.
With interest rates and the T-bill yield falling, many investors are wondering if Singapore REITs will start recovering.
However, in our recent article on 3 Singapore blue chip REITs with dividend yields of above 5%, we saw that the dividends of Singapore REITs continue to be very mixed.
This continues a trend of divergence in the performance in Singapore REITs that saw in 2025.
In this article, I will dive deeper into the fundamentals of Singapore REITs by examining the latest rental and vacancy trends across various sub-sectors, and look at their latest valuation metrics to find out if they are worth investing in.
More interest savings as interest rates ease
A softer rate backdrop is improving distribution visibility for Singapore REITs as borrowing costs gradually reset lower.
Fed funds futures imply roughly two rate cuts in 2026, while the 3-month compounded SORA has continued to drift lower, falling to 1.15% on 29 Jan 2026 from 3.07% on 31 December 2024.
Singapore REITs have been proactively refinancing their debt maturity at lower interest rates, bringing down the cost of debt.
The benefits, however, remain uneven, depending on each REIT’s balance sheet, refinancing schedule, and the extent of debt still fixed at higher legacy rates.
Looking ahead, we expect the performance of Singapore REITs to continue to diverge, with returns continuing to depend on factors such as sub-sector exposure, geographical mix, and the extent of debt that has been hedged at fixed rates.
Central Region office indicators improved sequentially in 4Q2025
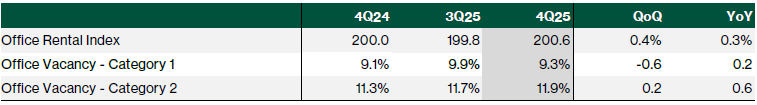
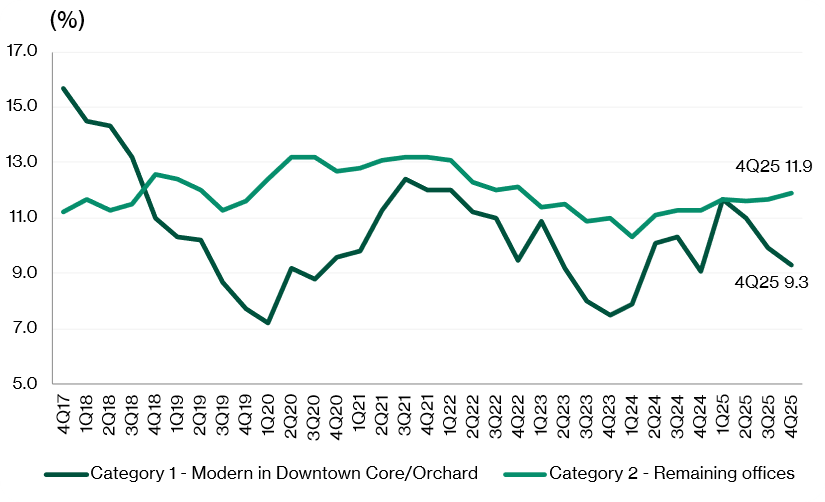
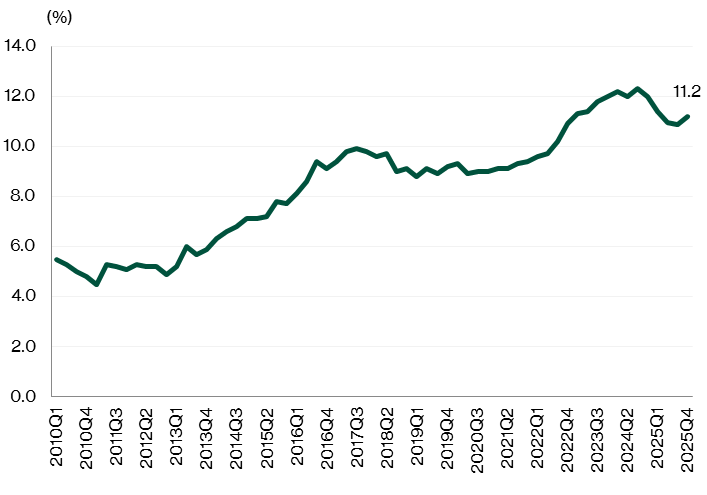
Category 1 office vacancy improved to 9.3% in 4Q25, down from 9.9% in 3Q25, reflecting firmer take-up in prime, core-area buildings.
Category 1 refers to modern or recently refurbished offices in the Downtown Core and Orchard Planning Area, typically offering larger floor plates and commanding higher rents.
In contrast, Category 2 offices (the rest of the stock) continued to see vacancy remain elevated at 11.9%, highlighting the growing bifurcation between prime and non-prime space.
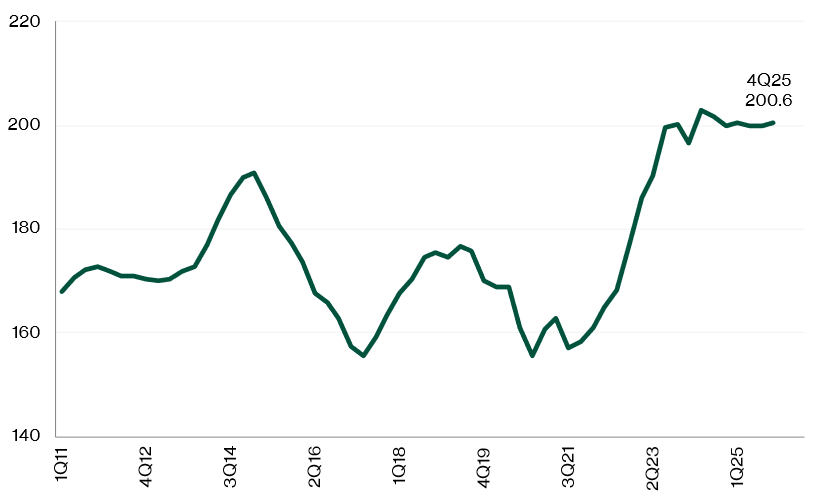
Central Region office rents also showed a modest rebound in 4Q25, ending two straight quarters of slight decline.
The URA Office Rental Index rose 0.4% quarter-on-quarter in 4Q25, reversing the 0.1% quarter-on-quarter drop in 3Q25 and the 0.3% quarter-on-quarter decline in 2Q25.
For full-year 2025, rents edged up 0.3%, following a flat outcome in 2024.
Demand continued to be anchored by an ongoing flight-to-quality trend, as occupiers prioritised premium, well-located and ESG-compliant buildings when relocating, with some also taking additional space to meet future growth needs.
Singapore’s stable and business-friendly environment further supported occupier interest despite broader global uncertainty.
The supply-demand balance tightened further in 4Q25. URA data shows no new office completions during the quarter, while net supply contracted by about 0.08 million sq ft, resulting in flat net absorption.
With new supply constrained, vacancy improvements were driven mainly by steady demand and limited additions to stock.
Office space vacancy rates
Office space rental index
Separately, the office market could tilt further in landlords’ favour in 2026, underpinned by steady occupier demand and a thin pipeline of new supply.
Key demand sources are expected to include financial services, technology, asset management and emerging AI-focused firms.
Large contiguous floor plates should remain scarce, with Shaw Towers the only major completion in 2026.
Against a sustained flight-to-quality trend and tight CBD Grade A availability, CBRE projects rental growth of around 5% year-on-year in 2026.
Looking ahead, a lower domestic interest-rate environment could provide additional support to investment demand, as prime office assets are increasingly offering positive carry alongside a more constructive rental outlook.
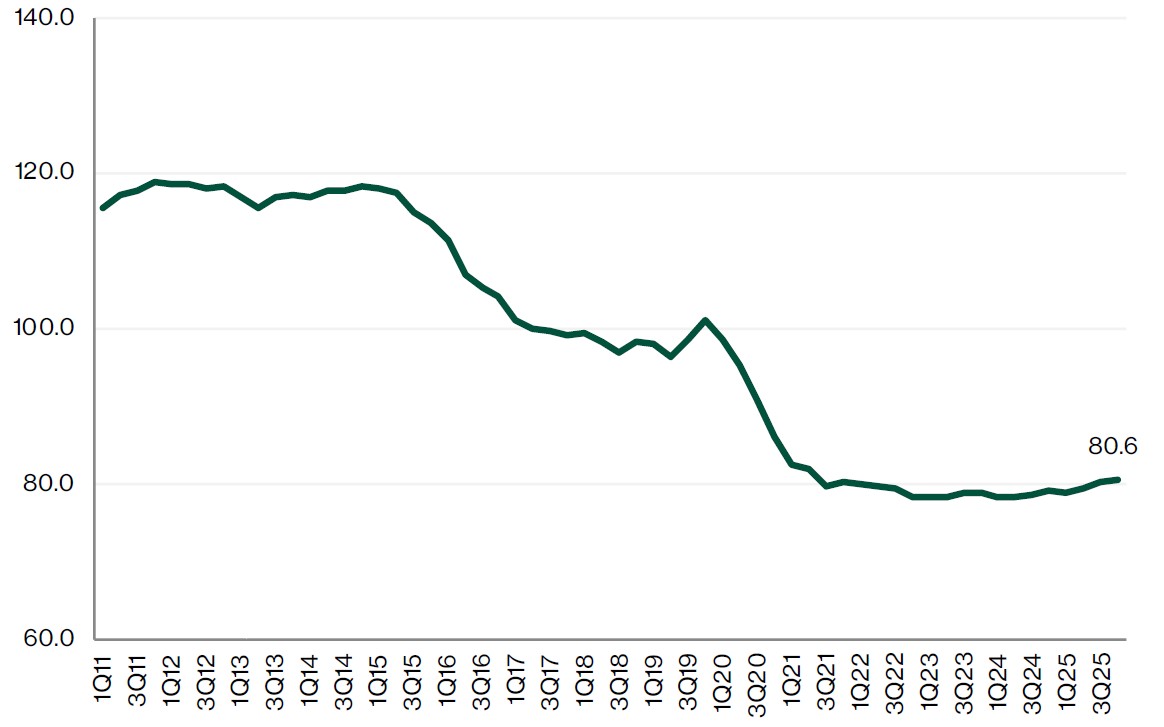
Retail rents increased quarter-on-quarter
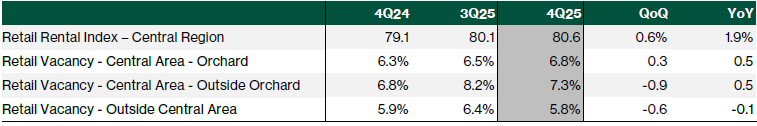
URA’s 4Q2025 figures show that Central Region retail rents rose 0.6% quarter-on-quarter, and 1.9% year-on-year.
Retail activity improved through October and November, with the retail sales index registering +0.7% year-on-year and +3.6% year-on-year, respectively, following a +2.2% year-on-year increase in 3Q2025.
Tourism recovery remained intact, with visitor arrivals up 4.9% year-on-year in October and 4.8% year-on-year in November 2025, helped by event-related demand, including the F1 period coinciding with China’s Golden Week.
Even with frequent headlines around store closures, leasing momentum held up in 4Q2025.
URA data shows the island-wide private retail market recorded net absorption of 34,000 sq m (about 366,000 sq ft) for the quarter, extending the positive absorption seen in 3Q2025.
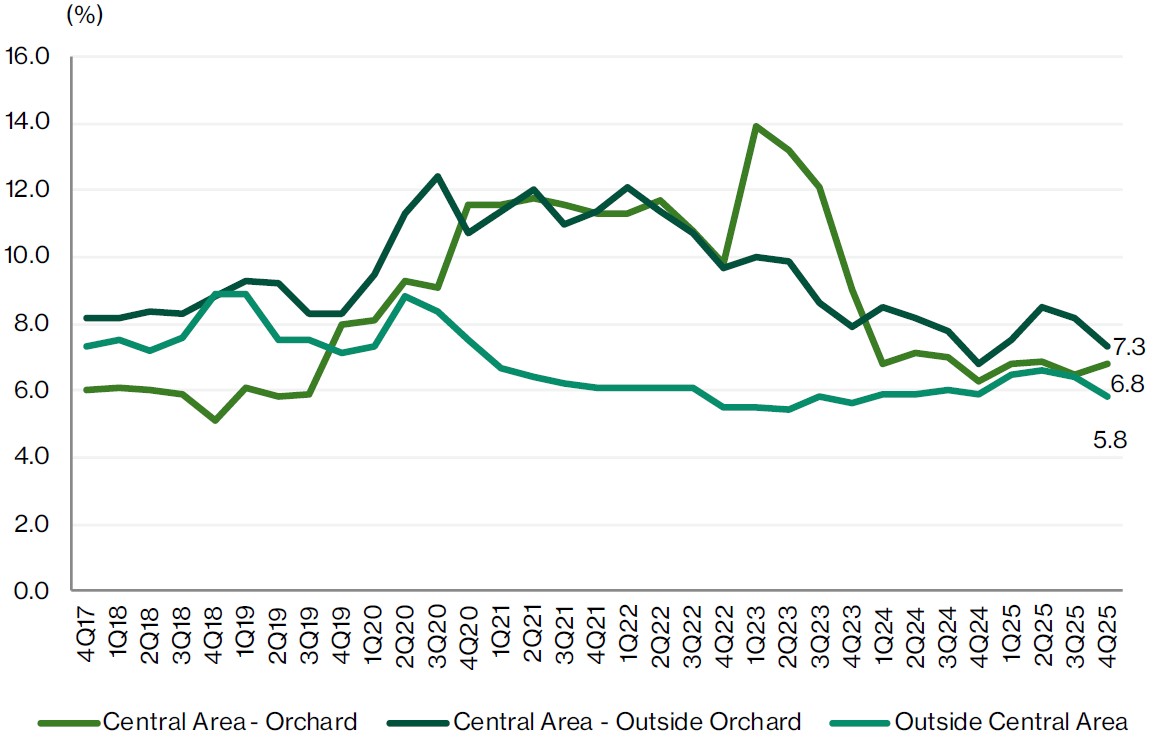
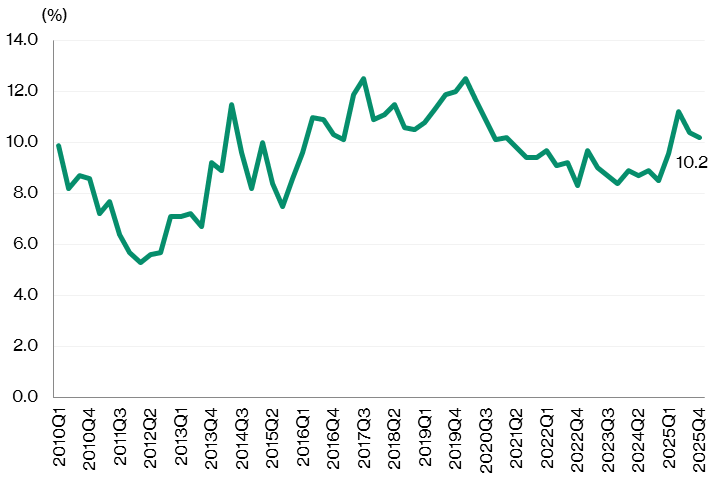
This tightening in occupied space was reflected in vacancy, with island-wide private retail vacancy easing from 7.2% in 3Q2025 to 6.4% in 4Q2025.
On a full-year basis, net absorption totalled 9,000 sq m (around 97,000 sq ft) versus new supply of 30,000 sq m (around 323,000 sq ft).
As a result, vacancy normalised from a decade-low 6.0% in 4Q2024 to 6.4% in 4Q2025—higher year-on-year, but still indicative of a relatively tight market overall.
Performance varied by submarket. Most areas posted positive net absorption in 4Q2025, with Orchard the notable exception.
The Outside Central Region (OCR) contributed the largest share of leasing gains, with 19,000 sq m (about 205,000 sq ft) of net absorption, supported by progressive tenant take-up at Lentor Modern Mall following its completion in August 2025.
OCR vacancy tightened meaningfully, from 5.9% in 3Q2025 to 4.4% in 4Q2025. Meanwhile, Orchard recorded negative net absorption of 5,000 sq m (about 54,000 sq ft), likely linked to move-outs from Taste Orchard ahead of the 31 December 2025 deadline, which pushed vacancy slightly higher from 6.3% to 6.6% over the quarter.
Looking into 2026, demand for prime retail space should continue to be underpinned by the ongoing tourism recovery and stable household spending, with sector outcomes likely to remain location- and asset-quality driven.
Retail space vacancy rates
Retail space rental index
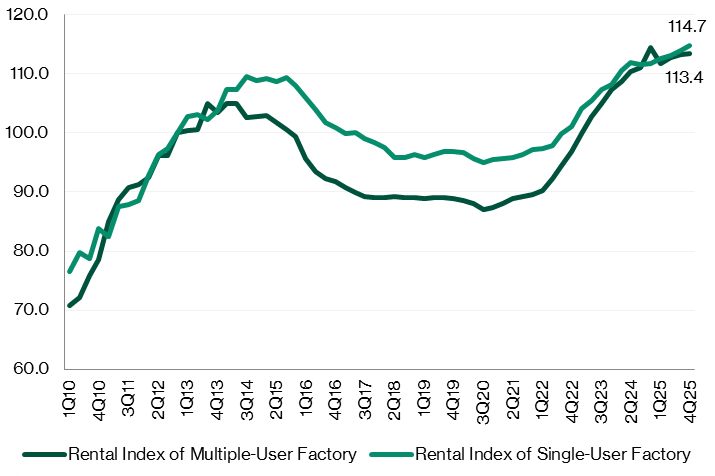
Industrial rents up marginally
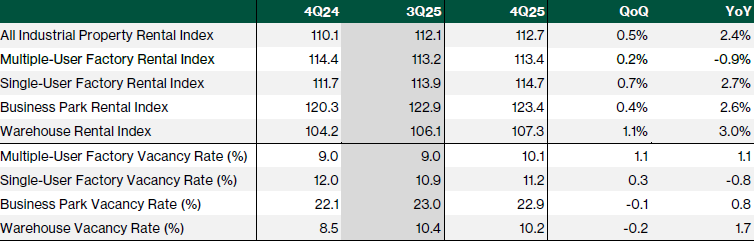
The JTC All Industrial Rental Index rose 0.5% q/q, matching the pace in 3Q2025 and extending the upcycle to a 21st consecutive quarter of increases.
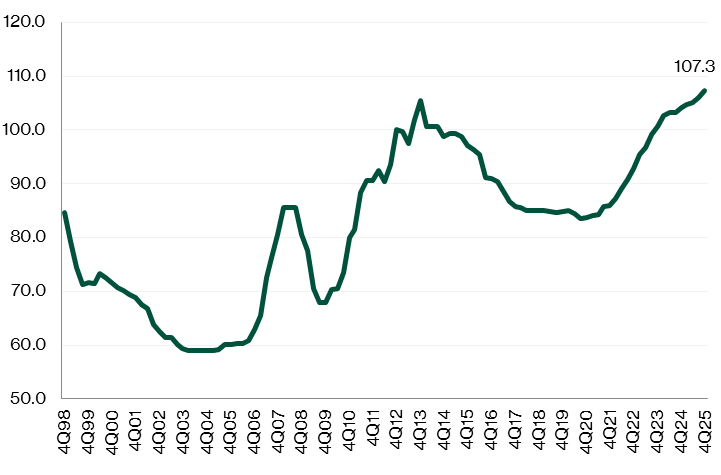
By segment, warehouse rents led the quarter, rising 1.1% q/q, an acceleration from +0.9% q/q in 3Q2025.
The segment’s resilience reflects continued demand for modern logistics facilities, which has supported higher average rents.
In 4Q2025, two significant warehouse projects were completed—Sankyu’s Tuas Distribution Hub (a fully air-conditioned prime logistics facility of over 400,000 sq ft) and Nippon Express’ expanded warehouse at 29 Tuas Avenue 13 (an additional 100,000 sq ft)—and the warehouse segment also recorded the largest improvement in occupancy, with occupancy edging up 0.2ppt to 89.8%.
Single-user factory rents also stayed firm, increasing 0.7% q/q in 4Q2025, in line with the prior quarter.
For the year, rents rose 2.7%, easing slightly from 3.2% in 2024. Notable completions during the quarter included facilities for Paxocean Engineering at 5 Jalan Samulun (partial TOP), Advanced Substrate Technologies at 9 Pesawat Drive (partial TOP), and Wuxi Biologics Biopharmaceuticals at 2 Tuas View Drive. Following these additions to stock, single-user factory occupancy dipped 0.3ppt to 88.8%.
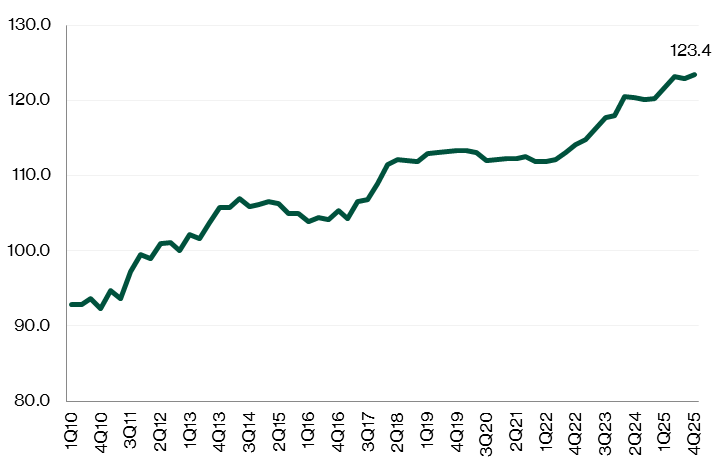
In the business park segment, rents increased 0.4% q/q in 4Q2025, reversing the 0.2% q/q decline in 3Q2025. For full-year 2025, business park rents rose 2.6%, accelerating from 1.9% in 2024.
Meanwhile, multi-user factory rents rose 0.2% q/q in 4Q2025, slowing from 0.4% q/q in the previous quarter.
Full-year growth moderated to +1.8% in 2025, down from +3.8% in 2024. Supply additions were more visible here: key completions included Bulim Square (remaining TOP) and Stellar@Tampines (partial TOP), alongside two food-factory developments—Food Ascent and Food Vision @ Mandai. Reflecting these completions, multi-user factory occupancy fell 1.1ppt to 89.9% in 4Q2025.
Single-user and multiple-user factory space rental index
Warehouse rental index
Business Park rental index
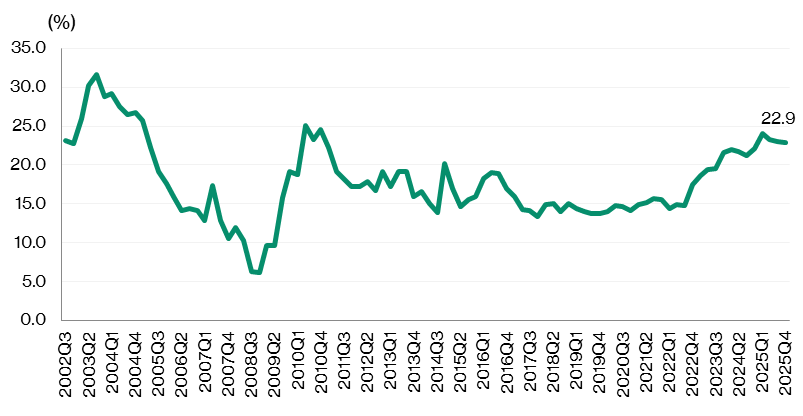
Multiple-user factory space vacancy rate
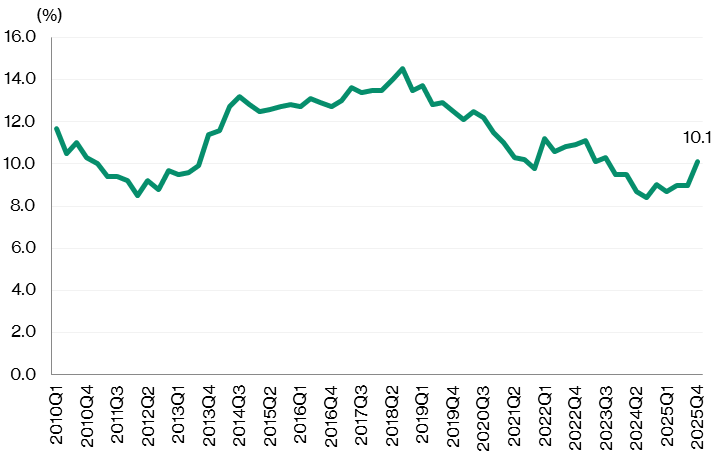
Single-user factory space vacancy rate
Warehouse space vacancy rate
Business Park vacancy rate
Based on planning approvals as at end-December 2025, around 1.0 million sqm of new industrial space is expected to be completed in 2026.
The pipeline is heavily skewed towards single-user factories, which account for roughly 53% of expected supply and are typically built for owner-occupation.
Warehouses make up a further 29%, while multi-user factories and business park space contribute about 16% and 2%, respectively.
Looking further out, an additional 2.5 million sqm of industrial space is projected to be delivered across 2027–2028, implying average annual completions of around 1.1 million sqm over 2026–2028.
This forward supply run-rate is meaningfully higher than the recent historical trend.
Over the past three years, average annual supply and demand were approximately 0.8 million sqm and 0.6 million sqm, respectively, suggesting that completions could outpace absorption unless demand accelerates or deliveries are deferred.
Within business parks, the upcoming pipeline remains particularly thin. Across the next three years, 27 IBP (approximately 0.21 million sq ft) is the only business park project scheduled for completion in 2026. With more landlords assessing and executing asset enhancement initiatives to refresh ageing facilities, effective supply in parts of the business park segment could tighten further, potentially supporting better leasing outcomes for upgraded, higher-spec assets.
Going forward, vacancy rates are expected to remain stable with some moderation in rental rates.
As at end-September 2025, the average annual supply is estimated at 1.2 million sqm for the next three years.
Based on the average annual industrial space demand of about 0.6 million square metres, the market could face new supply outpaces absorption for certain segments.
While the total expected completion over the next two years includes 0.9 mn sqm of single-user factory space, which is typically developed by the industrialists for their own use, the significant supply pipeline of industrial space across warehouses, multiple-user factories and business parks are expected to add pressure to rents and vacancies in the near term.
Business parks in particular are expected to see the greatest pressure, given muted new demand and the consolidation of space requirements.
Bifurcated performance of Singapore REITs
Singapore REITs have continued to recover, but performance has become increasingly selective.
The S-REIT index is down 0.5% year-to-date (as of 12 Feb 26), it still trailed the Straits Times Index, which gained 8.0% over the same period.
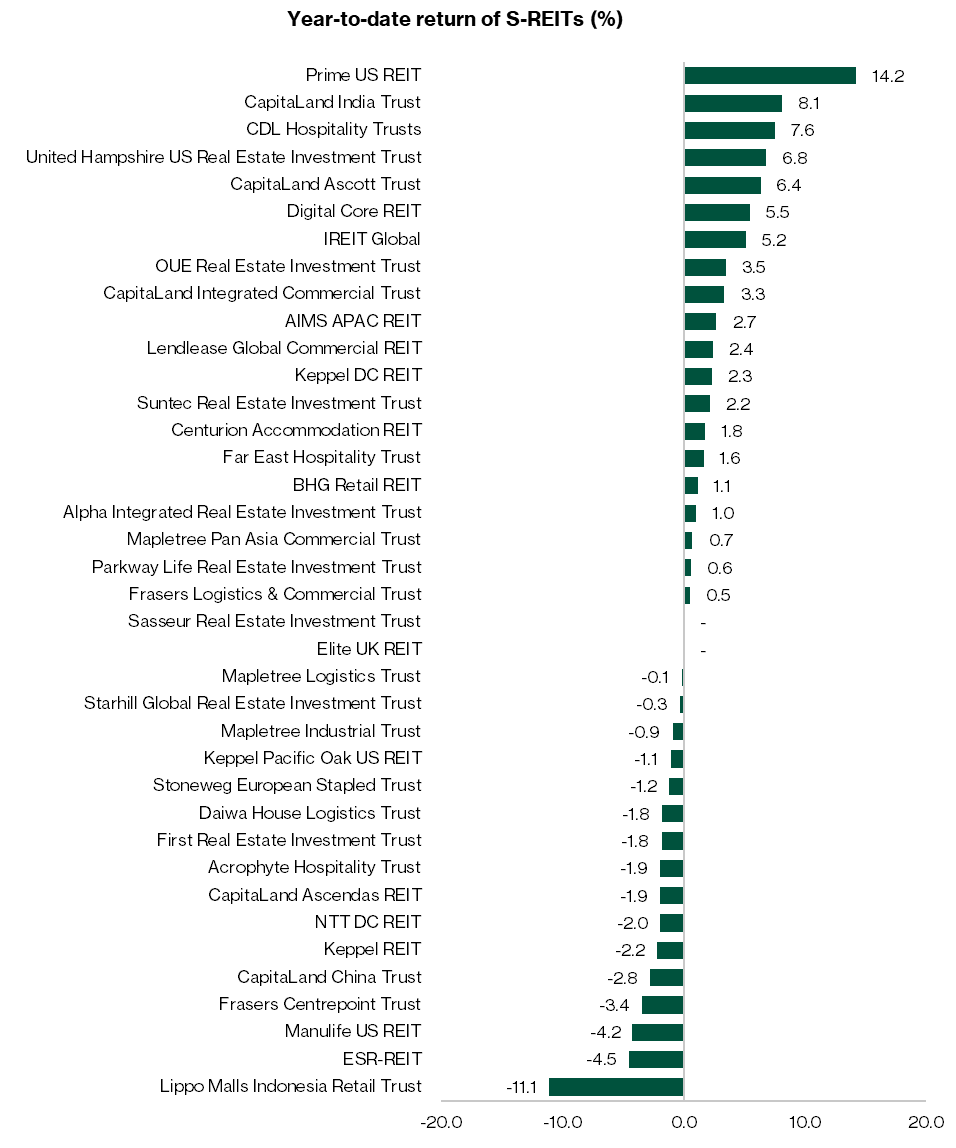
More recently, the dispersion across individual S-REITs has been wide, with year-to-date returns ranging from strong double-digit gains, led by Prime US REIT (+14.2%) and Capitaland India Trust (+8.1%), to meaningful underperformance in weaker names, such as Lippo Malls Indonesia Retail Trust (-11.1%).
In our view, REITs with exposure to Singapore office and industrial assets, where demand and rental income have remained comparatively resilient, have generally held up better and, in some cases, delivered steadier DPU outcomes.
In contrast, higher-leverage platforms and those with larger overseas exposures have tended to lag, as refinancing sensitivity and FX translation effects continue to weigh on distributions.
Preference for REITs with ability to grow distributions
We continue to see Singapore REITs as key beneficiaries of a more benign interest-rate backdrop, as easing funding pressure improves distribution visibility and reopens the window for accretive capital management.
Within the sector, we prefer REITs that can defend and compound DPU through active portfolio actions—such as well-timed AEIs, disciplined capital recycling, selective acquisitions, and the ability to capture rental reversion where fundamentals allow.
In this context, we highlight CapitaLand India Trust, Digital Core REIT and OUE Real Estate Investment Trust as preferred exposures.
Read also:
- CapitaLand India Trust - Higher DPU from improved operating performance
- Digital Core REIT - Stable DPU and improved income visibility
- OUE REIT - Lower interest expense to support DPU growth
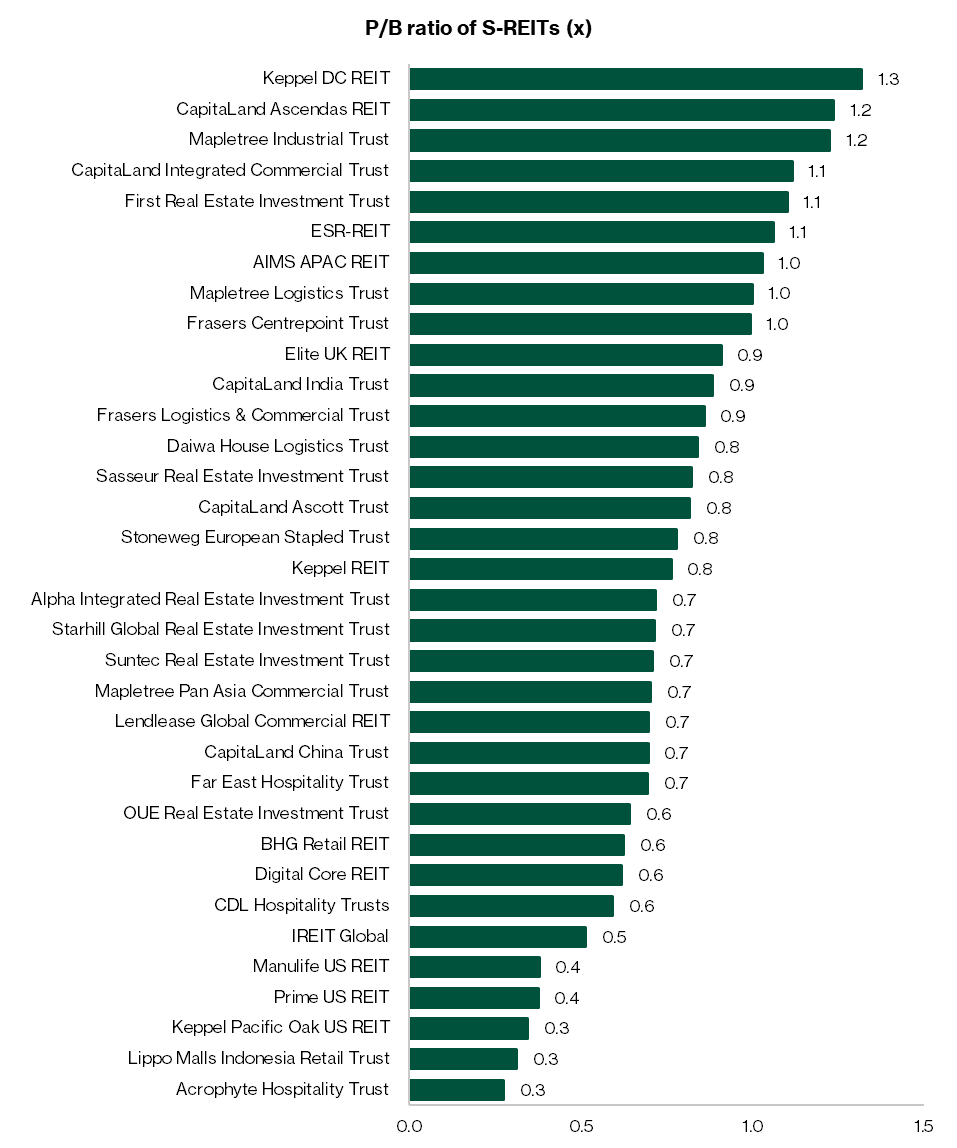
To screen for Singapore REITs with lowest price-to-book valuation or highest dividend yield, check out our best Singapore REIT screener.
If you are new to investing in Singapore REITs, you can start to learn more about Singapore REITs here.
If you prefer diversification without picking individual REITs, you can also gain exposure through Singapore REIT ETFs.
Download the full report here.
Check out Beansprout's guide to the best stock trading platforms in Singapore with the latest promotions to invest in Singapore REITs Sector.
Follow us on Telegram, Youtube, Facebook and Instagram to get the latest financial insights.
Important Disclosures
Analyst Certification and Disclosures
The analyst(s) named in this report certifies that (i) all views expressed in this report accurately reflect the personal views of the analyst(s) with regard to any and all of the subject securities and companies mentioned in this report and (ii) no part of the compensation of the analyst(s) was, is, or will be, directly or indirectly, related to the specific views expressed by that analyst herein. The analyst(s) named in this report (or their associates) does not have a financial interest in the corporation(s) mentioned in this report.
An associate is defined as (i) the spouse, or any minor child (natural or adopted) or minor step-child, of the analyst; (ii) the trustee of a trust of which the analyst, his spouse, minor child (natural or adopted) or minor step-child, is a beneficiary or discretionary object; or (iii) another person accustomed or obliged to act in accordance with the directions or instructions of the analyst.
Company Disclosure
Global Wealth Technology Pte Ltd (“Beansprout”) does not have any financial interest in the corporation(s) mentioned in this report.
Disclaimer
This report is provided by Beansprout for the use of intended recipients only and may not be reproduced, in whole or in part, or delivered or transmitted to any other person without our prior written consent. By accepting this report, the recipient agrees to be bound by the terms and limitations set out herein.
You acknowledge that this document is provided for general information purposes only. Nothing in this document shall be construed as a recommendation to purchase, sell, or hold any security or other investment, or to pursue any investment style or strategy. Nothing in this document shall be construed as advice that purports to be tailored to your needs or the needs of any person or company receiving the advice. The information in this document is intended for general circulation only and does not constitute investment advice. Nothing in this document is published with regard to the specific investment objectives, financial situation and particular needs of any person who may receive the information.
Nothing in this document shall be construed as, or form part of, any offer for sale or subscription of or solicitation or invitation of any offer to buy or subscribe for any securities. The data and information made available in this document are of a general nature and do not purport, and shall not in any way be deemed, to constitute an offer or provision of any professional or expert advice, including without limitation any financial, investment, legal, accounting or tax advice, and shall not be relied upon by you in that regard. You should at all times consult a qualified expert or professional adviser to obtain advice and independent verification of the information and data contained herein before acting on it. Any financial or investment information in this document are intended to be for your general information only. You should not rely upon such information in making any particular investment or other decision which should only be made after consulting with a fully qualified financial adviser. Such information do not nor are they intended to constitute any form of financial or investment advice, opinion or recommendation about any investment product, or any inducement or invitation relating to any of the products listed or referred to. Any arrangement made between you and a third party named on or linked to from these pages is at your sole risk and responsibility.
You acknowledge that Beansprout is under no obligation to exercise editorial control over, and to review, edit or amend any data, information, materials or contents of any content in this document. You agree that all statements, offers, information, opinions, materials, content in this document should be used, accepted and relied upon only with care and discretion and at your own risk, and Beansprout shall not be responsible for any loss, damage or liability incurred by you arising from such use or reliance.
This document (including all information and materials contained in this document) is provided “as is”. Although the material in this document is based upon information that Beansprout considers reliable and endeavours to keep current, Beansprout does not assure that this material is accurate, current or complete and is not providing any warranties or representations regarding the material contained in this document. All opinions contained herein constitute the views of the analyst(s) named in this report, they are subject to change without notice and are not intended to provide the sole basis of any evaluation of the subject securities and companies mentioned in this report. Any reference to past performance should not be taken as an indication of future performance. To the fullest extent permissible pursuant to applicable law, Beansprout disclaims all warranties and/or representations of any kind with regard to this document, including but not limited to any implied warranties of merchantability, non-infringement of third-party rights, or fitness for a particular purpose.
Beansprout does not warrant, either expressly or impliedly, the accuracy or completeness of the information, text, graphics, links or other items contained in this document. Neither Beansprout nor any of its affiliates, directors, employees or other representatives will be liable for any damages, losses or liabilities of any kind arising out of or in connection with the use of this document. To the best of Beansprout’s knowledge, this document does not contain and is not based on any non-public, material information. The information in this document is not intended for distribution to, or use by, any person or entity in any jurisdiction where such distribution or use would be contrary to law or regulation, or which would subject Beansprout to any registration requirement within such jurisdiction or country. Beansprout is not licensed or regulated by any authority in any jurisdiction or country to provide the information in this document.
As a condition of your use of this document, you agree to indemnify, defend and hold harmless Beansprout and its affiliates, and their respective officers, directors, employees, members, managing members, managers, agents, representatives, successors and assigns from and against any and all actions, causes of action, claims, charges, cost, demands, expenses and damages (including attorneys’ fees and expenses), losses and liabilities or other expenses of any kind that arise directly or indirectly out of or from, arising out of or in connection with violation of these terms, use of this document, violation of the rights of any third party, acts, omissions or negligence of third parties, their directors, employees or agents. To the extent permitted by law, Beansprout shall not be liable to you, any other person, or organization, for any direct, indirect, special, punitive, exemplary, incidental or consequential damages, whether in contract, tort (including negligence), or otherwise, arising in any way from, or in connection with, the use of this document and/or its content. This includes, without limitation, liability for any act or omission in reliance on the information in this document. Beansprout expressly disclaims and excludes all warranties, conditions, representations and terms not expressly set out in this User Agreement, whether express, implied or statutory, with regard to this document and its content, including any implied warranties or representations about the accuracy or completeness of this document and the content, suitability and general availability, or whether it is free from error.
If these terms or any part of them is understood to be illegal, invalid or otherwise unenforceable under the laws of any state or country in which these terms are intended to be effective, then to the extent that they are illegal, invalid or unenforceable, they shall in that state or country be treated as severed and deleted from these terms and the remaining terms shall survive and remain fully intact and in effect and will continue to be binding and enforceable in that state or country.
These terms, as well as any claims arising from or related thereto, are governed by the laws of Singapore without reference to the principles of conflicts of laws thereof. You agree to submit to the personal and exclusive jurisdiction of the courts of Singapore with respect to all disputes arising out of or related to this Agreement. Beansprout and you each hereby irrevocably consent to the jurisdiction of such courts, and each Party hereby waives any claim or defence that such forum is not convenient or proper.
Read also
Gain financial insights in minutes
Subscribe to our free weekly newsletter for more insights to grow your wealth
Most Popular

Comments
0 comments