DBS, UOB and OCBC in focus: Weekly Review with SIAS
Stocks
Powered by
By Gerald Wong, CFA • 10 Nov 2025
Why trust Beansprout? We’ve been awarded Best Investment Website at the SIAS Investors’ Choice Awards 2025
'%3e%3cpath%20fill-rule='evenodd'%20clip-rule='evenodd'%20d='M17.64%209.20455C17.64%208.56637%2017.5827%207.95273%2017.4764%207.36364H9V10.845H13.8436C13.635%2011.97%2013.0009%2012.9232%2012.0477%2013.5614V15.8195H14.9564C16.6582%2014.2527%2017.64%2011.9455%2017.64%209.20455V9.20455Z'%20fill='%234285F4'/%3e%3cpath%20fill-rule='evenodd'%20clip-rule='evenodd'%20d='M9%2018C11.43%2018%2013.4673%2017.1941%2014.9564%2015.8195L12.0477%2013.5614C11.2418%2014.1014%2010.2109%2014.4205%209%2014.4205C6.65591%2014.4205%204.67182%2012.8373%203.96409%2010.71H0.957275V13.0418C2.43818%2015.9832%205.48182%2018%209%2018V18Z'%20fill='%2334A853'/%3e%3cpath%20fill-rule='evenodd'%20clip-rule='evenodd'%20d='M3.96409%2010.71C3.78409%2010.17%203.68182%209.59318%203.68182%209C3.68182%208.40682%203.78409%207.83%203.96409%207.29V4.95818H0.957273C0.347727%206.17318%200%207.54773%200%209C0%2010.4523%200.347727%2011.8268%200.957273%2013.0418L3.96409%2010.71V10.71Z'%20fill='%23FBBC05'/%3e%3cpath%20fill-rule='evenodd'%20clip-rule='evenodd'%20d='M9%203.57955C10.3214%203.57955%2011.5077%204.03364%2012.4405%204.92545L15.0218%202.34409C13.4632%200.891818%2011.4259%200%209%200C5.48182%200%202.43818%202.01682%200.957275%204.95818L3.96409%207.29C4.67182%205.16273%206.65591%203.57955%209%203.57955V3.57955Z'%20fill='%23EA4335'/%3e%3c/g%3e%3cdefs%3e%3cclipPath%20id='clip0_0_2849'%3e%3crect%20width='18'%20height='18'%20fill='white'/%3e%3c/clipPath%3e%3c/defs%3e%3c/svg%3e)
Make Beansprout your preferred source on Google
Add us on Google to see more of our insights in your search results
We share about the DBS, UOB and OCBC in the latest Weekly Market Review.

What happened?
In this week's Weekly Market Review in partnership with Securities Investors Association Singapore (SIAS), we discuss key developments in the global equity market alongside DBS, UOB and OCBC.
Watch the video to learn more about what we are looking out for this week.
Weekly Market Review
1:41 - Macro Update
US markets declined with S&P 500 down 1.6% and Nasdaq falling 3%, driven by concerns over tech stock valuations and sustainability of AI spending.
Singapore's STI gained 1.4% and exceeded 4,500 points during the week, closing at 4,492 points, bucking the US market downward trend and rebounding strongly from April lows to reach new record highs.
The STI rally was driven by several blue chip companies hitting record highs following positive corporate news and earnings announcements.
Top performers included Singtel (+9%), Wilmar International (+5%), OCBC (+4.4%), and UOL (+2.3%).
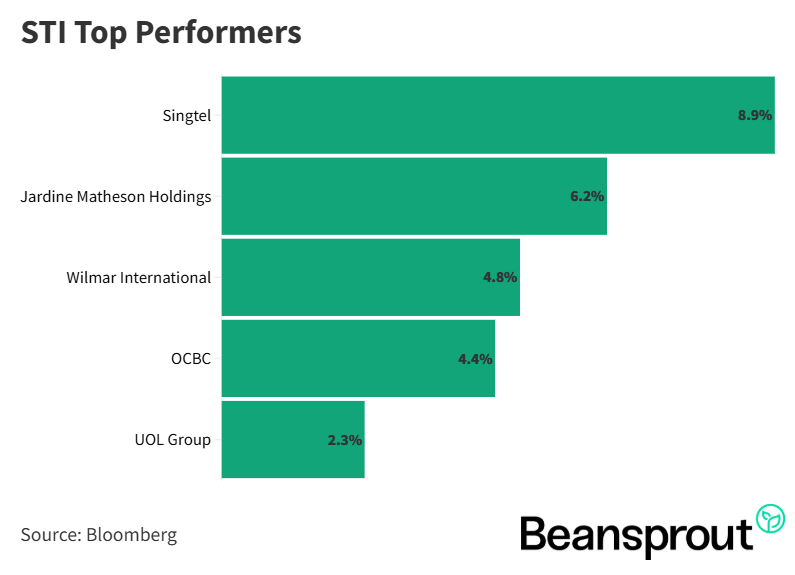
STI Top Performers:
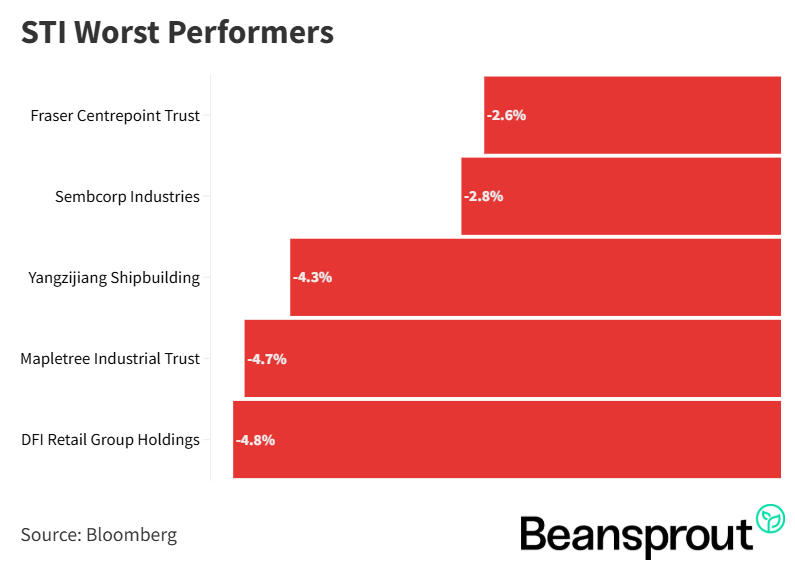
STI Worst Performers:
- Fraser Centrepoint Trust
- Sembcorp Industries
- Yangzijiang Shipbuilding
- Mapletree Industrial Trust
- DFI Retail Group Holdings
DBS (SGX: D05)
DBS reached a new record high above $55 after reporting Q3 2025 earnings with record profit before tax of $3.5 billion (+1% YoY), exceeding market expectations with resilient total income and profit before allowances.
Net interest margin declined from 2.05% to 1.96% quarter-over-quarter, reflecting pressure from the lower interest rate environment on the bank's interest income.
Fee income showed strong 20% YoY growth to $1.58 billion, driven primarily by wealth management fee income.
DBS maintained its dividend at $0.60 quarterly plus $0.15 capital return for a total of $0.75 per share in Q3, unchanged from the previous quarter but higher than the previous year.
Management expects 2026 total income to remain around 2025 levels despite interest rate headwinds, with group net interest income slightly below 2025 but offset by non-interest income growth.
Stock currently trades at 14x P/E and 2.3x P/B (both above historical averages).
Read our analysis of DBS 3Q2025 earnings here.
Related Links:
UOB (SGX: U11)
UOB's share price declined following Q3 2025 earnings announcement, with net profit down (-72% YoY) in Q3, driven by an 11% decline in total income and a 16% drop in operating profit.
Net interest margin compressed to 1.82% in Q3 from 1.91% in the previous quarter due to lower interest rates, while fee income of $892 million showed 8% quarter-over-quarter growth.
The sharp profit decline was primarily caused by a significant general allowance of $687 million taken on loans in Q3 2025, reflecting provisioning for the China loan book due to the uncertain macro environment.
UOB maintains half-yearly dividend payments (interim dividend of $0.85 for H1) and indicated the Q3 provisions are unlikely to impact full year 2025 dividend expectations.
Management expects 2026 to see low single-digit loan growth, full year net interest margin of 1.75-1.8% (lower than 2025), and high single to double-digit fee income growth.
Stock currently trades at 9.5x P/E (near historical average) and 1.2x P/B (slightly above historical average)
Read our analysis of UOB 3Q2025 earnings here.
Related links:
OCBC (SGX: O39)
OCBC performed well after reporting Q3 2025 earnings, with net profit of $1.98 billion remaining close to the previous year's level, despite a 9% decline in net interest income due to lower interest rate pressures.
Net interest margin declined to 1.84% in Q3 from 1.92% in Q2, consistent with trends seen across DBS and UOB, reflecting the impact of the lower interest rate environment on the bank's net interest income.
The decline in net interest income was effectively mitigated by strong 15% YoY growth in non-interest income to $1.57 billion, driven particularly by net fees and commissions in wealth management.
Management expects volatile conditions to continue into 2026, with net interest income projected to decline by mid to high single-digit percentage compared to 2025 levels.
Stock currently trades at 10.8x P/E (above historical average of 8.7x) and 1.4x P/B (above historical average of 0.94x), reflecting a premium valuation compared to historical levels.
Related links:
16:13 - Technical Analysis
Straits Times Index (STI)
STI gained 1.4% last week following strong bank earnings announcements, touching a new all-time high of 4,520 points before pulling back 0.5% Monday morning to 4,470 points.
Key support levels identified include the 20-day moving average at 4,417 points, and the lower Bollinger Band at 4,331 points.
MACD indicator shows a slight positive reading but suggests range-bound movement between 4,500 (upper bound) and 4,368 (50-day MA lower bound) in the near term.
RSI reading at 61 indicates positive momentum remains intact despite the Monday morning pullback, with the uptrend still intact.
Learn more about the Straits Times Index (STI) here.
Dow Jones Industrial Average
Dow Jones closed at 46,987 points on Friday, down from its previous high of 48,040 points on October 29, and now trading below the 20-day moving average at 46,924 points.
Key support levels include the 50-day moving average at 46,391 points and the lower Bollinger Band at 45,800 points.
MACD turned negative after a crossover last Wednesday, indicating potential downside pressure, while RSI sits neutral at 52 points, suggesting contradicting market direction signals
S&P 500
S&P 500 closed at 6,728 points on Friday after breaching the 50-day moving average at 6,670 points, indicating strong market comeback.
Key support levels include the 50-day moving average at 6,670 points, lower Bollinger Band at 6,593 points, and the critical 6,600 level that must hold for the uptrend to continue.
MACD has turned negative, indicating potential downside pressure, while RSI remains neutral at 48 points.
Nasdaq Composite Index
Nasdaq Composite was the worst performer among the three major US indices last week, with a 3% decline driven by tech valuation concerns, closing at approximately 23,004 points.
The index is now at a key support level with the 50-day moving average providing immediate support, while the next support lies at the lower Bollinger Band at 22,255 points.
MACD indicates near-term negative pressure, suggesting potential downside, while RSI sits at the 50-point neutral mark, indicating a lack of momentum in either direction.
What to look out for this week
Tuesday, 11 November 2025: SIA Engineering ex-dividend
Wednesday, 12 November 2025: Singtel, NTT DC REIT earnings, Lendlease REIT ex-dividend
Thursday, 13 November 2025: SIA, SATS earnings, DBS, AIMS APAC REIT ex-dividend, US CPI data
Friday, 14 November 2025: Frasers Property earnings
Get the full list of stocks with upcoming dividends here.
Follow us on Telegram, Youtube, Facebook and Instagram to get the latest financial insights.
Read also
Gain financial insights in minutes
Subscribe to our free weekly newsletter for more insights to grow your wealth
Most Popular

Comments
0 comments