DBS and Sembcorp Industries in focus: Weekly Review with SIAS
Stocks
Powered by
By Gerald Wong, CFA • 11 Aug 2025
Why trust Beansprout? We’ve been awarded Best Investment Website at the SIAS Investors’ Choice Awards 2025
'%3e%3cpath%20fill-rule='evenodd'%20clip-rule='evenodd'%20d='M17.64%209.20455C17.64%208.56637%2017.5827%207.95273%2017.4764%207.36364H9V10.845H13.8436C13.635%2011.97%2013.0009%2012.9232%2012.0477%2013.5614V15.8195H14.9564C16.6582%2014.2527%2017.64%2011.9455%2017.64%209.20455V9.20455Z'%20fill='%234285F4'/%3e%3cpath%20fill-rule='evenodd'%20clip-rule='evenodd'%20d='M9%2018C11.43%2018%2013.4673%2017.1941%2014.9564%2015.8195L12.0477%2013.5614C11.2418%2014.1014%2010.2109%2014.4205%209%2014.4205C6.65591%2014.4205%204.67182%2012.8373%203.96409%2010.71H0.957275V13.0418C2.43818%2015.9832%205.48182%2018%209%2018V18Z'%20fill='%2334A853'/%3e%3cpath%20fill-rule='evenodd'%20clip-rule='evenodd'%20d='M3.96409%2010.71C3.78409%2010.17%203.68182%209.59318%203.68182%209C3.68182%208.40682%203.78409%207.83%203.96409%207.29V4.95818H0.957273C0.347727%206.17318%200%207.54773%200%209C0%2010.4523%200.347727%2011.8268%200.957273%2013.0418L3.96409%2010.71V10.71Z'%20fill='%23FBBC05'/%3e%3cpath%20fill-rule='evenodd'%20clip-rule='evenodd'%20d='M9%203.57955C10.3214%203.57955%2011.5077%204.03364%2012.4405%204.92545L15.0218%202.34409C13.4632%200.891818%2011.4259%200%209%200C5.48182%200%202.43818%202.01682%200.957275%204.95818L3.96409%207.29C4.67182%205.16273%206.65591%203.57955%209%203.57955V3.57955Z'%20fill='%23EA4335'/%3e%3c/g%3e%3cdefs%3e%3cclipPath%20id='clip0_0_2849'%3e%3crect%20width='18'%20height='18'%20fill='white'/%3e%3c/clipPath%3e%3c/defs%3e%3c/svg%3e)
Make Beansprout your preferred source on Google
Add us on Google to see more of our insights in your search results
We share about DBS and Sembcorp Industries in the latest Weekly Market Review.

What happened?
In this week's Weekly Market Review in partnership with Securities Investors Association Singapore (SIAS), we discuss key developments in the global equity market alongside DBS and Sembcorp Industries.
Watch the video to learn more about what we are looking out for this week.
Weekly Market Review
1:43 - Macro Update
- Global markets rebounded over the past week on stronger expectations of US Federal Reserve rate cuts, with the S&P 500 nearing its all-time high and the Nasdaq gaining 3.9% to a record level.
- The Straits Times Index rose 2.1% to above 4,200 points, supported by positive earnings surprises and a rebound in REITs.
- US 1-year government bond yield fell sharply from above 4.1% to around 3.85% before settling near 3.94%, reflecting increased rate cut expectations after weak employment data were released.
- Probability of a September Fed rate cut increased from about 80% to 90%, with potential for additional cuts in October and December.
- Top STI performers included Yangzijiang Shipbuilding up 13%, DBS up 7%, and Mapletree Pan Asia Commercial Trust up 4%.
- Notable laggards were Singapore Airlines down 4.3% and Sembcorp Industries down 12% following disappointing results.
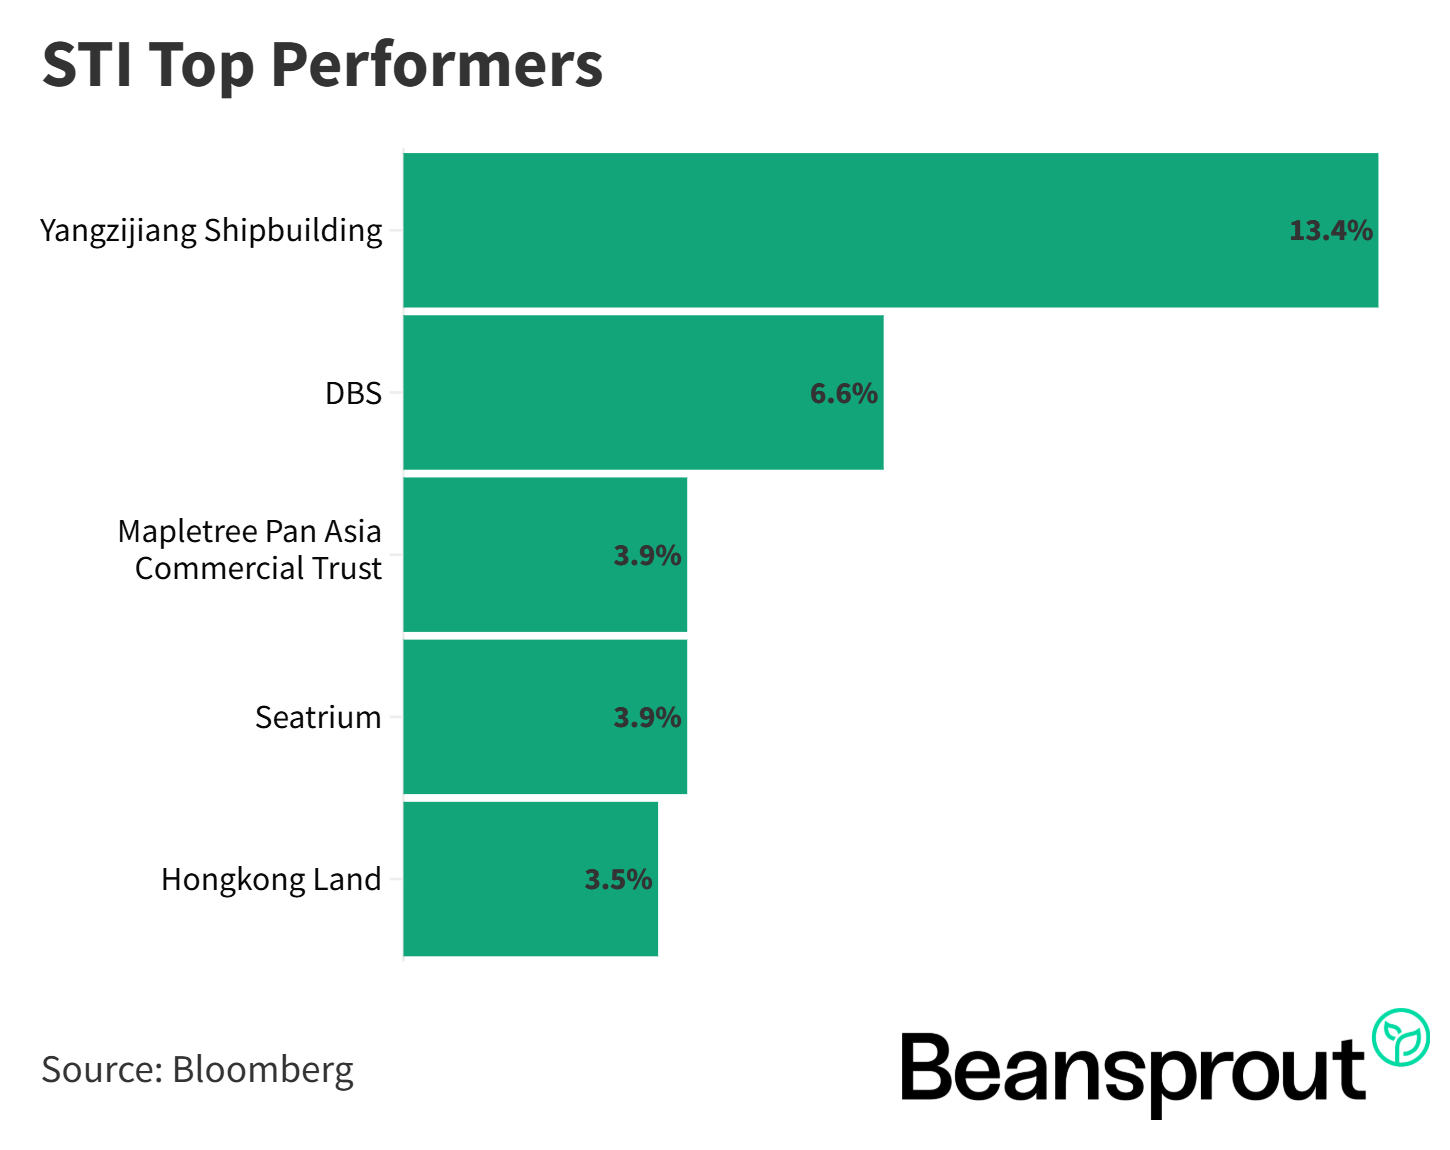
STI Top Performers:
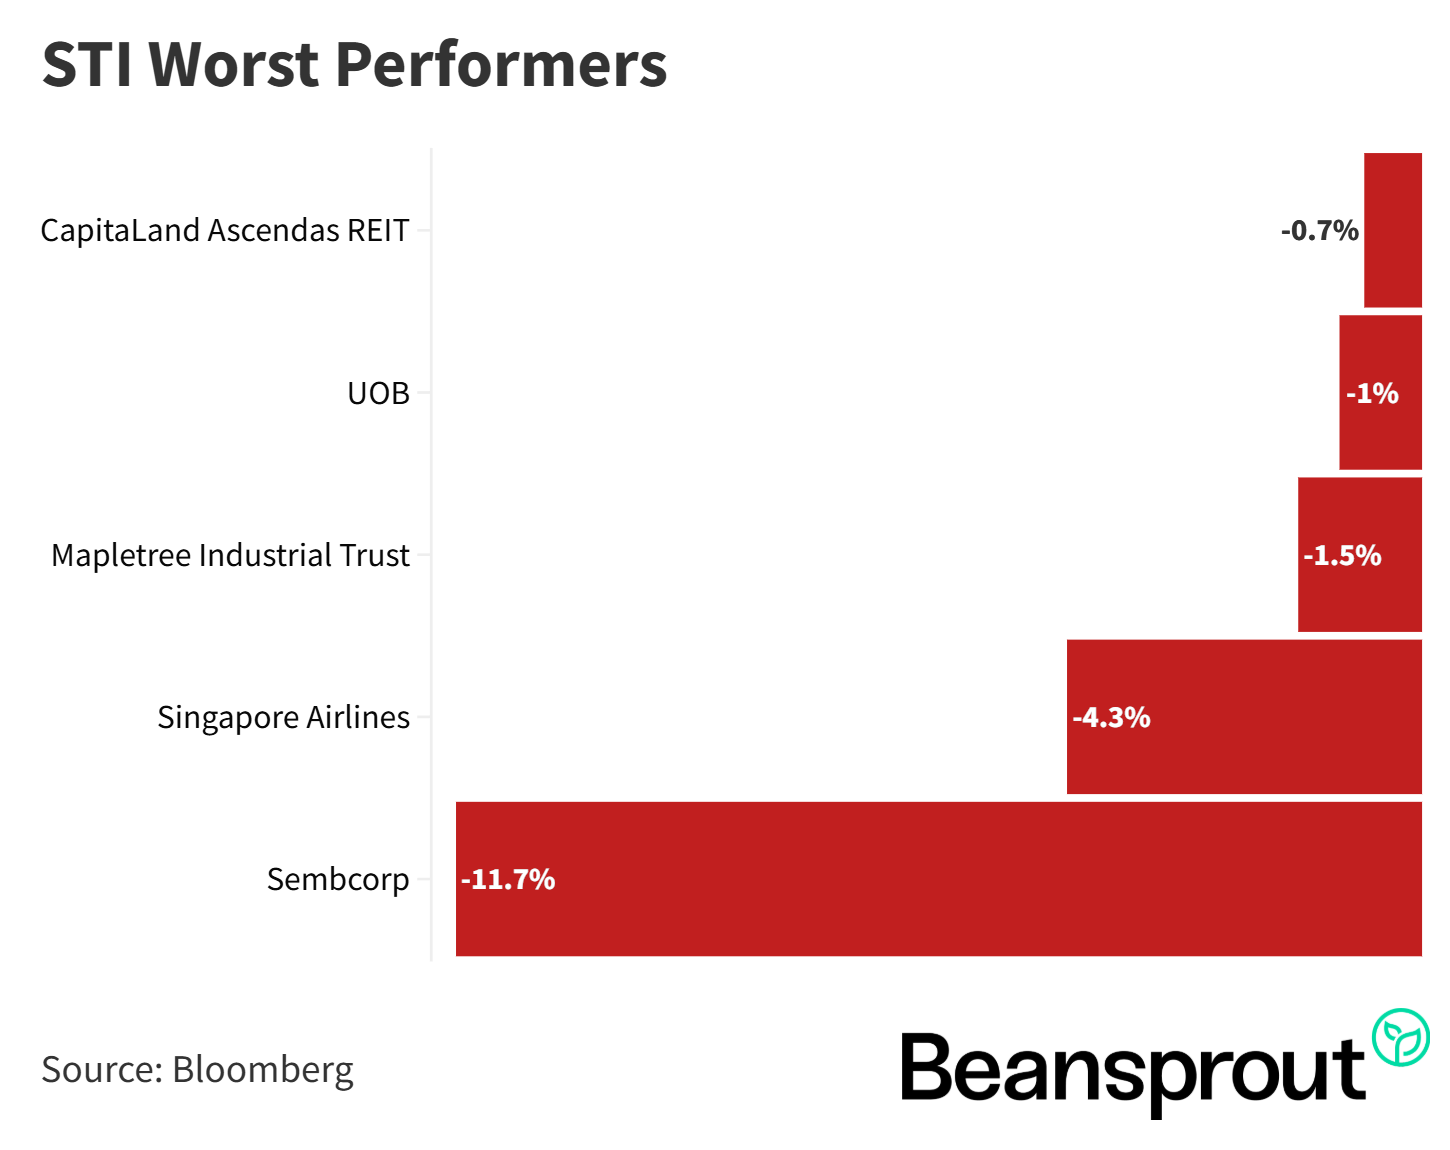
STI Worst Performers:
4:27 - DBS
- DBS share price reached a new all-time high above $50 after reporting first-half earnings, with Q2 net profit at $2.8 billion, up 1% year-on-year.
- Group net interest margin fell from 2.14% in Q2 2024 to 2.05% in Q2 2025, but loan growth supported overall net interest income growth.
- Fee income rose 10% year-on-year to $1.4 billion, driven by a 25% increase in wealth management fees to $649 million.
- Non-interest income increased due to higher fee income as well as gains from market trading and other income, offsetting NIM pressure.
- The bank declared a total Q2 dividend of $0.75, bringing first-half dividends to $1.50, with a projected full-year dividend yield of 6%.
- Outlook points to slightly higher 2025 net interest income versus 2024, mid to high single-digit growth in commercial book non-interest income, and slightly lower net profit due to the global minimum tax impact.
Read also:
DBS reports 1% profit growth and maintains healthy dividend payout: Our Quick Take
Related links:
9:00 - Sembcorp Industries
- Sembcorp Industries share price dropped to about $6.70 after its first-half 2025 earnings, though the stock retains roughly a 20% gain year-to-date.
- Net profit for H1 2025 dipped 1% year-on-year to around $491 million, with overall net profit growth stalling after robust gains in prior years (2020–2024 CAGR: 36%).
- Gas and related services profit fell 3% due to a 39% decline in Singapore power prices, while renewables profit grew 27% year-on-year but faced headwinds from lower Chinese power prices, grid export constraints, and a regional supply-demand imbalance.
- The renewables segment’s growth in China was tempered by slower demand growth than new capacity, and export limitations hindered full realisation of the increased output.
- A stronger Singapore dollar resulted in a $23 million negative currency translation impact on first-half earnings, reflecting the company’s diverse regional operations.
- The UK energy segment faces additional headwinds due to reduced demand following the closure of a major facility, impacting gas and related services further.
- Guidance for 2025 points to resilient overall performance but continued segment pressures: lower renewed contract spreads for gas, UK demand reductions, seasonality in renewables, and sustained weakness in China renewables.
- Renewables portfolio expanded to 18.9GW by mid-2025 from 16.8GW at end-2024, with management targeting 25GW by 2028 as part of its long-term strategic aims.
- Sembcorp Industries plans to maintain a sustainable dividend payout in line with underlying earnings and stated policy, with the H1 results not prompting a revision of dividend approach.
- The company’s valuation stands at about 10x P/E, a touch above historical average
Read also:
Sembcorp Industries falls by 14% due to earnings disappointment: Our Quick Take
Related links:
- Sembcorp Industries share price history and share price target
- Sembcorp Industries dividend forecast and dividend yield
15:25 - Technical Analysis
Straits Times Index
- The Straits Times Index gained over 2% last week and is holding steady near record levels, just 30–35 points below its all-time high of 4,274 set on 24 July.
- Near-term upside target is around the upper Bollinger Band at 4,291, with potential to reach the 4,300 level if earnings season remains strong; year-to-date gain is about 11.76%.
- Given the strong run-up, further gains will require fresh catalysts, especially a supportive interest rate environment, while banks and some risk counters have been key drivers.
- Technicals point to a range-bound market into end-August, with support at the lower Bollinger Band of 4,125, reinforced by the recent low near 4,150, and next support at 4,060.
- MACD is slightly negative and moving sideways, supporting the view of consolidation; RSI is at 65, down from a July peak of 91 and near overbought territory, suggesting limited immediate upside.
- Overall momentum remains positive but the narrowing Bollinger Bands indicate sideways trading is likely in the near term.
Dow Jones Industrial Average
- The Dow Jones index rallied last week and is now trading around 44,175, approaching its all-time high of 45,016, with key near-term resistance at 45,000 and the upper Bollinger Band at 45,037.
- Immediate support levels are found at the lower Bollinger Band and 50-day average near 43,650–43,680, as well as a prior low of 43,325 set on August 1 following weak jobs data.
- The recent boost for Dow components included news of Apple, Nvidia, and AMD securing tariff exemptions, easing concerns about the impact of U.S. trade policy on major tech stocks.
- Technical indicators are mixed: the MACD is trending down and readings are negative, suggesting possible downside or at best sideways movement, while the RSI is neutral, just above the key 50 mark.
- The Dow is likely to consolidate in the near term, moving sideways with key support zones at 43,650 and stronger support around 43,000 (close to the 200-day moving average); resistance remains firm at the 45,000 level.
S&P 500
- The S&P 500 closed at 6,389, just below its all-time high of 6,427, with the upper Bollinger Band near 6,418, indicating strong recent momentum from tech stock rebounds.
- Key support is at the lower Bollinger Band and 50-day moving average between 6,177 and 6,223, with 6,200 as a psychologically important level; the recent low of 6,212 on August 1 also serves as support.
- The index is expected to remain range-bound between 6,200 and 6,500 in the coming weeks.
- Technical indicators are mixed: the MACD is slightly negative, while the RSI is at 62, reflecting modest but waning upward momentum.
- Upcoming CPI inflation data will be crucial for market direction; a cooler-than-expected inflation reading would bolster the case for a Fed rate cut in September and could drive the S&P 500 to new highs, while a hot report might dampen the rally.
- Market movement in the near term will likely hinge on inflation numbers and expectations for Federal Reserve policy actions.
Nasdaq Composite Index
- The Nasdaq Composite set a new all-time high and close, making it the strongest performer among the three major U.S. indices.
- With no immediate technical resistance, the next target level is 22,000, about 550 points above the current level.
- Key support is at 20,581, with the 50-day moving average around 20,310 providing an additional floor.
- MACD is still in negative territory but showing signs of upward convergence toward the signal line, indicating potential for further upside.
- RSI has rebounded from the 50-point level on August 1 to 67, showing healthy momentum and room to approach or exceed the overbought 70 mark.
- Overall technical momentum suggests the index could push towards the 22,000 handle if current strength continues.
What to look out for this week
- Tuesday, 12 August 2025: Prime US REIT, Wilmar International earnings, US CPI data
- Wednesday, 13 August 2025: EC World REIT, City Developments, UOL Group, Stoneweg Europe Stapled Trust, United Hampshire US REIT earnings
- Thursday, 14 August 2025: CapitaLand Investment, ST Engineering, Manulife US REIT, Sasseur REIT earnings
Get the full list of stocks with upcoming dividends here.
Follow us on Telegram, Youtube, Facebook and Instagram to get the latest financial insights.
Read also
Gain financial insights in minutes
Subscribe to our free weekly newsletter for more insights to grow your wealth
Most Popular

Comments
0 comments