ST Engineering, DFI Retail Group, and UOL in focus: Weekly Review with SIAS
Stocks
Powered by
By Gerald Wong, CFA • 05 Jan 2026
Why trust Beansprout? We’ve been awarded Best Investment Website at the SIAS Investors’ Choice Awards 2025
'%3e%3cpath%20fill-rule='evenodd'%20clip-rule='evenodd'%20d='M17.64%209.20455C17.64%208.56637%2017.5827%207.95273%2017.4764%207.36364H9V10.845H13.8436C13.635%2011.97%2013.0009%2012.9232%2012.0477%2013.5614V15.8195H14.9564C16.6582%2014.2527%2017.64%2011.9455%2017.64%209.20455V9.20455Z'%20fill='%234285F4'/%3e%3cpath%20fill-rule='evenodd'%20clip-rule='evenodd'%20d='M9%2018C11.43%2018%2013.4673%2017.1941%2014.9564%2015.8195L12.0477%2013.5614C11.2418%2014.1014%2010.2109%2014.4205%209%2014.4205C6.65591%2014.4205%204.67182%2012.8373%203.96409%2010.71H0.957275V13.0418C2.43818%2015.9832%205.48182%2018%209%2018V18Z'%20fill='%2334A853'/%3e%3cpath%20fill-rule='evenodd'%20clip-rule='evenodd'%20d='M3.96409%2010.71C3.78409%2010.17%203.68182%209.59318%203.68182%209C3.68182%208.40682%203.78409%207.83%203.96409%207.29V4.95818H0.957273C0.347727%206.17318%200%207.54773%200%209C0%2010.4523%200.347727%2011.8268%200.957273%2013.0418L3.96409%2010.71V10.71Z'%20fill='%23FBBC05'/%3e%3cpath%20fill-rule='evenodd'%20clip-rule='evenodd'%20d='M9%203.57955C10.3214%203.57955%2011.5077%204.03364%2012.4405%204.92545L15.0218%202.34409C13.4632%200.891818%2011.4259%200%209%200C5.48182%200%202.43818%202.01682%200.957275%204.95818L3.96409%207.29C4.67182%205.16273%206.65591%203.57955%209%203.57955V3.57955Z'%20fill='%23EA4335'/%3e%3c/g%3e%3cdefs%3e%3cclipPath%20id='clip0_0_2849'%3e%3crect%20width='18'%20height='18'%20fill='white'/%3e%3c/clipPath%3e%3c/defs%3e%3c/svg%3e)
Make Beansprout your preferred source on Google
Add us on Google to see more of our insights in your search results
We share about ST Engineering, DFI Retail Group, and UOL in the latest Weekly Market Review.

What happened?
In this week's Weekly Market Review in partnership with Securities Investors Association Singapore (SIAS), we discuss key developments in the global equity market alongside ST Engineering, DFI Retail Group, and UOL.
Watch the video to learn more about what we are looking out for this week.
Weekly Market Review
1:43 - Macro Update
S&P 500 slightly down, while the STI reached a new all-time high above 4,650 points on the back of strong Singapore GDP data.
Singapore’s economy grew 5.7% YoY in 4Q 2025 versus 4Q 2024, coming in above market expectations and fueling continued optimism in the local market.
For 2025, GDP growth was 4.8%, exceeding the Ministry of Trade and Industry’s earlier upgraded forecast of around 4%.
Looking ahead, GDP growth in 2026 is projected to moderate to a range of 1–3%, representing a slowdown from 2025’s strong expansion.
In the first week of 2026, Singapore stocks performed well, led by REITs such as Mapletree Industrial Trust, Mapletree Logs. Trust, and Frasers Logs. & Comm. Trust (each up about 1.5%), while laggards included Wilmar (down 1.6%) and DFI Retail Group (down 0.8%).
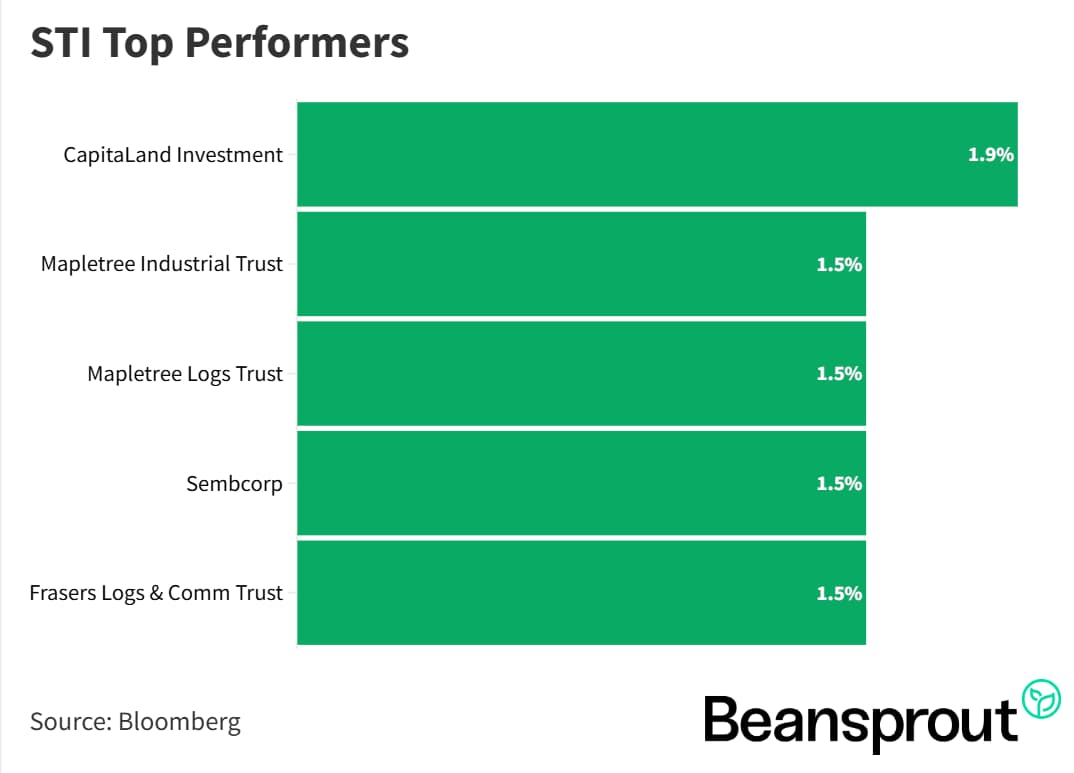
STI Top Performers:
- CapitaLand Investment
- Mapletree Industrial Trust
- Mapletree Logs Trust
- Sembcorp
- Frasers Logs & Comm Trust

STI Worst Performers:
ST Engineering (SGX: S63)
ST Engineering delivered the strongest STI performance in 2025, with shares rising from just above $4 to over $8 by year-end, powered by 9% revenue growth across the first 9 months of 2025.
The company outlined ambitious 5-year targets through 2029, aiming for group revenue growth exceeding 2.5 times global GDP growth from the 2024 base of $11.3 billion
Group net profit growth outpacing revenue by up to 5 percentage points, driven by expansion in defence, digital business, and premier engine maintenance/repair operations.
Dividend progression shows per-share payouts rising from $0.15 in 2021 to $0.17 in 2024, with a formal policy for 2025 setting an interim dividend of $0.04 and final of $0.06 per share.
Read also: Top 3 Singapore blue chip stocks in 2025. Is there more upside?
Related Links:
DFI Retail Group (SGX: D01)
DFI Retail Group achieved over 50% share price gains in 2025, underpinned by 20% YoY growth in underlying profit attributable to shareholders on a restated basis.
Key initiatives driving performance included portfolio simplification via divestments, alongside strategy reset to fuel own-brand growth and digital expansion, resulting in a strengthened balance sheet shifting to a net cash position by 2025 year end.
Operating metrics improved markedly, with operating margin rising from 2.3% in 2022 to 4% in 1H 2025, and underlying net profit jumping from $29 million in 2022 to an expected $250–270 million in 2025.
Related Links:
UOL (SGX: U14)
UOL posted strong profit growth in the first half of 2025, with profit after tax and minority interest surging 58% year-on-year to $205.5 million.
Key portfolio reconstitution moves encompassed the proposed sale of Kenex mall in Singapore and the sale of Park Royal on Kitchener Road in Singapore back in October 2023, alongside benefits from a pickup in private residential sales volumes in Singapore.
Enhanced property market sentiment stemmed from falling interest rates, notably the decline in the Singapore overnight average rate (SORA).
Related Links:
Technical Analysis
Straits Times Index (STI)
The STI continued its strong start to 2026, with momentum carrying into 5 January where the index gained about 0.5% (22 points) to around 4,678.
The MACD still shows a slightly positive reading, implying some remaining upside headroom, while the RSI is around 74, close to the 75-80 overbought region that has historically preceded technical pullbacks.
Using Bollinger Bands for guidance, the upper band is around 4,698 (rounded to 4,700), making 4,700 both a key technical resistance and a psychological level for the STI, beyond which a retracement is likely.
The 20-day moving average near 4,592 to 4,600 serves as the pivot zone, while the 50-day moving average around 4,533 is identified as the first major support;
The current trading range is framed by resistance near 4,700, pivot around 4,600, and support at 4,533 on the STI index.
Learn more about the Straits Times Index (STI) here.
Dow Jones Industrial Average
The Dow Jones Industrial Average rebounded 0.66% (319 points) last Friday, bouncing off its 28-day moving average ahead of earnings season starting 13 January.
Support is eyed at the 50-day moving average aligning with the lower Bollinger Band around 47,564-47,576, providing a solid confluence zone, while the pivot sits at the 20-day moving average of 48,217.
Indicators are mixed and directionally neutral: MACD shows a slight negative reading but lacks downward momentum as both lines trend sideways without aggressive divergence; RSI is neutral at 56.
S&P 500
The S&P 500 hit an all-time high of 6,945 on 26 December post-Christmas, but followed by a pullback that left the index sitting on its 20-day moving average at 6,856 last Friday.
Key resistance levels cluster around the prior high of 6,945, the upper Bollinger Band at 6,959, and a psychological 7,000 handle.
Support is pegged at the more volatile index's 100-day moving average near 6,691, aligning with the lower Bollinger Band around 6,753 for a 6,700 zone, while top analyst targets for 2026 reach up to 7,700 from the current level of 6,858.
Technical indicators are neutral and non-concerning: MACD shows a mild negative reading without a prominent downward bar; RSI hovers around the 50 neutral mark.
Nasdaq Composite Index
The NASDAQ Composite failed to close green last Friday, now positioned near closely converged 20-day and 50-day moving averages around 23,252 to 23,369 as the key pivot level.
Reliable support lies at the 100-day moving average of 22,712, historically effective for the index, with the upper Bollinger Band slightly lower at 23,870.
Indicators remain neutral: MACD shows a mild negative reading without major concern or bearish sentiment; RSI sits at 48, just below the 50 neutral mark.
Such sensitivity in high-beta names presents potential opportunities: If news resolves positively, it could enable market recovery and portfolio building for 2026, aligning with recent weeks' observations.
What to look out for this week
Friday, 9 January 2026: US non-farm payroll data
Get the full list of stocks with upcoming dividends here.
Follow us on Telegram, Youtube, Facebook and Instagram to get the latest financial insights.
Read also
Gain financial insights in minutes
Subscribe to our free weekly newsletter for more insights to grow your wealth
Most Popular

Comments
0 comments