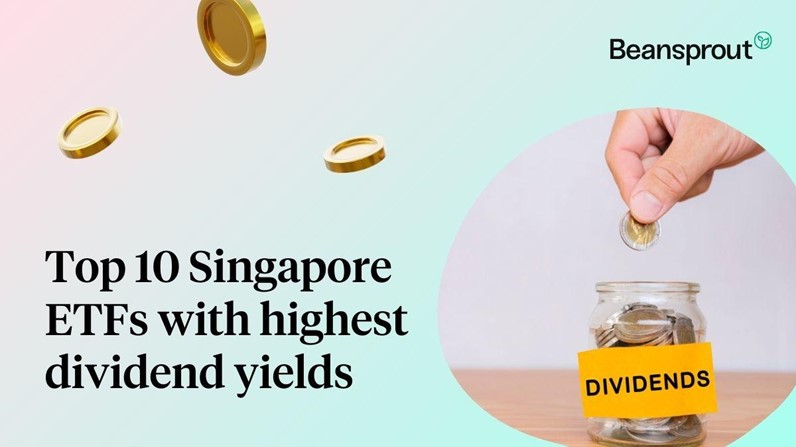
Top 10 Singapore ETFs with highest dividend yields. Which one should you consider?
ETFs
Powered by
By Gerald Wong, CFA • 09 Feb 2026
Why trust Beansprout? We’ve been awarded Best Investment Website at the SIAS Investors’ Choice Awards 2025
'%3e%3cpath%20fill-rule='evenodd'%20clip-rule='evenodd'%20d='M17.64%209.20455C17.64%208.56637%2017.5827%207.95273%2017.4764%207.36364H9V10.845H13.8436C13.635%2011.97%2013.0009%2012.9232%2012.0477%2013.5614V15.8195H14.9564C16.6582%2014.2527%2017.64%2011.9455%2017.64%209.20455V9.20455Z'%20fill='%234285F4'/%3e%3cpath%20fill-rule='evenodd'%20clip-rule='evenodd'%20d='M9%2018C11.43%2018%2013.4673%2017.1941%2014.9564%2015.8195L12.0477%2013.5614C11.2418%2014.1014%2010.2109%2014.4205%209%2014.4205C6.65591%2014.4205%204.67182%2012.8373%203.96409%2010.71H0.957275V13.0418C2.43818%2015.9832%205.48182%2018%209%2018V18Z'%20fill='%2334A853'/%3e%3cpath%20fill-rule='evenodd'%20clip-rule='evenodd'%20d='M3.96409%2010.71C3.78409%2010.17%203.68182%209.59318%203.68182%209C3.68182%208.40682%203.78409%207.83%203.96409%207.29V4.95818H0.957273C0.347727%206.17318%200%207.54773%200%209C0%2010.4523%200.347727%2011.8268%200.957273%2013.0418L3.96409%2010.71V10.71Z'%20fill='%23FBBC05'/%3e%3cpath%20fill-rule='evenodd'%20clip-rule='evenodd'%20d='M9%203.57955C10.3214%203.57955%2011.5077%204.03364%2012.4405%204.92545L15.0218%202.34409C13.4632%200.891818%2011.4259%200%209%200C5.48182%200%202.43818%202.01682%200.957275%204.95818L3.96409%207.29C4.67182%205.16273%206.65591%203.57955%209%203.57955V3.57955Z'%20fill='%23EA4335'/%3e%3c/g%3e%3cdefs%3e%3cclipPath%20id='clip0_0_2849'%3e%3crect%20width='18'%20height='18'%20fill='white'/%3e%3c/clipPath%3e%3c/defs%3e%3c/svg%3e)
Make Beansprout your preferred source on Google
Add us on Google to see more of our insights in your search results
Learn how to build a dividend ETF portfolio for steady passive income using the top 10 Dividend Paying SGX-listed ETFs in 2025 across equities, bonds, and REITs.
This post was created in partnership with SGX. All views and opinions expressed in this article are Beansprout's objective and professional opinions.
What happened?
If you are building a portfolio for regular income, you do not necessarily need to rely on picking individual dividend stocks.
In fact, many investors simply want a steadier stream of cash flow, while keeping things simple and diversified, without needing to constantly monitor company announcements or worry about whether one stock might cut its dividend.
This is where dividend exchange-traded funds, or dividend ETFs, can be a useful option.
Dividend ETFs bundle a basket of income-paying stocks into a single investment.
This helps investors diversify their income sources across multiple companies, sectors, and in some cases, even markets, while still staying focused on the goal of generating regular distributions.
In this article, we highlight 10 dividend-paying ETFs listed on the Singapore Exchange (SGX) that investors can consider, and break down what each fund offers, how they differ, and how they may fit into an income-focused portfolio.
What are dividend ETFs, and why consider them?
#1 – Income generation
Dividend ETFs invest in a basket of dividend-paying companies or income-generating assets such as equities, bonds and REITs.
The income collected from these underlying holdings is distributed to investors, usually quarterly or semi-annually.
This makes dividend ETFs helpful for retirement planning, SRS accounts, or anyone looking for dependable cash flow.
#2 – Diversification
Dividend ETFs also offer diversification.
By investing in dividend ETFs, you spread your income across many businesses and sectors, rather than relying on a single company's dividend.
#3 – Low cost
Dividend ETFs also tend to have lower fees than actively managed funds, which helps preserve long-term returns.
That said, dividend yields are not fixed and may change over time due to company performance and broader market conditions.
Some ETFs may also focus heavily on one sector, such as financials or REITs, which adds concentration risk. For overseas ETFs, currency movements may affect your returns too.
These factors are important to consider when building an income-focused portfolio.
The top 10 dividend-paying ETFs on the SGX at a glance
We grouped the top 10 dividend ETFs into three categories: Equities, Bonds, and REITs.
The list is based on dividend indicated yields as of 31 December 2025, covering multiple asset classes.
Top Dividend Paying ETFs in 2025 (as of 31 December 2025)
| No. | Name | Underlying Index / Benchmark | SGD Code | USD Code | Dividend Yield % | Assets Under Management (AUM) $ |
| 1 | iShares USD Asia High Yield Bond Index ETF | Bloomberg Barclays Asia USD High Yield Diversified Credit | QL3 | O9P | 7.31 | US$734.0M |
| 2 | Lion-OCBC Securities APAC Financials Dividend Plus ETF | iEdge APAC Financials Dividend Plus Index | YLD | YLU | 6.05 | S$99.5M |
| 3 | Lion-OCBC Securities Singapore Low Carbon Index ETF | iEdge-OCBC Singapore Low Carbon Select 40 Capped Index | ESG | ESU | 5.84 | S$109.4M |
| 4 | CSOP iEdge SREIT Leaders Index ETF | iEdge S-REIT Leaders Index | SRT | SRU | 5.56 | S$132.3M |
| 5 | Lion-Phillip S-REIT ETF | Morningstar Singapore REIT Yield Focus Index | CLR | - | 5.49 | S$838.0M |
| 6 | Amova-StraitsTrading Asia ex Japan REIT ETF | FTSE EPRA Nareit Asia ex Japan REITS 10% Capped Index | CFA | COI | 5.36 | S$679.9M |
| 7 | iShares J.P. Morgan USD Asia Credit Bond Index ETF | J.P. Morgan Asia Credit Index – Core | QL2 | N6M | 4.63 | US$44.0M |
| 8 | Phillip SGX APAC Dividend Leaders REIT ETF | iEdge APAC Ex-Japan Dividend Leaders REIT Index | BYJ | BYI | 4.23 | US$7.8M |
| 9 | UOB APAC Green REIT ETF | iEdge-UOB APAC Yield Focus Green REIT Index | GRN | GRE | 3.88 | S$29.4M |
| 10 | SPDR Straits Times Index ETF | Straits Times Index | ES3 | - | 3.81 | S$2.6B |
| Source: SGX ETF Market Highlights Q4 2025 and respective fund factsheet. All figures as of 31 December 2025. | ||||||
To help you compare these ETFs more easily, we break down each fund in greater detail in the sections below, organised by asset class across equities, bonds, and REITs.
We highlight what each ETF invests in, how often it pays dividends, and its current dividend yield.
We also include the total expense ratio (TER), which is the annual management fee charged by the ETF provider.
Equity ETFs
Equity ETFs are often the foundation of an income portfolio, offering a balance between regular payouts and long-term capital growth.
Unlike bonds or REITs, these funds allow us to participate in the earnings potential of established companies while benefiting from a diversified stream of dividends.
Below, we look at the top equity ETFs options on the SGX that combine regional growth with consistent yield.
#1 – SPDR Straits Times Index ETF (ES3)
The SPDR STI ETF tracks the Straits Times Index, which is Singapore's benchmark of 30 blue-chip companies.
These include the major banks, telcos, real estate companies, and industrial firms in Singapore.
It offers broad exposure to Singapore's economy and has been a popular option for long-term investors.
Dividends are typically distributed semi-annually.
| Dividend yield | 3.81% |
| Frequency of distribution | Semi-annually |
| Expense ratio | 0.28% |
| Geographical exposure | Singapore |
| Performance (1 year, 3 year annualised) | 1Y: 28.1% | 3Y: 17.6% |
| Source: SGX ETF Market Highlights Q4 2025 and respective fund factsheet. All figures as of 31 December 2025. | |
#2 – Lion-OCBC Securities APAC Financials Dividend Plus ETF (YLD / YLU)
This ETF invests in the 30 largest and most tradable financial institutions across the Asia-Pacific region that pay regular dividends.
It screens for profitability and consistent dividend records among banks and insurers.
It had one of the higher dividend indicated yields among equity ETFs in 2025 at about 6.05% as of 31 December 2025.
Dividends are generally paid quarterly.
| Dividend yield | 6.05% |
| Frequency of distribution | Quarterly |
| Expense ratio | 0.50% |
| Geographical exposure | Asia-Pacific (Australia, Hong Kong, Japan, Singapore, Korea, Indonesia, Malaysia and Thailand) |
| Performance (1 year) | 1Y: 26.9% |
| Source: SGX ETF Market Highlights Q4 2025 and respective fund factsheet. All figures as of 31 December 2025. | |
#3 – Lion-OCBC Securities Singapore Low Carbon ETF (ESG / ESU)
This ETF tracks Singapore companies with lower carbon intensity and stronger ESG characteristics.
It invests across sectors, including banks, tech-enabled firms, and REIT-adjacent names.
It also appeared on the top dividend table with a dividend indicated yield of 5.84% as of 31 December 2025.
Dividends are distributed semi-annually.
| Dividend yield | 5.84% |
| Frequency of distribution | Semi-annually |
| Expense ratio | 0.45% |
| Geographical exposure | Singapore |
| Performance (1 year, 3 year annualised) | 1Y: 26.7% | 3Y: 19.7% |
| Source: SGX ETF Market Highlights Q4 2025 and respective fund factsheet. All figures as of 31 December 2025. | |
Bond ETFs
Bond ETFs provide exposure to corporate credit and sovereign debt across Asia.
They often offer higher yields than equities, but credit quality and currency exposure matter.
#4 – iShares USD Asia High Yield Bond ETF (QL3 / O9P)
This ETF invests in high-yield corporate bonds across Asia (excluding Japan) denominated in US dollars.
It had the highest dividend indicated yield in the 2025 list at 7.31%
Distributions are made quarterly, and investors should be aware of credit and currency risks.
| Dividend yield | 7.31% |
| Frequency of distribution | Quarterly |
| Expense ratio | 0.50% |
| Duration | 2.65 years |
| Yield to Maturity (YTM) | 7.31% |
| Geographical exposure | Asia |
| Performance (1 year, 3 year annualised) | 1Y: 2.6% | 3Y: 7.90% |
| Source: SGX ETF Market Highlights Q4 2025 and respective fund factsheet. All figures as of 31 December 2025. | |
#5 – iShares J.P. Morgan USD Asia Credit Bond ETF (QL2 / N6M)
This ETF focuses on investment-grade (safer) and high-yield (riskier) US$corporate bonds in Asia, excluding Japan.
It offers diversified exposure across industries and countries, with an indicated yield of 4.6% as of 31 December 2025.
Distributions are paid quarterly, and investors should be aware of currency and interest rate risks.
| Dividend yield | 4.63% |
| Frequency of distribution | Quarterly |
| Expense ratio | 0.20% |
| Duration | 4.87 years |
| Yield to Maturity (YTM) | 5.10% |
| Geographical exposure | Asia ex-Japan |
| Performance (1 year, 3 year annualised) | 1Y: 2.5% | 3Y: 6.5% |
| Source: SGX ETF Market Highlights Q4 2025 and respective fund factsheet. All figures as of 31 December 2025. | |
REIT ETFs
REIT ETFs invest in real estate investment trusts, which own property such as malls, offices, industrial parks, data centres, and logistics warehouses.
REITs are known for passing rental income to investors as dividends.
#6 – CSOP iEdge S-REIT Leaders ETF (SRT / SRU)
This ETF invests in Singapore's largest and most liquid REITs.
It provides broad exposure to retail, industrial, commercial, and logistics properties.
It had a dividend indicated yield of 5.56% as of 31 December 2025.
Dividends are usually distributed semi-annually.
| Dividend yield | 5.56% |
| Frequency of distribution | Semi-annually |
| Expense ratio | 0.60% |
| Geographical exposure | Singapore |
| Sector exposure | Real Estate (99.64%) |
| Performance (1 year, 3 year annualised) | 1Y: 14.4% | 3Y: 3.7% |
| Source: SGX ETF Market Highlights Q4 2025 and respective fund factsheet. All figures as of 31 December 2025. | |
#7 – Lion-Phillip S-REIT ETF (CLR)
This ETF tracks the Morningstar Singapore REIT Yield Focus Index.
It focuses on Singapore-listed REITs with yield and liquidity characteristics.
It showed an indicated yield of 5.49% as of 31 December 2025.
Dividends are distributed semi-annually.
| Dividend yield | 5.49% |
| Frequency of distribution | Semi-annually |
| Expense ratio | 0.60% |
| Geographical exposure | Singapore |
| Sector exposure | Industrial (40.17%), Retail (18.05%), Office (17.62%), Specialised (8.66%), Diversified (7.59%), Hotel & Resort (4.32%), Health Care (2.55%) |
| Performance (1 year, 3 year annualised) | 1Y: 15.6% | 3Y: 4.7% |
| Source: SGX ETF Market Highlights Q4 2025 and respective fund factsheet. All figures as of 31 December 2025. | |
#8 – Amova-Straits Trading Asia ex Japan REIT ETF (CFA / COI)
This ETF includes REITs across Asia excluding Japan.
It invests heavily in Singapore, with additional exposure to Hong Kong and Australia.
It had a dividend indicated yield of 5.36% as of 31 December 2025.
Dividends are generally paid quarterly, making it more frequent than most REIT ETFs.
| Dividend yield | 5.36% |
| Frequency of distribution | Quarterly |
| Expense ratio | 0.55% |
| Geographical exposure | Asia ex-Japan (China, Hong Kong (11.8%), India (7.8%), Indonesia, Malaysia (5.7%), Pakistan, Philippines (2.5%), Singapore (67%), South Korea (3.5%), Taiwan and Thailand) |
| Sector exposure | Industrial REITs (26.6%), Retail REITs (23.2%), Diversified REITs (22.0%), Office REITs (15.5%), Data Centre REITs (5.8%), Hotel & Resort REITs (4.2%), Others (2.4%) |
| Performance (1 year, 3 year annualised) | 1Y: 14.6% | 3Y: 2.6% |
| Source: SGX ETF Market Highlights Q4 2025 and respective fund factsheet. All figures as of 31 December 2025. | |
#9 – Phillip SGX APAC Dividend Leaders REIT ETF (BYJ / BYI)
This ETF tracks high-dividend REITs across the Asia-Pacific region excluding Japan.
It includes property segments such as offices, retail, and industrial.
It showed a 4.2% indicated yield as of 31 December 2025.
Dividends are paid semi-annually.
| Dividend yield | 4.23% |
| Frequency of distribution | Semi-annually |
| Expense ratio | 0.95% |
| Geographical exposure | 30 REITs in Asia-Pacific ex-Japan (Singapore (40.60%), Australia (47.87%), Hong Kong (10.79%), others) |
| Sector exposure | Diversified (34.28%), Retail (39.02%), Industrial (12.16%), Office (8.78%), Others (5.76%) |
| Performance (1 year, 3 year annualised) | 1Y: 16.1% | 3Y: 4.90% |
| Source: SGX ETF Market Highlights Q4 2025 and respective fund factsheet. All figures as of 31 December 2025. | |
#10 – UOB APAC Green REIT ETF (GRN / GRS)
This ETF invests in REITs with relatively better environmental performance based on green criteria. It covers multiple markets in Asia-Pacific.
It is the top returning ETF among all REIT ETFs in 2025.
Its indicated dividend yield was 3.88% as of 31 December 2025.
Dividends are paid semi-annually.
| Dividend yield | 3.88% |
| Frequency of distribution | Semi-annually |
| Expense ratio | 0.82% |
| Geographical exposure | 50 REITs in Asia-Pacific (Australia (38.51%), Japan (30.41%), Singapore (21.51%), Hong Kong (5.52%), India (2.39%)) |
| Sector exposure | Diversified REITs (35.71%), Retail REITS (26.60%), Industrial REITs (15.25%), Office REITS (14.61%), Hotel & Resort REITs (3.81%), Self-Storage REITs (1.09%), Real Estate Operating Companies (1.05%), Multi-Family Residential REITs (0.22%) |
| Performance (1 year, 3 year annualised) | 1Y: 19.6% | 3Y: 3.1% |
| Source: SGX ETF Market Highlights Q4 2025 and respective fund factsheet. All figures as of 31 December 2025. | |
How the top 10 dividend-paying Singapore ETFs compare
Here’s a summary table of the 10 ETFs that includes type (equity / bond / REIT), dividend yield, payout frequency, expense ratio, and performance.
| No. | Name | Type Of ETF | Dividend Yield % | Payout Frequency | Expense Ratio % | Performance | |
| 1Y % | 3Y % | ||||||
| 1 | iShares USD Asia High Yield Bond Index ETF | Bond | 7.31 | Quarterly | 0.5 | 2.6 | 7.9 |
| 2 | Lion-OCBC Securities APAC Financials Dividend Plus ETF | Equity | 6.05 | Quarterly | 0.5 | 26.9 | N/A |
| 3 | Lion-OCBC Securities Singapore Low Carbon Index ETF | Equity | 5.84 | Semi-annually | 0.45 | 26.7 | 19.7 |
| 4 | CSOP iEdge SREIT Leaders Index ETF | REIT | 5.56 | Semi-annually | 0.6 | 14.04 | 3.7 |
| 5 | Lion-Phillip S-REIT ETF | REIT | 5.49 | Semi-annually | 0.6 | 15.6 | 4.7 |
| 6 | Amova-StraitsTrading Asia ex Japan REIT ETF | REIT | 5.36 | Quarterly | 0.55 | 14.6 | 2.6 |
| 7 | iShares J.P. Morgan USD Asia Credit Bond Index ETF | Bond | 4.63 | Quarterly | 0.2 | 2.5 | 6.5 |
| 8 | Phillip SGX APAC Dividend Leaders REIT ETF | REIT | 4.23 | Semi-annually | 0.95 | 16.1 | 4.9 |
| 9 | UOB APAC Green REIT ETF | REIT | 3.88 | Semi-annually | 0.82 | 19.6 | 3.1 |
| 10 | SPDR Straits Times Index ETF | Equity | 3.81 | Semi-annually | 0.28 | 28.1 | 17.6 |
| Source: SGX ETF Market Highlights Q4 2025 and respective fund factsheet. All figures as of 31 December 2025. | |||||||
What to consider when choosing dividend ETFs
There isn't a single "best" dividend ETF. What matters more is whether the ETF fits your needs.
Here are four key things to consider:
#1 – Dividend yield vs. sustainability
Higher yields can look attractive, but they often come with higher credit or sector risk.
Lower yields may be more stable over time, especially for broader market ETFs.
#2 – Dividend frequency
Some investors like quarterly payouts. Others are fine with semi-annual distributions.
Choose based on your cash flow needs.
#3 – Sector concentration
REIT ETFs concentrate on property.
Financial ETFs concentrate in banks and insurers.
Single-sector exposure is not necessarily bad, but it affects performance in different interest rate environments.
#4 – Total expense ratio (TER)
TER affects returns over time.
Bond and REIT ETFs can have higher TERs than equity ETFs due to underlying instruments.
#5 – Currency class risk
Some ETFs offer both SGD and USD classes.
USD classes introduce currency risk.
SGD classes may be preferred for expenses in Singapore.
How to build a dividend ETF portfolio
Dividends can also play multiple roles in a portfolio.
Some investors use them to supplement retirement income.
Others reinvest dividends to compound returns over time.
We've also seen income-focused portfolios blend REIT ETFs with bond ETFs to smooth volatility.
It's also possible to mix growth ETFs with dividend ETFs for a balanced approach.
Ultimately, your mix depends on how much income you need today versus growth you want in the future.
Key risks to keep in mind
Dividend ETFs are not risk-free.
Yields are not guaranteed and may change when companies cut dividends or when credit markets weaken.
Sector concentration can create volatility, especially for REITs in a rising interest rate environment.
Bond ETFs carry credit and currency risks, especially when denominated in USD.
Costs such as TER and brokerage fees also reduce net returns.
Know what you are buying, and understand how it fits your portfolio.
What would Beansprout do?
Dividend ETFs can be a simple and effective way to generate income, while staying diversified.
But rather than chasing the highest headline yield, we prefer starting with the goal, and building a mix of ETFs that can deliver more consistent payouts across different market conditions.
To build a more balanced income strategy, we typically look across three main dividend ETF categories on SGX.
First, REIT ETFs provide exposure to property rental income and potentially higher distribution yields.
Second, bond ETFs offer a steadier stream of interest income, especially for investors who prefer lower volatility.
Third, equity dividend ETFs for a blend of dividends and long term growth, backed by established blue-chip companies.
Our focus is on sustainability over time. That means paying attention to the underlying portfolio quality, dividend resilience through market cycles, and risks like currency exposure.
By combining different asset classes, investors can potentially smooth out portfolio volatility while building an income stream they can stick with for the long term.
Of the 10 ETFs highlighted, the iShares USD Asia High Yield Bond Index ETF (QL3) stands out with the highest indicated dividend yield of 7.31%.
For investors prioritizing cost efficiency, the iShares J.P. Morgan USD Asia Credit Bond Index ETF (QL2) offers the lowest Total Expense Ratio (TER) at 0.20%.
Those seeking a "Singapore pure play" can look to the SPDR Straits Times Index ETF for broad market exposure, alongside the CSOP iEdge SREIT Leaders Index ETF and Lion-Phillip S-REIT ETF for dedicated REIT pure play exposure.
If you prefer more frequent payouts, you may consider ETFs that offer quarterly dividend distributions.
Among the 10 ETFs mentioned, four provide quarterly payouts: the iShares USD Asia High Yield Bond Index ETF, the Lion-OCBC Securities APAC Financials Dividend Plus ETF, the Amova-StraitsTrading Asia ex Japan REIT ETF, and the iShares J.P. Morgan USD Asia Credit Bond Index ETF. The remaining six ETFs generally follow a semi-annual distribution schedule.
For investors planning for retirement or managing an SRS account, these 10 dividend ETFs offer a useful starting point for building a resilient income strategy without the need to pick individual stocks.
You can find out more about these ETFs on the SGX ETF screener page, or read our guide on how to choose the best ETF as a SRS investor.
Don’t have a brokerage account yet? Check out our guide to the best online brokers in Singapore to get started.
Here are other resources to help you learn more about ETFs:
- Guide to STI ETF
- Best Singapore REIT ETFs
- Best Singapore Bond ETFs
- Best S&P 500 ETFs for Singapore investors
- 7 SGX ETFs to gain exposure to China
- Best gold ETF in Singapore
- Top 10 ETFs bought by SRS investors in 2025
- 5 SGX ETFs to gain exposure to Asia’s fastest-growing sectors
Disclaimer
This advertisement has not been reviewed by the Monetary Authority of Singapore.
Any information provided in this article is meant purely for informational and investor education purposes and should not be relied upon as financial or investment advice, or advice on corporate finance.
This article is not and does not constitute or form part of any offer, recommendation, invitation or solicitation to purchase any financial product or subscribe or enter any transaction. This article also does not take into account your personal circumstances, e.g. investment objectives, financial situation or particular needs and shall not constitute financial advice. You should consult your own independent financial, accounting, tax, legal or other competent professional advisors.
The information provided in this article are on an “as is” and “as available” basis without warranty of any kind, whether express or implied. Beansprout does not recommend any particular course of action in relation to any investment product or class of investment products. No information is presented with the intention to induce any person to buy, sell, or hold a particular investment product or class of investment products.
Read also
Gain financial insights in minutes
Subscribe to our free weekly newsletter for more insights to grow your wealth
Most Popular

Comments
0 comments