OCBC reports 5% rise in net profit: Our Quick Take
Stocks
By Gerald Wong, CFA • 08 May 2026
Why trust Beansprout? We’ve been awarded Best Investment Website at the SIAS Investors’ Choice Awards 2025
'%3e%3cpath%20fill-rule='evenodd'%20clip-rule='evenodd'%20d='M17.64%209.20455C17.64%208.56637%2017.5827%207.95273%2017.4764%207.36364H9V10.845H13.8436C13.635%2011.97%2013.0009%2012.9232%2012.0477%2013.5614V15.8195H14.9564C16.6582%2014.2527%2017.64%2011.9455%2017.64%209.20455V9.20455Z'%20fill='%234285F4'/%3e%3cpath%20fill-rule='evenodd'%20clip-rule='evenodd'%20d='M9%2018C11.43%2018%2013.4673%2017.1941%2014.9564%2015.8195L12.0477%2013.5614C11.2418%2014.1014%2010.2109%2014.4205%209%2014.4205C6.65591%2014.4205%204.67182%2012.8373%203.96409%2010.71H0.957275V13.0418C2.43818%2015.9832%205.48182%2018%209%2018V18Z'%20fill='%2334A853'/%3e%3cpath%20fill-rule='evenodd'%20clip-rule='evenodd'%20d='M3.96409%2010.71C3.78409%2010.17%203.68182%209.59318%203.68182%209C3.68182%208.40682%203.78409%207.83%203.96409%207.29V4.95818H0.957273C0.347727%206.17318%200%207.54773%200%209C0%2010.4523%200.347727%2011.8268%200.957273%2013.0418L3.96409%2010.71V10.71Z'%20fill='%23FBBC05'/%3e%3cpath%20fill-rule='evenodd'%20clip-rule='evenodd'%20d='M9%203.57955C10.3214%203.57955%2011.5077%204.03364%2012.4405%204.92545L15.0218%202.34409C13.4632%200.891818%2011.4259%200%209%200C5.48182%200%202.43818%202.01682%200.957275%204.95818L3.96409%207.29C4.67182%205.16273%206.65591%203.57955%209%203.57955V3.57955Z'%20fill='%23EA4335'/%3e%3c/g%3e%3cdefs%3e%3cclipPath%20id='clip0_0_2849'%3e%3crect%20width='18'%20height='18'%20fill='white'/%3e%3c/clipPath%3e%3c/defs%3e%3c/svg%3e)
Make Beansprout your preferred source on Google
Add us on Google to see more of our insights in your search results
OCBC Group has reported net profit of S$1.97 billion for 1Q26, up 5% compared to the previous year.

OCBC 1Q26 earnings highlights
OCBC announced its earnings for the first quarter of 2026 (1Q26). Key highlights include:
- Net profit of S$1.97 billion in 1Q26, 5% higher year-on-year and 13% higher than the previous quarter, beating consensus expectations.
- Total income hit a new high of S$3.83 billion, with non-interest income reaching a record, comprising more than 40% of total income.
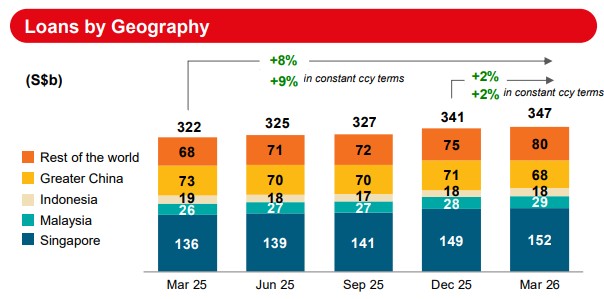
- Loans grew 9% year-on-year (in constant currency terms) to S$347 billion, supported by broad-based growth across industries and geographies.
- Asset quality remained sound with the non-performing loan (NPL) ratio steady at 0.9% for the eighth consecutive quarter. Total non-performing assets (NPAs) coverage rose to 163%.
- Annualised ROE of 13.0% and annualised EPS of S$1.76.
What you need to know about OCBC 1Q26 results
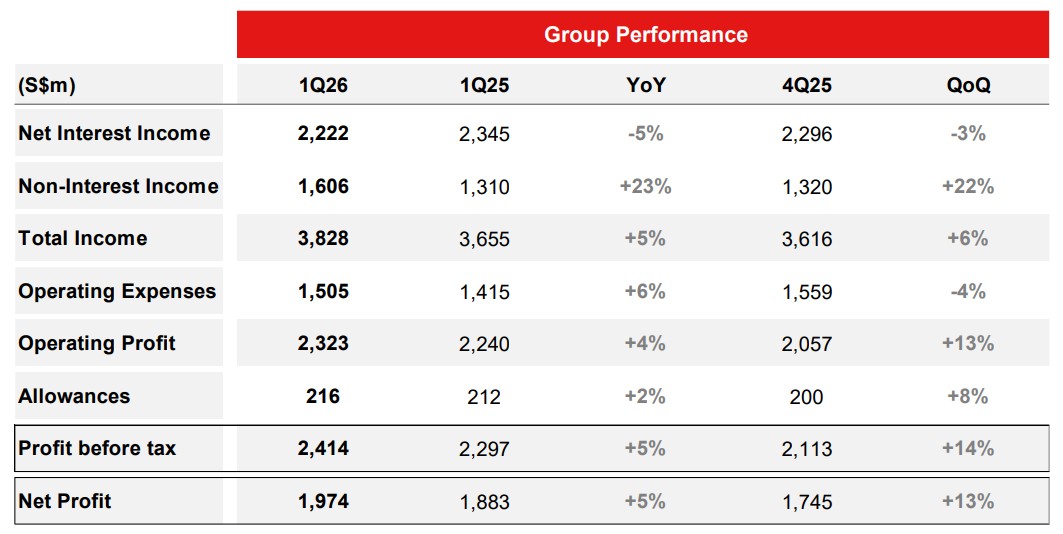
OCBC Group has reported net profit of S$1.97 billion for 1Q26. This represents a 5% increase compared to the previous year and a 13% increase compared to the previous quarter.
#1 - Total income rose 5% in 1Q26
OCBC's total income for the first quarter of 2026 rose to a new high of S$3.83 billion, marking a 5% increase from the same period last year and 6% higher than the previous quarter.
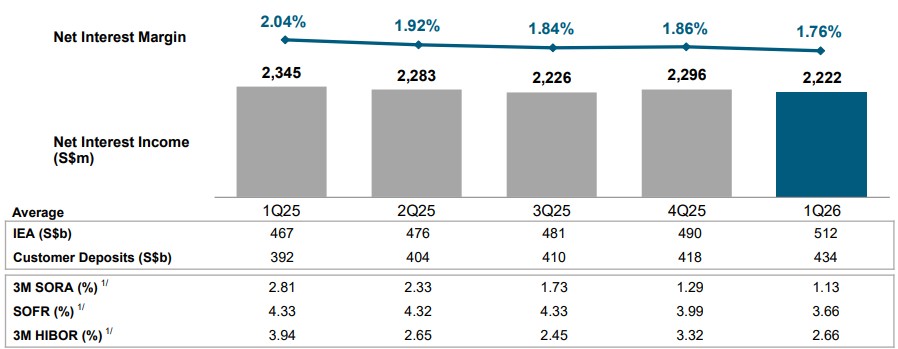
OCBC's net interest income for 1Q26 fell 5% year-on-year to S$2.22 billion, amid a lower interest rate environment. The drop in asset yields was partly mitigated by lower funding costs and a 10% growth in average assets.
OCBC's net interest margin (NIM) was 1.76% in 1Q26, 28 basis points (0.28%) lower than 1Q25 and 10 basis points (0.10%) lower than 4Q25. The quarter-on-quarter NIM compression reflected lower SGD, HKD and USD benchmark rates, loan yield compression, and a strategic increase in income-accretive high-quality assets.
#2 - Record non-interest income drove earnings
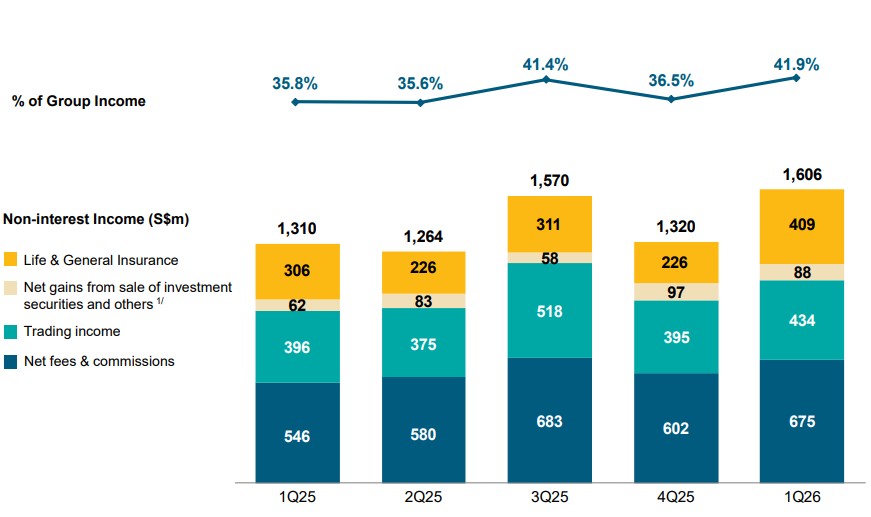
Non-interest income rose 23% year-on-year and 22% quarter-on-quarter to a record S$1.61 billion, with broad-based growth across fee, trading and insurance income. Non-interest income comprised more than 40% of total income.
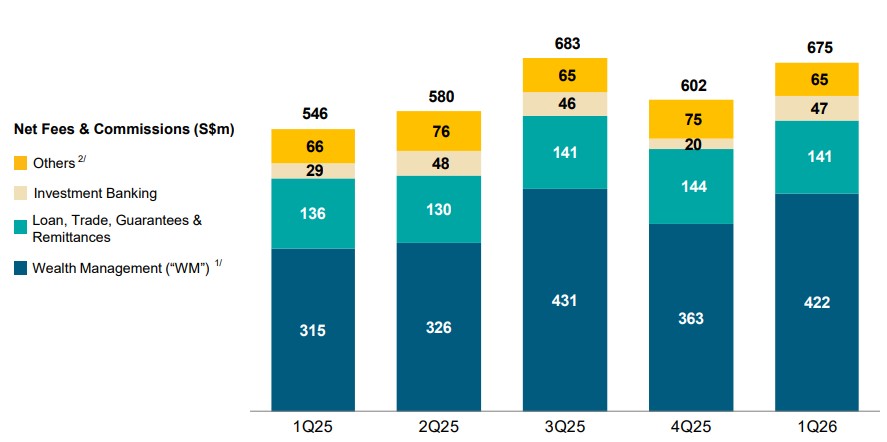
Net fee income grew 24% year-on-year to S$675 million, led by a 34% increase in wealth management fees, with growth across all wealth product channels. Investment banking, trade-related and loan-related fees were also higher.
Net trading income rose 10% to S$434 million, driven by record customer flow income, which grew 35% year-on-year on the back of sustained wealth-related activities and hedging demand from corporate customers.
Insurance income improved 34% year-on-year to S$409 million, supported by robust insurance performance and a release in reserves. Total weighted new sales (TWNS) and new business embedded value (NBEV) grew by 16% and 31% respectively, with NBEV margin rising from 43.1% in the previous year to 48.6%.
OCBC's wealth management fee income grew to S$422 million in 1Q26 from S$315 million in 1Q25, lifted by record contributions across all wealth product channels.
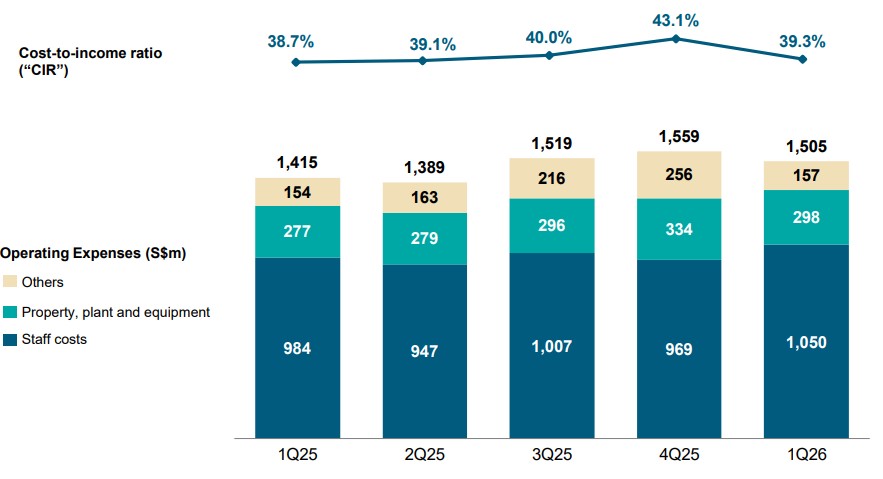
#3 - Cost-to-income ratio improved to 39.3%
OCBC maintained cost discipline, with operating expenses of S$1.50 billion, up 6% year-on-year mainly due to increased staff costs to support business growth and continued IT investments. The cost-to-income ratio (CIR) was 39.3%, slightly higher than 38.7% a year earlier but well below the 43.1% recorded in 4Q25.
On a quarter-on-quarter basis, operating expenses fell 4%, mainly attributable to higher technology expenditure incurred in the previous quarter.
Total allowances came in at S$216 million, up 2% year-on-year and 8% higher quarter-on-quarter. Credit costs were 23 basis points (0.23%) of loans on an annualised basis, compared with 24 basis points in 1Q25 and 20 basis points in 4Q25.
The allowances mostly comprised allowances for non-impaired assets of S$191 million, which included additional management overlays set aside to reflect heightened uncertainties in the operating environment. Allowances for impaired assets were significantly lower at S$25 million.
NPL ratio held steady at 0.9% for the eighth consecutive quarter, while total NPA coverage rose to 163% from 151% at end-2025.
#4 - Strong loan and deposit growth
Customer loans grew to S$347 billion as at 31 March 2026, up 9% year-on-year and 2% quarter-on-quarter on a constant currency basis. Loan growth was broad-based across industries, with the quarter-on-quarter growth led by Singapore, Malaysia and the Group's international markets.
OCBC's sustainable financing loan portfolio grew 17% from a year ago to S$59.7 billion, comprising 17% of Group loans.
Customer deposits rose 10% year-on-year to S$444 billion, largely driven by a 13% growth in CASA deposits. The CASA ratio improved to 50.2% from 48.9% a year ago.
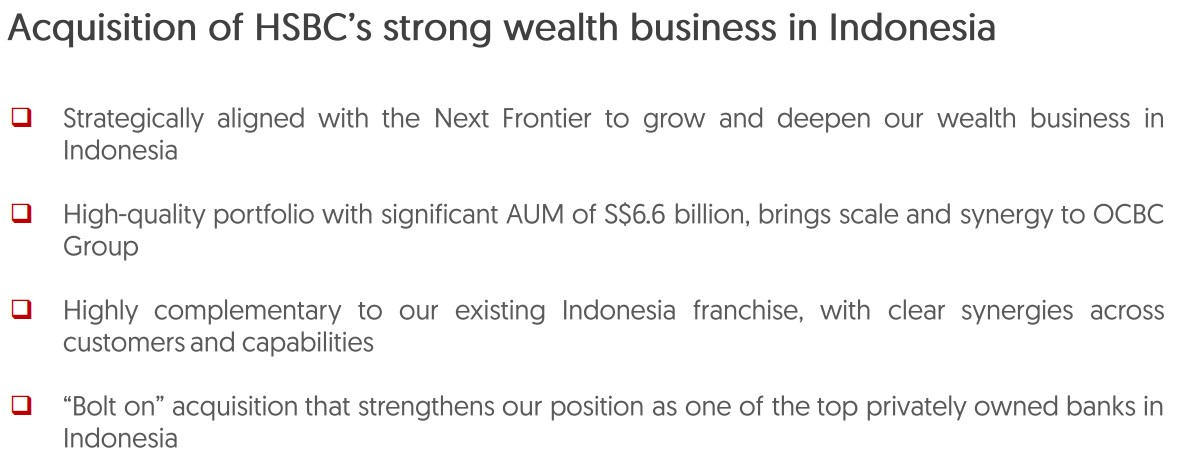
#5 - Acquisition of HSBC's wealth business in Indonesia
OCBC announced the acquisition of HSBC's wealth business in Indonesia, which fits into its Next Frontier strategy of building up its wealth business in Indonesia. According to the bank, the portfolio includes significant assets under management with sizeable CASA balances, and is highly complementary to its existing Indonesia franchise.
The acquisition is expected to have up to a 0.2 percentage point impact on fully phased-in CET1 CAR.
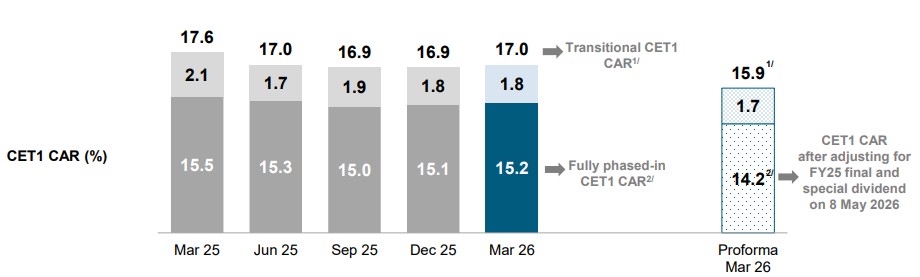
#6 - Strong capital position
OCBC's CET1 CAR stood at 17.0% on a transitional basis as at 31 March 2026, and 15.2% on a fully phased-in basis. After adjusting for the FY25 final and special dividend payment on 8 May 2026, fully phased-in CET1 CAR would be approximately 14.2%.
The bank's S$2.5 billion capital return plan remains on track to be completed by FY26.
Find out how much dividends you will potentially receive as a shareholder of OCBC with the calculator below. Note that this is based on latest average forecasts of analysts, which may not have included the special dividends announced.
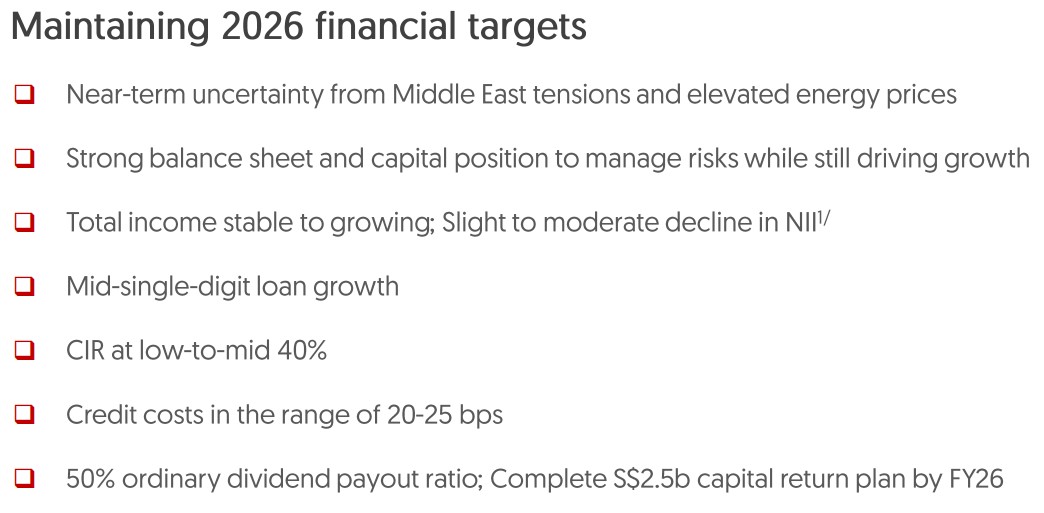
#7 - Outlook unchanged
Group CEO Tan Teck Long noted that global conditions remain uncertain amid geopolitical tensions and elevated inflation risks. The near-term outlook will depend on how the war in the Middle East evolves, with implications for energy supply and prices, while the ongoing trade tariff situation is also being closely monitored.
Despite these uncertainties, the bank highlighted that its strong capital, funding and liquidity position, diversified income streams and disciplined risk management leave it well positioned to navigate uncertainties and deliver sustainable long-term value.
Beansprout’s Quick Take on OCBC earnings
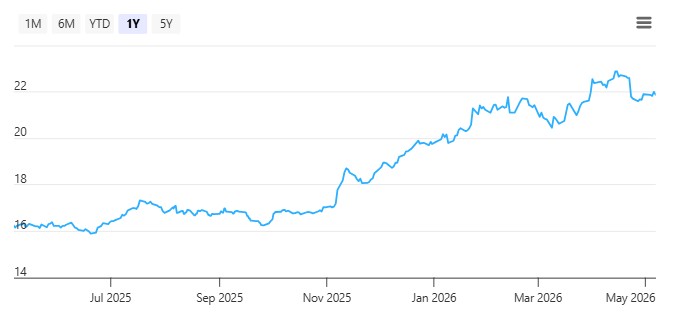
OCBC has seen the strongest share price performance year-to-date amongst the Singapore banks, with a gain of 13.7% versus UOB’s 6.7% and DBS’s 5.9%, as of 7 May 2026.
On the positive side, OCBC reported a strong set of 1Q26 results, with net profit rising 5% year-on-year and 13% quarter-on-quarter to S$1.97 billion. This was supported by record non-interest income, which grew 23% year-on-year across fees, trading and insurance income.
Wealth management remains a key growth driver. Wealth management fees rose 34% year-on-year, while banking wealth management AUM increased 12% year-on-year to S$342 billion. The acquisition of HSBC’s Indonesia wealth business should further strengthen this segment.
The key concern is still net interest margin pressure. NIM fell 28 basis points year-on-year and 10 basis points quarter-on-quarter to 1.76%.
Looking ahead, OCBC expects a stable-to-growing total income in 2026.
OCBC has also maintained guidance for a 50% ordinary dividend payout ratio in 2026, compared to its 60% total dividend payout ratio in 2025.
OCBC is currently trading at 1.64x price-to-book, above its historical average of about 1.14x.
| Bulls say | Bears say |
| 1Q26 net profit up 5% YoY and 13% QoQ to S$1.97b | NIM down 28bps YoY and 10bps QoQ to 1.76% |
| Record non-interest income, up 23% YoY | Net interest income declined 5% YoY |
| Wealth management fees grew 34% YoY | Credit costs at higher end of guided range at 23bps |
| Loans up 9% YoY in constant currency terms | Valuation above historical average |
| Stable-to-growing total income expected in 2026 | |
For income investors, OCBC is expected to offer a total dividend per share of S$0.968 in 2026, according to consensus forecast. This would represent a potential dividend yield of 4.4% based on its closing price of S$21.88 on 7 May.
This would be lower than the dividend yield for DBS (including capital return dividend) and comparable to UOB’s dividend yield.
Read also: 3 Singapore blue chip stocks near all time highs. Are their yields attractive?
Related links:
Check out Beansprout's guide to the best stock trading platforms in Singapore with the latest promotions to invest in OCBC.
Enjoyed this insight? Follow Beansprout on Telegram, Youtube, Facebook and Instagram, and add Beansprout as your preferred source on Google so you never miss an update.
Read also
Gain financial insights in minutes
Subscribe to our free weekly newsletter for more insights to grow your wealth
Most Popular

Comments
0 comments