
UOB 3Q26 profit below forecasts as net interest margin declines further: Our Quick Take
Stocks
By Gerald Wong, CFA • 04 Nov 2026
Global Wealth Technology Pte. Ltd. is regulated by the Monetary Authority of Singapore (MAS) as a licensed Financial Adviser.

Make Beansprout your preferred source on Google
Add us on Google to see more of our insights in your search results
UOB’s 3Q26 net profit of S$1.25 billion fell 15% QoQ and missed consensus, even as fee income hit a record high of S$733 million.
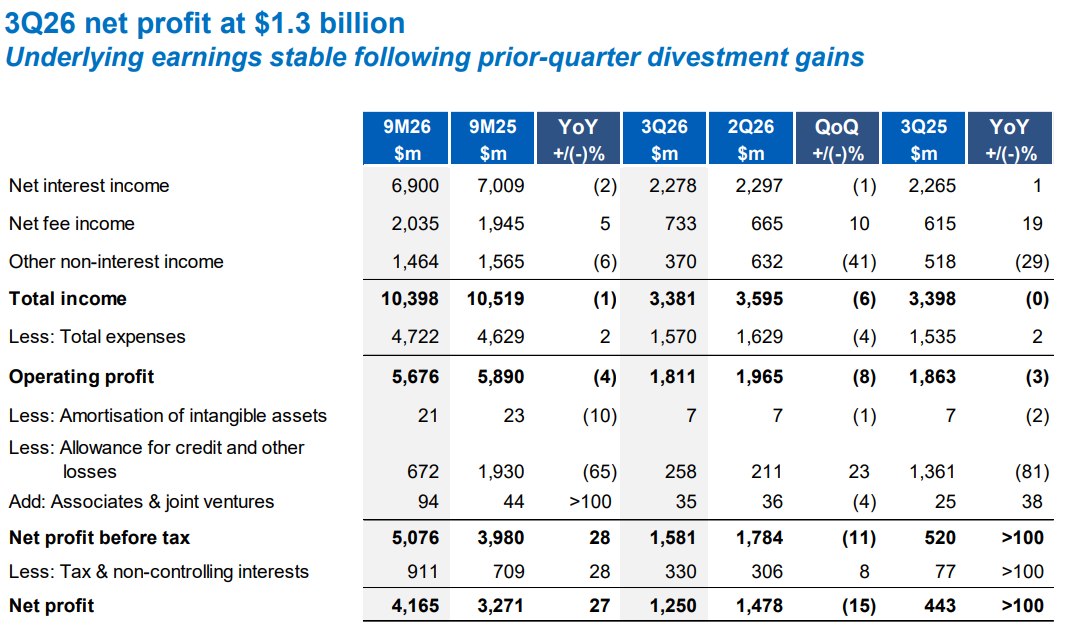
UOB Group announced its earnings for the third quarter of 2026. Key highlights include:
- Net profit of S$1.25 billion in 3Q26, down 15% quarter-on-quarter and missing the S$1.38 billion consensus forecast
- Net profit of S$4.17 billion in 9M26, up 27% year-on-year
- Net fee income reached a record S$733 million, up 19% year-on-year
What you need to know about UOB 3Q26 results
UOB Group has reported net profit of S$1.25 billion for 3Q26, missing the S$1.38 billion consensus forecast among six analysts polled by Bloomberg.
Compared to the previous quarter, net profit fell 15%, mainly due to the absence of asset divestment gains recognised in 2Q26.
On a year-on-year basis, net profit rose sharply from S$443 million in 3Q25, though the comparison is flattered by the heavy pre-emptive provisioning taken in 3Q25.
#1 - Net interest margin fell further on higher funding costs
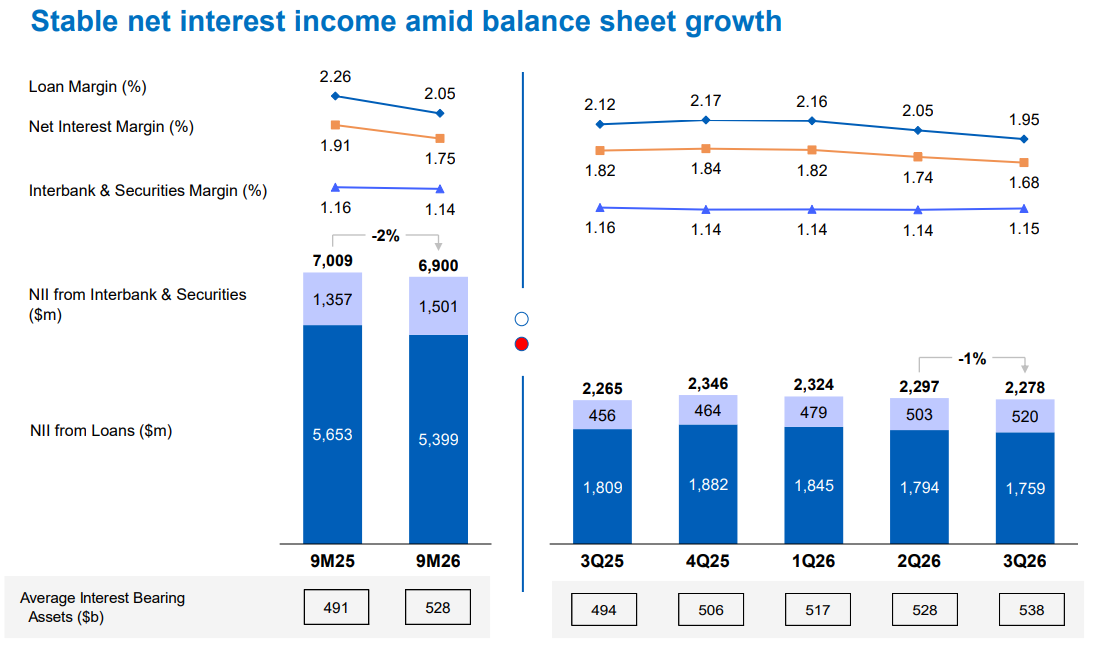
Net interest income was broadly stable at S$2.28 billion, down 1% quarter-on-quarter and up 1% year-on-year, as loan growth of 3% quarter-on-quarter helped offset margin compression.
Net interest margin narrowed by 6 basis points (0.06%) to 1.68% in 3Q26, from 1.74% in 2Q26, driven mainly by higher funding costs (-0.07%), partly offset by better volume and mix (+0.02%).
For the first nine months of 2026, NIM averaged 1.75%, right at the lower end of UOB’s full-year guidance range of 1.75%–1.80%.
Customer loans grew 6% year-on-year and 3% quarter-on-quarter to S$372 billion, supported by strong wholesale banking momentum, with trade loans up 31% year-on-year.
#2 - Record fee income driven by wealth, cards and loan-related activities
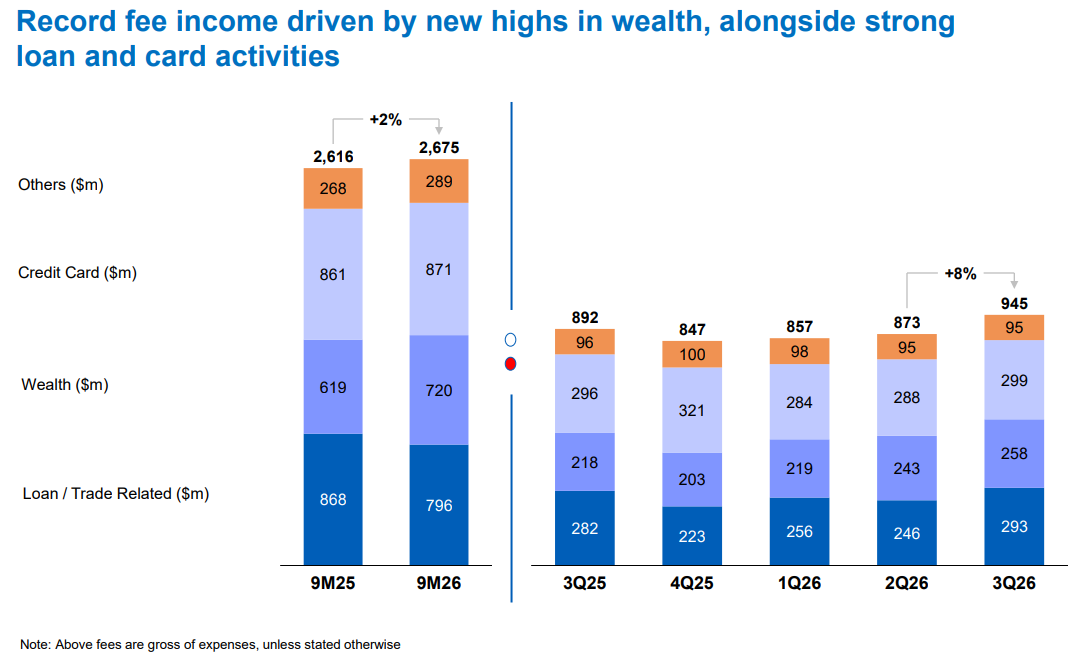
Net fee income reached a new high of S$733 million in 3Q26, up 10% quarter-on-quarter and 19% year-on-year, with broad-based contributions across wealth, credit cards, and loan-related activities.
For the first nine months of 2026, wealth income rose 13% year-on-year, while credit card income was up 25% year-on-year.
Customer-related treasury income also reached a new high, supported by strong demand for hedging solutions amid continued market volatility.
Other non-interest income fell 41% quarter-on-quarter to S$370 million, reflecting the absence of the non-recurring asset divestment gains recognised in 2Q26.
Trading and investment income moderated to S$322 million, amid less favourable market conditions.
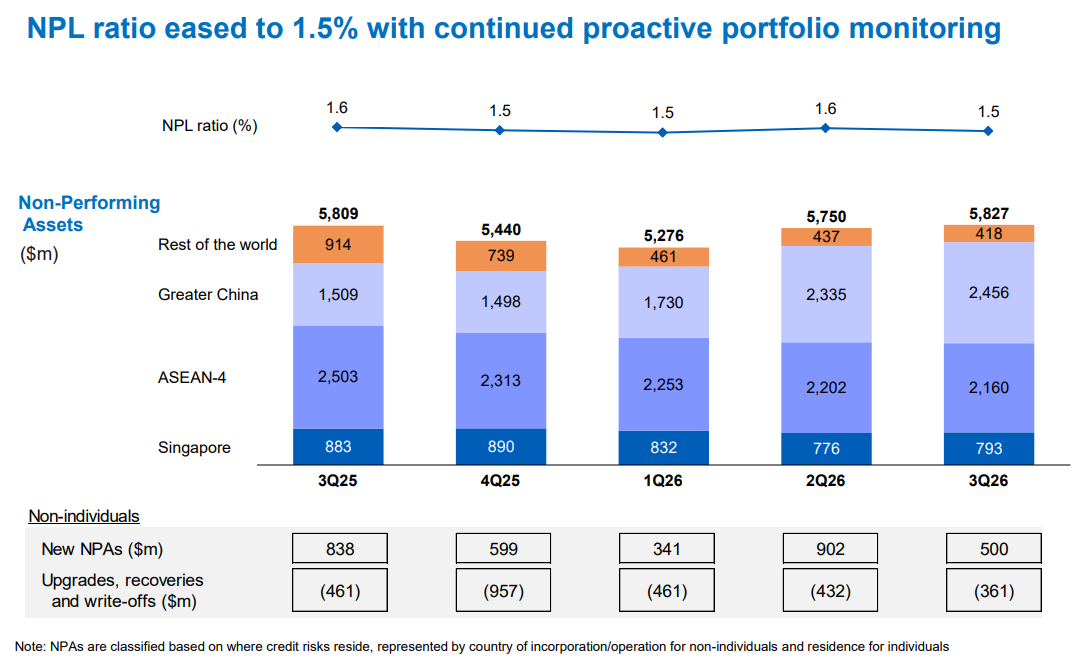
#3 - Non-performing loan ratio eased, but Greater China NPL ticked up further
Total allowance rose to S$258 million in 3Q26 (from S$211 million in 2Q26), reflecting additional general allowance provisioning, partly offset by lower specific allowance.
Total credit costs on loans came in at 24 basis points (0.24%), within UOB’s full-year guidance range of 25–30 basis points.
The non-performing loan (NPL) ratio eased to 1.5% from 1.6% in the prior quarter, with NPA coverage at 86% or 269% after taking collateral into account.
However, the Greater China NPL ratio continued to climb, rising to 5.0% from 4.8% in 2Q26.
Encouragingly, the Greater China real estate and hospitality NPL ratio was lower at 3.8%, suggesting the pressure is now concentrated in non-real estate exposures.
UOB’s US exposure remains well-contained, with NPL ratio of just 1.3%.
#4 - Capital position eased after interim dividend payout
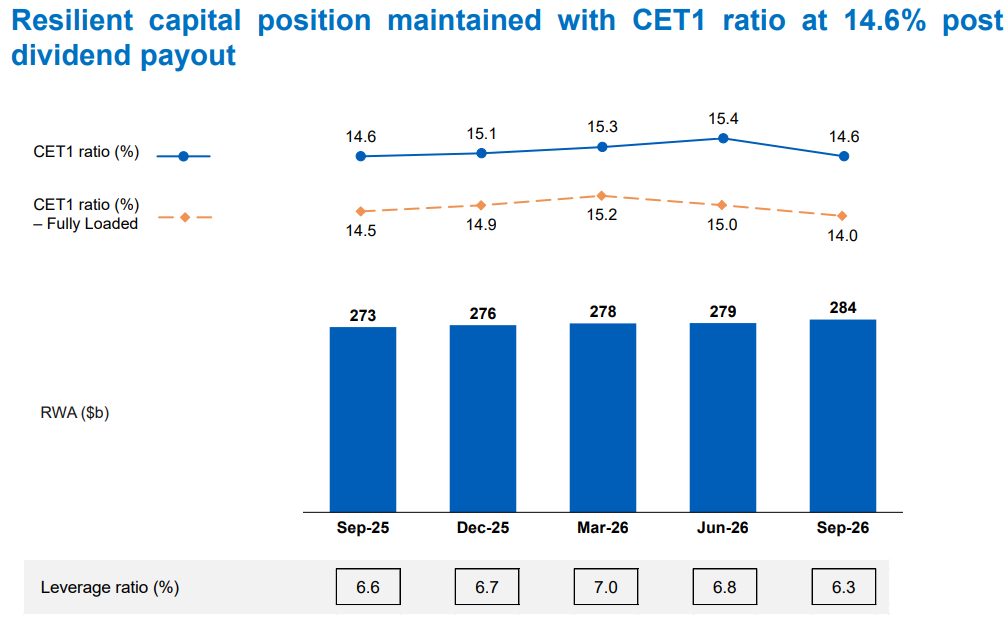
Common Equity Tier 1 (CET1) ratio eased to 14.6% in 3Q26, from 15.4% in the prior quarter, following the payment of the 2026 interim dividend.
CET1 remains comfortably above regulatory requirements, with the leverage ratio at 6.3% and liquidity metrics healthy, with the average all-currency Liquidity Coverage Ratio at 152% and Net Stable Funding Ratio at 112%.
No dividend was declared this quarter, as UOB typically pays an interim dividend at the half-year mark and a final dividend with full-year results.
#5 - UOB guides for moderately stronger growth in 2027
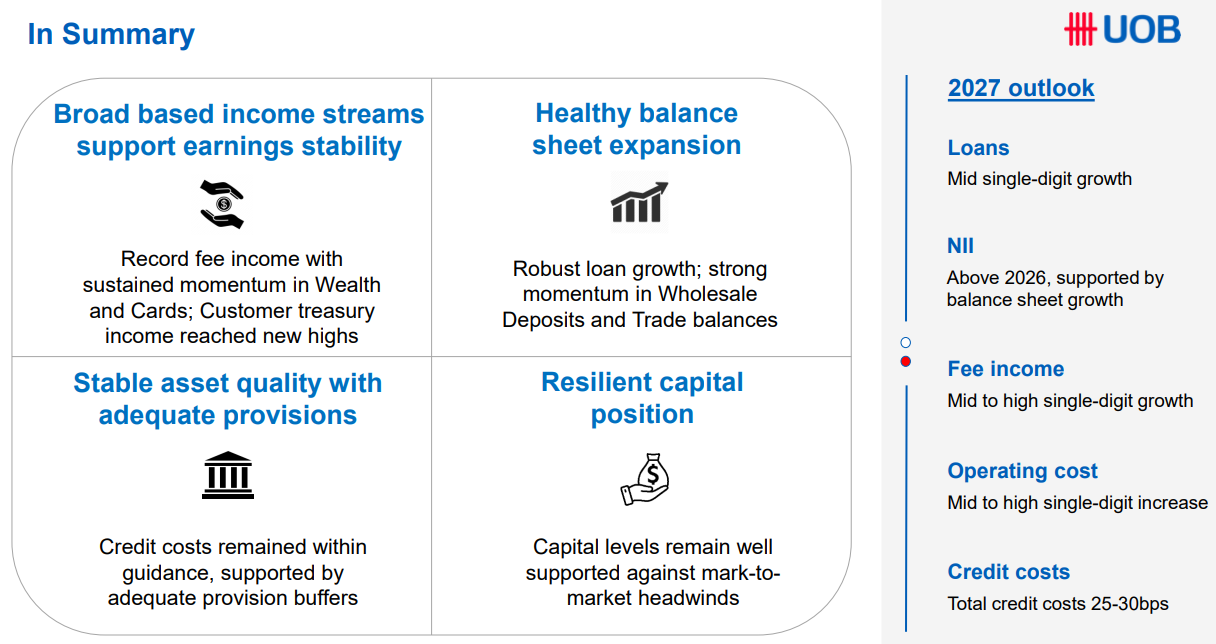
UOB introduced its 2027 outlook, which points to an improvement in growth across most line items compared to 2026.
The bank is guiding for mid single-digit loan growth (versus low single-digit in 2026), mid to high single-digit fee income growth (versus low single-digit in 2026), and net interest income above 2026 levels supported by balance sheet growth.
Operating costs are expected to grow at a mid to high single-digit rate (versus low single-digit in 2026), reflecting continued investments in the franchise.
Total credit costs guidance remains at 25–30 basis points.
Beansprout’s Quick Take on UOB earnings
UOB’s 3Q26 numbers came in below expectations, with net profit of S$1.25 billion missing the S$1.38 billion consensus forecast.
The miss was largely driven by continued net interest margin compression, with NIM falling another 6 basis points to 1.68%.
Looking at underlying trends, there were both bright spots and areas of concern.
On the positive side, fee income reached a new high at S$733 million, with strong momentum across wealth, cards, and loan-related activities.
Wealth income rose 13% year-on-year in the first nine months, while card income rose 25% year-on-year.
This supports UOB’s ambition to build a stronger capital-light income base, and complements the recently announced tie-up with Allianz Global Investors to divest UOB Asset Management.
The 2027 outlook was also more constructive than we have seen in recent quarters.
UOB expects stronger loan growth, higher fee income growth, and net interest income above 2026 levels, suggesting that the earnings trajectory could re-accelerate next year.
On the other hand, net interest margin fell another 6 basis points to 1.68%, driven mainly by higher funding costs.
The 9M26 NIM of 1.75% is now right at the lower bound of UOB’s full-year guidance range.
Greater China asset quality also remains the main area to watch.
The Greater China NPL ratio has climbed to 5.0%, from 3.5% six months ago, although the real estate and hospitality segment appears to be stabilising with an NPL ratio of 3.8%.
UOB closed at S$40.46 on 3 November 2026, before the 3Q26 release.
If we annualise the 1H26 interim dividend of $0.88 per share, this would imply a dividend yield of 4.3%.
UOB is currently trading at 1.35x price to book, higher than its historical average of 1.15x.
Want to see how UOB stacks up against DBS and OCBC on valuation, dividend yield and returns? Try Beansprout’s stock comparison tool here.
UOB is one of the stocks in Beansprout’s Opportunity Pot Portfolio, where our analyst team highlights the opportunities we believe stand out in the market today. See the stocks in the portfolio, how much we allocate to each, and what we are watching next.
Related links:
Check out Beansprout's guide to the best stock trading platforms in Singapore with the latest promotions to invest in UOB.
Enjoyed this insight? Follow Beansprout on Telegram, Youtube, Facebook and Instagram, and add Beansprout as your preferred source on Google so you never miss an update.
Read also
Gain financial insights in minutes
Subscribe to our free weekly newsletter for more insights to grow your wealth
Most Popular

Comments
0 comments