Keppel's M1 sale and Singtel in focus: Weekly Review with SIAS
Stocks
Powered by
By Gerald Wong, CFA • 18 Aug 2025
Why trust Beansprout? We’ve been awarded Best Investment Website at the SIAS Investors’ Choice Awards 2025
'%3e%3cpath%20fill-rule='evenodd'%20clip-rule='evenodd'%20d='M17.64%209.20455C17.64%208.56637%2017.5827%207.95273%2017.4764%207.36364H9V10.845H13.8436C13.635%2011.97%2013.0009%2012.9232%2012.0477%2013.5614V15.8195H14.9564C16.6582%2014.2527%2017.64%2011.9455%2017.64%209.20455V9.20455Z'%20fill='%234285F4'/%3e%3cpath%20fill-rule='evenodd'%20clip-rule='evenodd'%20d='M9%2018C11.43%2018%2013.4673%2017.1941%2014.9564%2015.8195L12.0477%2013.5614C11.2418%2014.1014%2010.2109%2014.4205%209%2014.4205C6.65591%2014.4205%204.67182%2012.8373%203.96409%2010.71H0.957275V13.0418C2.43818%2015.9832%205.48182%2018%209%2018V18Z'%20fill='%2334A853'/%3e%3cpath%20fill-rule='evenodd'%20clip-rule='evenodd'%20d='M3.96409%2010.71C3.78409%2010.17%203.68182%209.59318%203.68182%209C3.68182%208.40682%203.78409%207.83%203.96409%207.29V4.95818H0.957273C0.347727%206.17318%200%207.54773%200%209C0%2010.4523%200.347727%2011.8268%200.957273%2013.0418L3.96409%2010.71V10.71Z'%20fill='%23FBBC05'/%3e%3cpath%20fill-rule='evenodd'%20clip-rule='evenodd'%20d='M9%203.57955C10.3214%203.57955%2011.5077%204.03364%2012.4405%204.92545L15.0218%202.34409C13.4632%200.891818%2011.4259%200%209%200C5.48182%200%202.43818%202.01682%200.957275%204.95818L3.96409%207.29C4.67182%205.16273%206.65591%203.57955%209%203.57955V3.57955Z'%20fill='%23EA4335'/%3e%3c/g%3e%3cdefs%3e%3cclipPath%20id='clip0_0_2849'%3e%3crect%20width='18'%20height='18'%20fill='white'/%3e%3c/clipPath%3e%3c/defs%3e%3c/svg%3e)
Make Beansprout your preferred source on Google
Add us on Google to see more of our insights in your search results
We share about Keppel and Singtel in the latest Weekly Market Review.

What happened?
In this week's Weekly Market Review in partnership with Securities Investors Association Singapore (SIAS), we discuss key developments in the global equity market alongside Keppel and Singtel.
Watch the video to learn more about what we are looking out for this week.
Weekly Market Review
1:51 - Macro Update
- US markets continued rallying last week with the S&P 500 closing at 6,450 and the NASDAQ at 21,623.
- Singapore’s market hit a new high before closing slightly lower, ending the week at 4,231.
- Inflation data was mixed: consumer price index rose 0.2% for July, showing moderate inflation, while producer price index data came in stronger than expected, raising concerns about tariff-driven inflation.
- Market expectations for a September Fed rate cut remain high at about 92% despite the mixed inflation data.
- Bond yields continue to fall with US 1-year yield at 3.93% and Singapore 6-month T-bill at 1.59%, reflecting stronger rate cut expectations.
- Developers such as City Developments and UOL performed strongly, while Sembcorp Industries declined further following weak earnings.
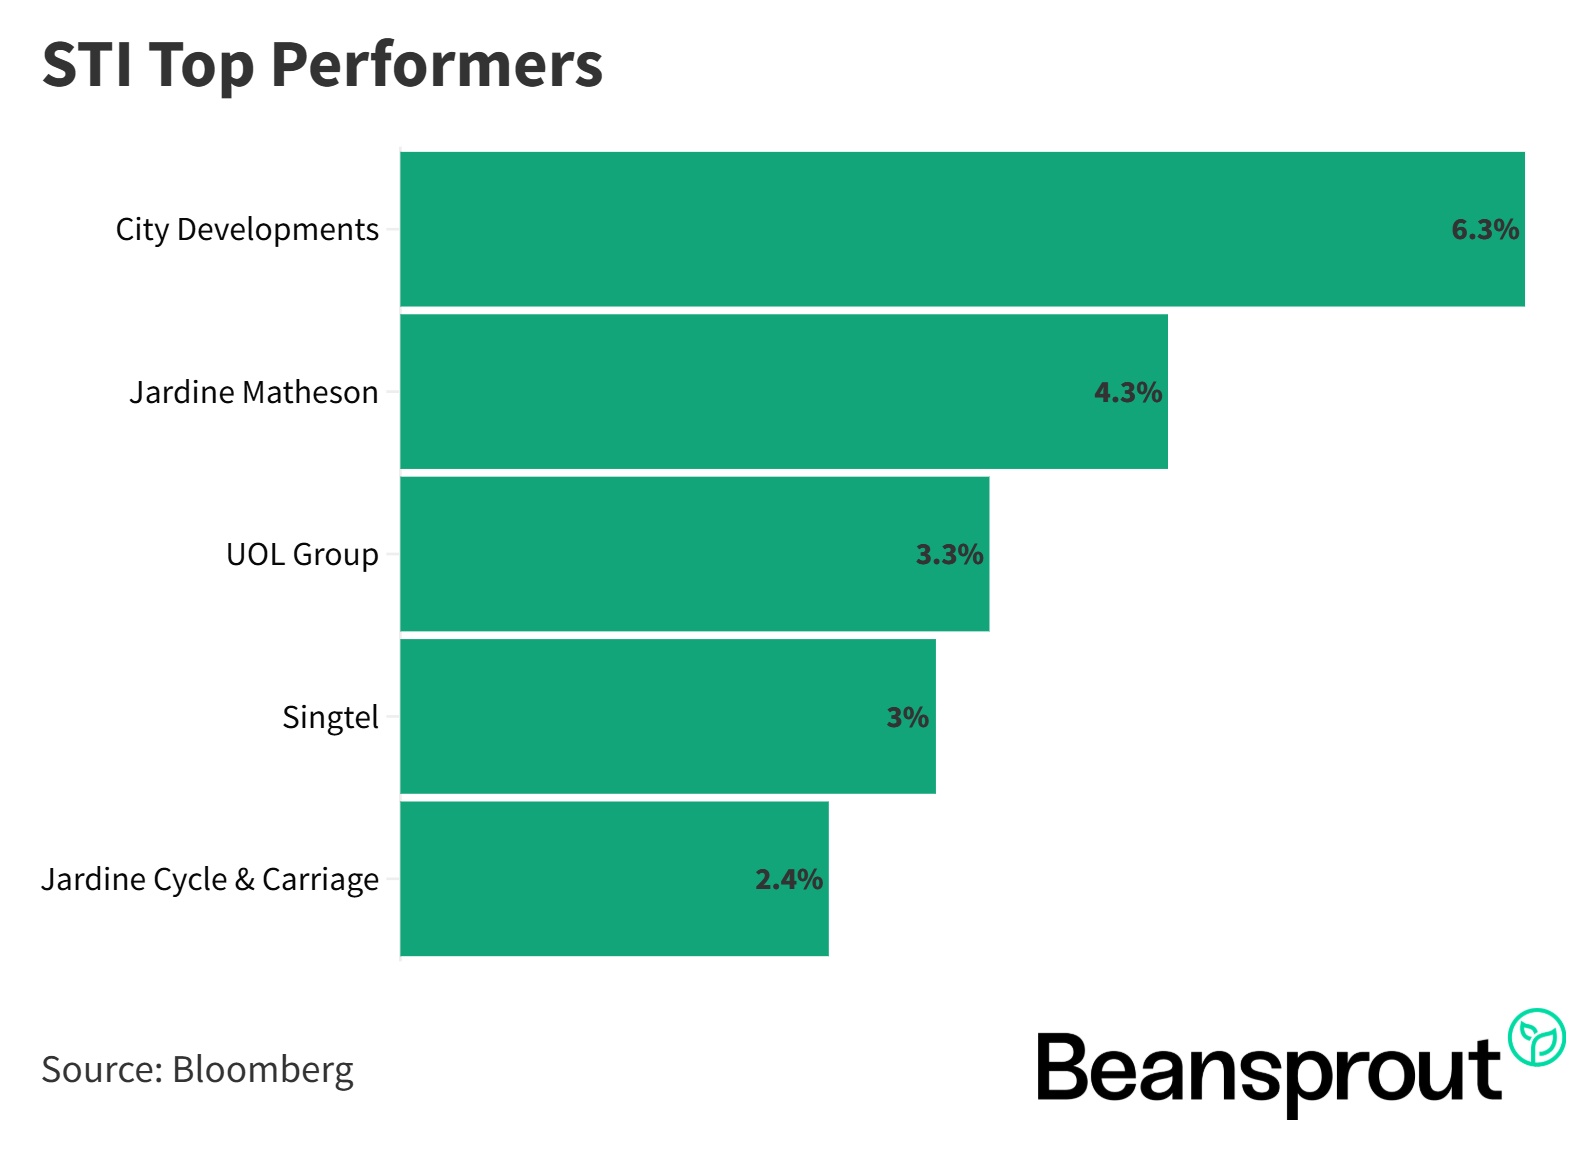
STI Top Performers:
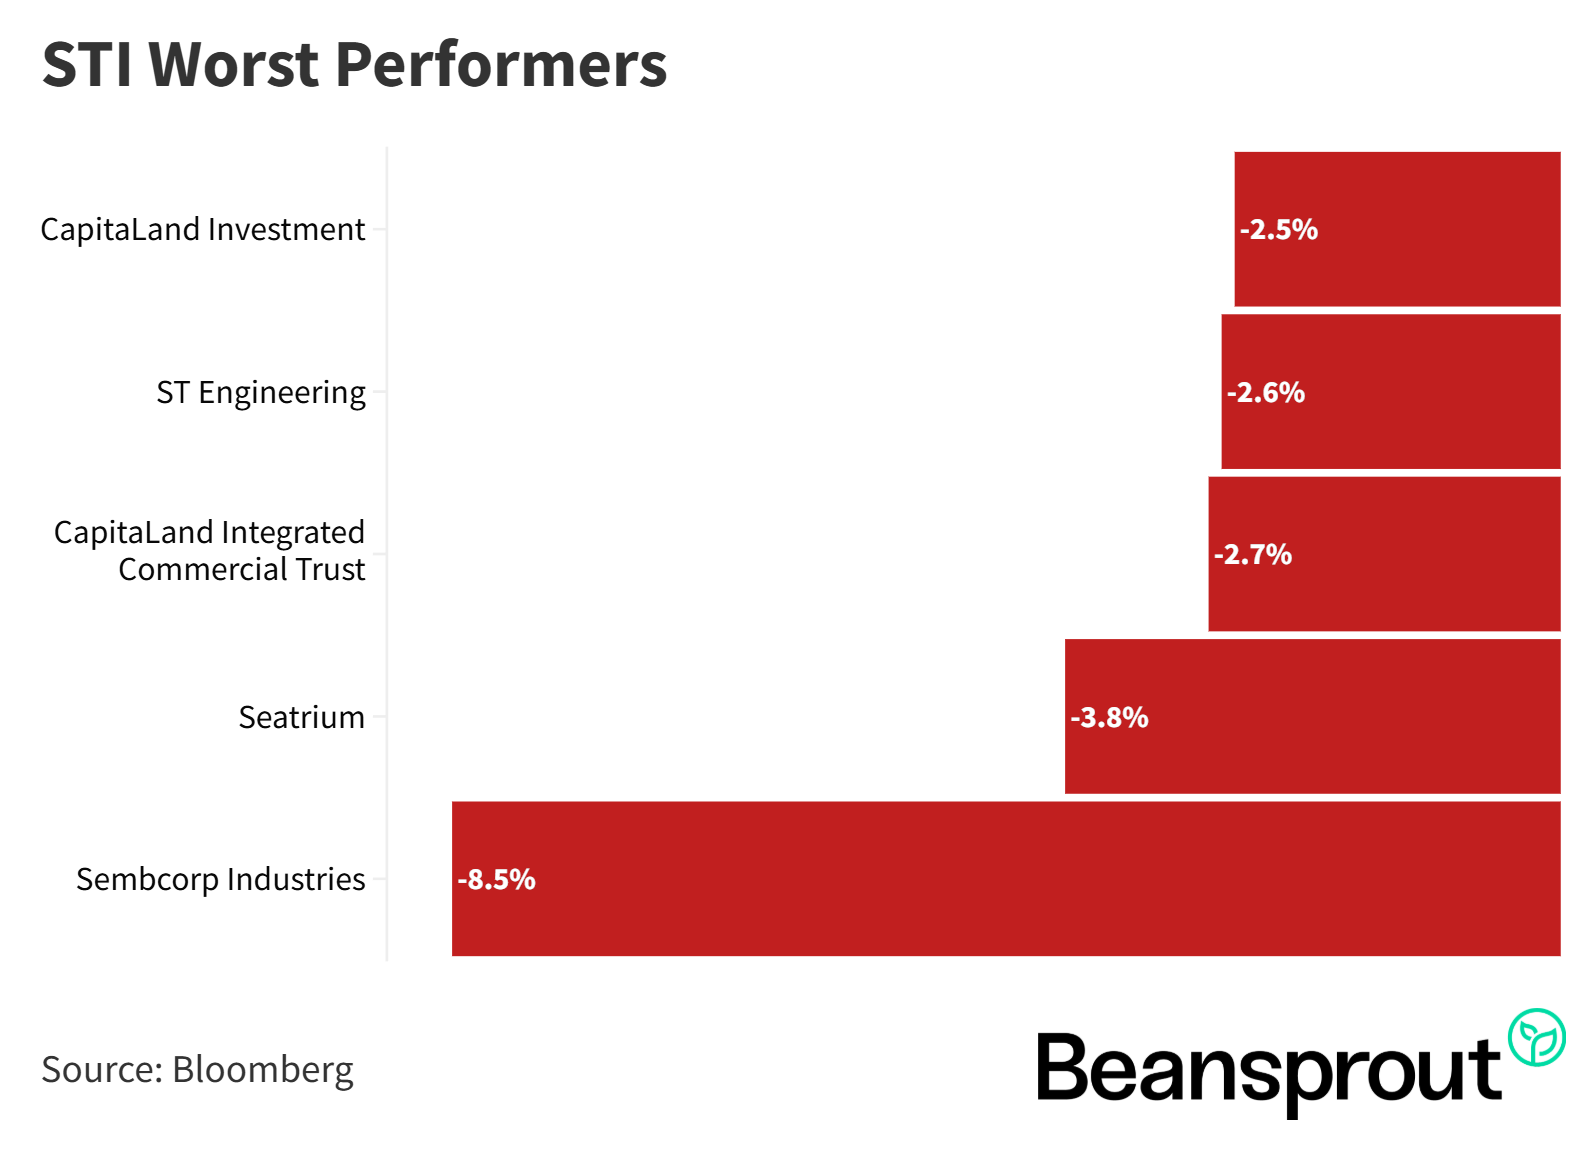
STI Worst Performers:
- CapitaLand Investment
- ST Engineering
- CapitaLand Integrated Commercial Trust
- Seatrium
- Sembcorp Industries
5:10 - Keppel
- Keppel’s planned sale of its M1 stake values the telco business at about S$1.43B on a 7.3x EV/EBITDA multiple, with Keppel retaining selected ICT assets for synergies and growth.
- Expected cash proceeds are close to S$1B based on Keppel’s effective ~84% stake, subject to IMDA approvals and a pre-completion restructuring to carve out excluded ICT assets.
- Pro forma effect: a modest EPS uplift to around 21.3 cents versus 20.8 cents for 1H25, and a stronger balance sheet with net debt to EBITDA improving to roughly 1.7x from 2.4x.
- The proceeds align with Keppel’s capital-recycling strategy, with about S$7.8B monetised since 2020 and roughly S$950M year to date in 2025, keeping it on track toward S$10–12B of monetisation by end-2026.
- Capital returns and efficiency initiatives include a total FY24 dividend of S$0.34 (c.4% yield) and a S$500M share buyback, with the current yield near 4% below its historical average.
- Share price context: rebounded from the April “Liberation Day” tariff dip to around $8.58, supported by divestments and balance-sheet improvement.
Read also:
Keppel - Sale of M1’s Telco business drives S$1.0 billion in cash proceeds
Related links:
10:08 - Singtel
- Share price bounced after the M1-to-Simba announcement and the latest quarterly results, with underlying net profit up 14% year over year, or 17% excluding currency effects.
- Execution of the Singtel28 plan is driving broad-based growth: Optus Australia operating profit rose 36%, while Singapore operations still delivered about 2% operating profit growth despite competition.
- Growth engines performed well: NCS operating profit grew 22% on better margins, and Digital Infraco’s operating profit increased, supported by regional data centre momentum.
- Regional associates strengthened contributions, led by India’s Airtel and Thailand’s AIS.
- On 2026 targets, Singtel remains on track: operating company EBIT is aimed at high single-digit growth (about 10% achieved in Q1), core savings target is $0.2B for the full year, and associates’ dividends are expected at $1B with $0.6B already booked in Q1.
Read also:
Yield + Growth: What’s Behind Singtel’s Momentum? Interview with CFO Arthur Lang
Related links:
13:40 - Technical Analysis
Straits Times Index
- The STI hit a new all-time high at 4,282 last Thursday, then pulled back on profit taking; expected near-term range remains 4,150 to 4,300.
- Upside probes to 4,290–4,300 are possible, but a major breakout like July’s surge is unlikely in the next couple of weeks.
- Key supports: first at the lower Bollinger Band around 4,167, aligning with the early-August low near 4,144–4,150; next support around the 50-day moving average near 4,100.
- Technicals point to consolidation: MACD has turned negative over the past week, signaling the prior multi-month rally is peaking.
- RSI has eased from 91 on 24 July to ~54, indicating weakening momentum; a dip below the 50 neutral mark alongside support near 4,150 could set up the next rebound toward 4,300.
Dow Jones Industrial Average
- Recent high at 45,203 with a slight pullback into a still-positive close, suggesting resilience near the 45,000 area.
- Momentum has improved: two positive sessions to end last week hint at a potential sustained rebound.
- In a sustained rebound, price often rides the upper Bollinger Band, similar to the late-July move.
- Technicals supportive: MACD has turned positive and RSI around 60 indicates healthy, non-overbought momentum.
- Key supports: 20-day moving average near 44,445–44,500 as first support; next support aligns with lower Bollinger Band and 50-day moving average around 43,600–43,800.
- Expected near-term range: roughly 43,700 to 45,000, with dips to support levels likely attracting buyers.
S&P 500
- Despite a soft Friday, all three major US indices posted a second straight positive week, underpinned by strong corporate earnings breadth with 80%+ of S&P 500 reporters beating expectations.
- Upcoming retail heavyweights like Walmart and Home Depot will offer a read on consumer demand and the durability of US growth.
- First support sits near the 20-day moving average around 6,366; stronger confluence support appears around 6,220–6,250 where the 50-day moving average and lower Bollinger Band cluster, alongside the early-August post-NFP low near 6,200.
- Momentum signals are constructive: MACD has turned positive, indicating the uptrend can continue while acknowledging consolidation risk.
- RSI near 65 shows firm momentum but approaches the 70 overbought zone, warranting closer monitoring of upside moves.
Nasdaq Composite Index
- Down 0.4% on Friday after touching a weekly high of 21,803, but indicators remain constructive.
- Momentum backdrop: MACD is positive and RSI around 67 is the strongest among the three major US indices, signaling comparatively stronger upside momentum.
- First support sits near the 20-day moving average around 21,208.
- Stronger support zone clusters around 21,000–20,500, where the early-August low, the lower Bollinger Band, and the 50-day moving average broadly align.
- Bias near term is for sideways-to-up movement, with dips into the support zone likely to draw buyers given the firm momentum profile.
What to look out for this week
- Tuesday, 19 August 2025: BHG Retail REIT, Prime US REIT, City Developments, Wilmar, YKGI ex-dividend
- Wednesday, 20 August 2025: SATS earnings, ComfortDelgro, CSE Global, Haw Par, Hong Leong Finance, Stoneweg Europe Stapled Trust ex-dividend
- Thursday, 21 August 2025: Olam, Starhub, United Hampshire US REIT ex-dividend
Get the full list of stocks with upcoming dividends here.
Follow us on Telegram, Youtube, Facebook and Instagram to get the latest financial insights.
Read also
Gain financial insights in minutes
Subscribe to our free weekly newsletter for more insights to grow your wealth
Most Popular

Comments
0 comments