DBS offers 5.9% dividend yield. Better buy than UOB and OCBC after the recent dip?
Stocks
By Gerald Wong, CFA • 08 Mar 2026
Why trust Beansprout? We’ve been awarded Best Investment Website at the SIAS Investors’ Choice Awards 2025
'%3e%3cpath%20fill-rule='evenodd'%20clip-rule='evenodd'%20d='M17.64%209.20455C17.64%208.56637%2017.5827%207.95273%2017.4764%207.36364H9V10.845H13.8436C13.635%2011.97%2013.0009%2012.9232%2012.0477%2013.5614V15.8195H14.9564C16.6582%2014.2527%2017.64%2011.9455%2017.64%209.20455V9.20455Z'%20fill='%234285F4'/%3e%3cpath%20fill-rule='evenodd'%20clip-rule='evenodd'%20d='M9%2018C11.43%2018%2013.4673%2017.1941%2014.9564%2015.8195L12.0477%2013.5614C11.2418%2014.1014%2010.2109%2014.4205%209%2014.4205C6.65591%2014.4205%204.67182%2012.8373%203.96409%2010.71H0.957275V13.0418C2.43818%2015.9832%205.48182%2018%209%2018V18Z'%20fill='%2334A853'/%3e%3cpath%20fill-rule='evenodd'%20clip-rule='evenodd'%20d='M3.96409%2010.71C3.78409%2010.17%203.68182%209.59318%203.68182%209C3.68182%208.40682%203.78409%207.83%203.96409%207.29V4.95818H0.957273C0.347727%206.17318%200%207.54773%200%209C0%2010.4523%200.347727%2011.8268%200.957273%2013.0418L3.96409%2010.71V10.71Z'%20fill='%23FBBC05'/%3e%3cpath%20fill-rule='evenodd'%20clip-rule='evenodd'%20d='M9%203.57955C10.3214%203.57955%2011.5077%204.03364%2012.4405%204.92545L15.0218%202.34409C13.4632%200.891818%2011.4259%200%209%200C5.48182%200%202.43818%202.01682%200.957275%204.95818L3.96409%207.29C4.67182%205.16273%206.65591%203.57955%209%203.57955V3.57955Z'%20fill='%23EA4335'/%3e%3c/g%3e%3cdefs%3e%3cclipPath%20id='clip0_0_2849'%3e%3crect%20width='18'%20height='18'%20fill='white'/%3e%3c/clipPath%3e%3c/defs%3e%3c/svg%3e)
Make Beansprout your preferred source on Google
Add us on Google to see more of our insights in your search results
The share prices of DBS, UOB and OCBC have pulled back with recent market volatility. With a dividend yield of 5.9%, we find out if DBS is still a better buy than UOB and OCBC.
What happened?
The share price performance of DBS, UOB and OCBC is back in focus amongst investors once again.
After touching news highs earlier in 2026, their shares prices have pulled back with the recent escalation in the Middle East conflict.
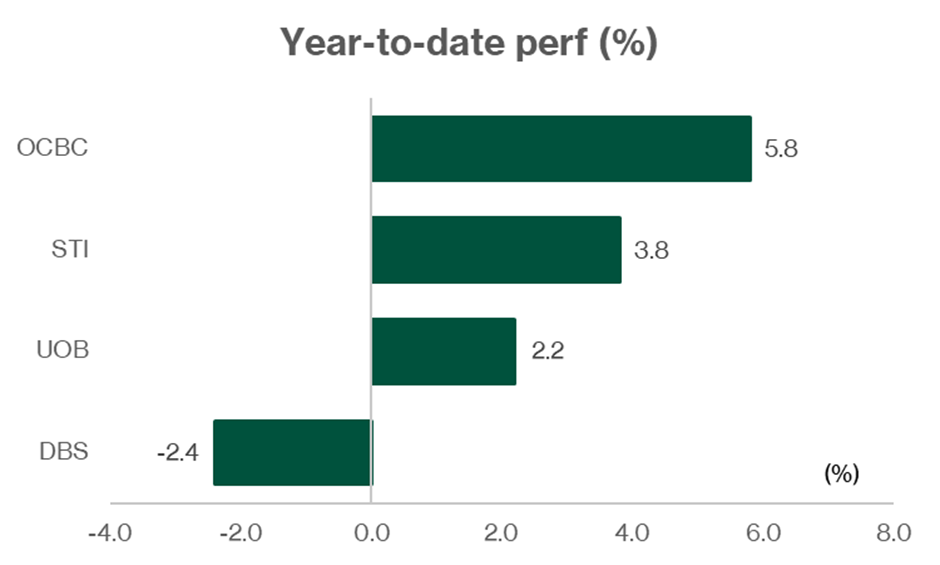
As of 4 March 2026, OCBC has a slight gain of 5.8% year-to-date, UOB has a gain of 2.2% year-to-date, while DBS has declined by 2.4% year-to-date.
That said, the banks continue to offer some of the highest dividend yields amongst blue chip stocks in Singapore.
With the recent movement, I have seen questions in the Beansprout community on how DBS, UOB and OCBC will be impacted by the recent spike in geopolitical tensions, and if it is still worth holding the Singapore banks for dividend income.
In this article, I look at their recent earnings reports to understand their financial performance, take a look at how Singapore banks may be impacted by geopolitical risks, and compare their dividend yields to find out how DBS, UOB and OCBC are positioned.
OCBC reported year-on-year net profit increase in 4Q25, but DBS and UOB saw profit declines
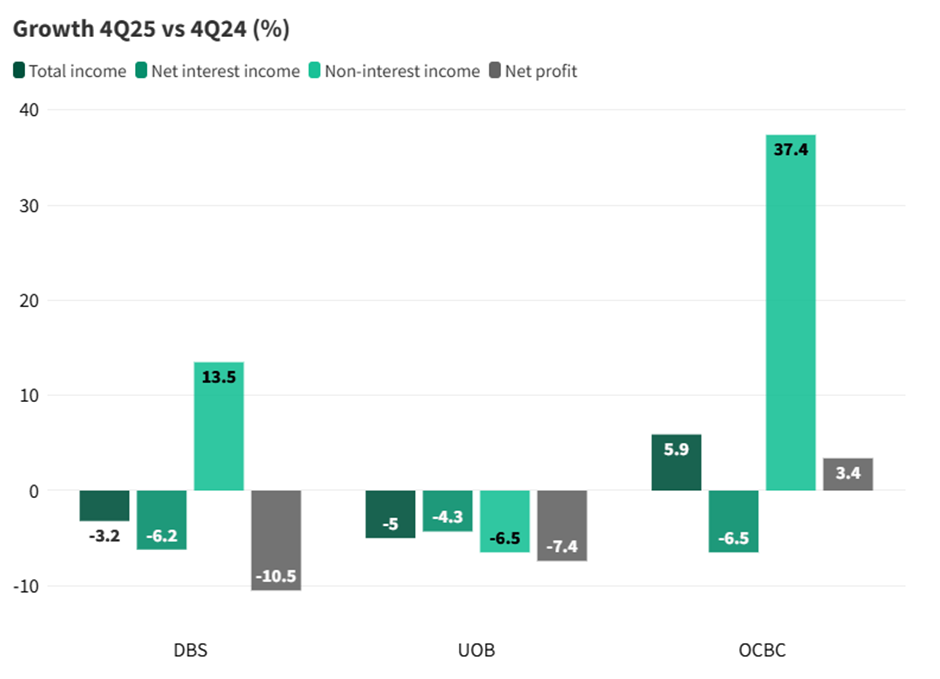
OCBC stood out in the latest quarter. For 4Q25, net profit rose 3.4% year-on-year to S$1.75 billion, supported by a strong 37.4% jump in non-interest income and a slight recovery in net interest margin (NIM) compared to the previous quarter. This made OCBC the only local bank to report profit growth year-on-year for the quarter. Total income also increased 5.9% to S$3.62 billion.
In comparison, DBS reported weaker results. 4Q25 net profit fell 10.5% year-on-year to S$2.36 billion, as pressure on margins, higher allowances linked to a single real estate non-performing loan, and the absence of one-off gains from the previous year offset stronger fee income and treasury customer sales.
UOB also saw earnings decline. 4Q25 net profit dropped 7.4% year-on-year to S$1.41 billion, as lower margins more than offset the benefit from loan growth.
OCBC led loan growth in 4Q25, while all three banks showed steady expansion
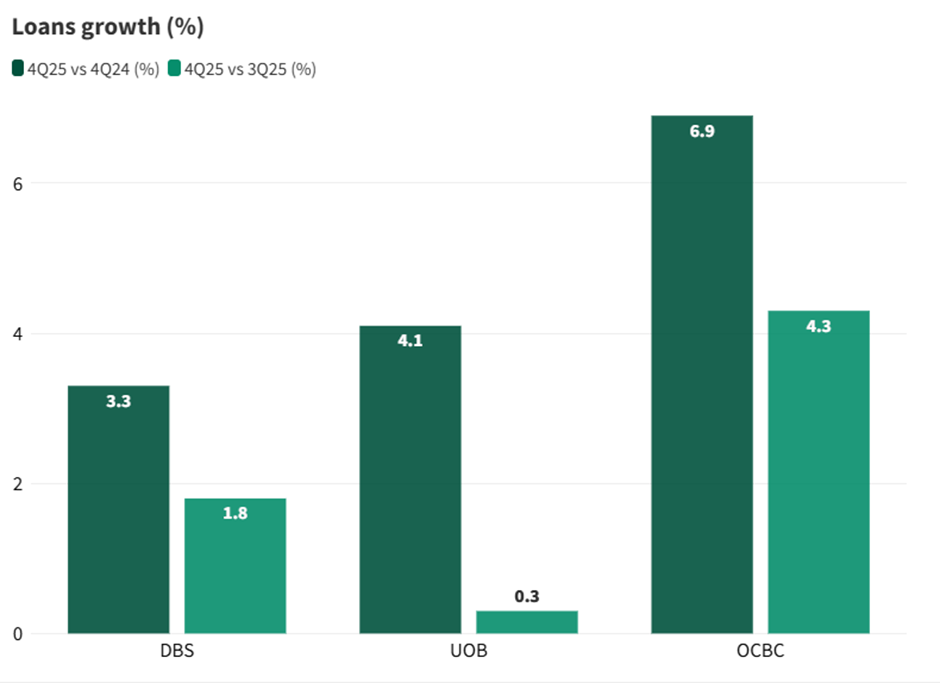
OCBC continued to lead in loan growth in 4Q25, with its loan book expanding 6.9% year-on-year and 4.3% quarter-on-quarter. Growth was mainly driven by Singapore mortgages and stronger corporate lending across ASEAN.
UOB reported loan growth of 4.1% year-on-year, supported by steady demand from its corporate and regional customer base.
DBS saw more moderate growth of 3.3% year-on-year, but still delivered broad-based expansion across corporate and wealth management loans, bringing total gross loans to S$451 billion.
Looking at the full year, all three banks recorded loan growth in FY2025. This suggests that underlying credit demand across Singapore and the region remained resilient, even as global uncertainty created a more challenging operating environment.
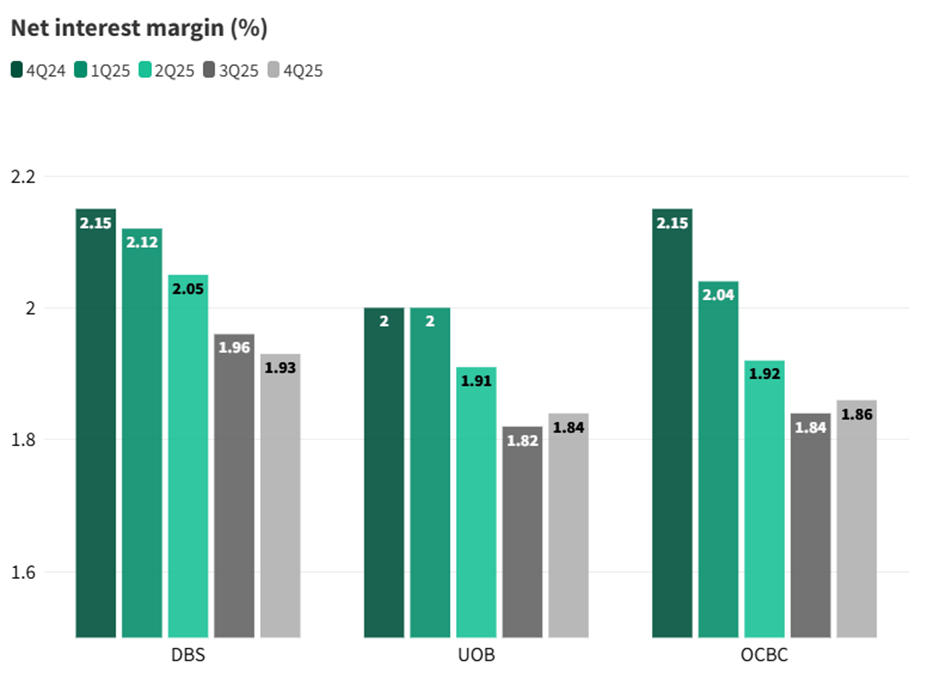
Net interest margins stabilised in 4Q25, with UOB and OCBC showing sequential improvement
Net interest margins (NIMs) declined through most of 2025 as interest rates eased, but the pace of decline now appears to be stabilising.
In 4Q25, both UOB and OCBC reported a small improvement in NIM compared to the previous quarter, while DBS saw a slight dip.
DBS still had the highest NIM among the three banks at 1.93% in 4Q25, supported by strong deposit growth and its large base of low-cost deposits. However, this was 0.22 percentage points lower than a year ago, reflecting the impact of lower SORA and HIBOR rates.
UOB’s NIM edged up from 1.82% in 3Q25 to 1.84% in 4Q25, helped by better control over funding costs. For the full year, UOB’s NIM declined by 14 basis points to 1.89%.
OCBC also saw a modest quarter-on-quarter improvement, with NIM rising from 1.84% to 1.86% in 4Q25 as deposit repricing stabilised. For FY2025, OCBC’s NIM fell by 29 basis points to 1.91%.
Overall, the slight improvement at UOB and OCBC suggests that margin pressure may be easing. However, all three banks have guided that NIM could still face some mild pressure in 2026 if interest rates continue to trend lower.
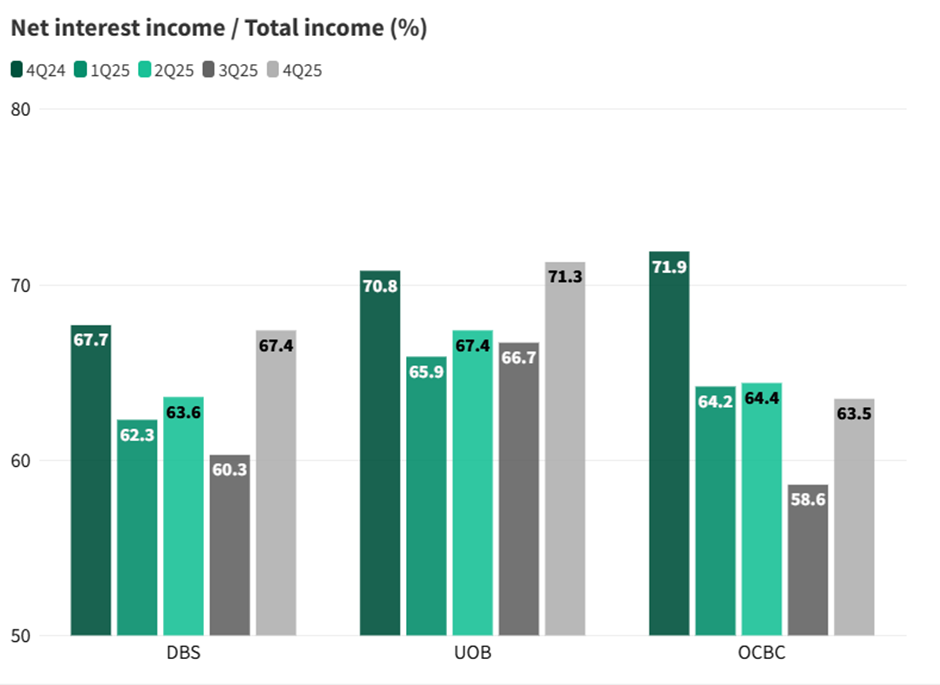
Net Interest Income as a share of total income diverged in 4Q25
DBS’ net interest income (NII) made up a smaller share of total income in 4Q25, falling to 60.3%, the lowest among the three banks.
This was mainly because non-interest income grew 13.5% year-on-year, outpacing the growth in NII. As a result, DBS’ earnings mix is gradually shifting more towards fee-based income, making it less dependent on interest rates compared to before.
OCBC’s income mix was largely unchanged at around 63–64%. A strong 37.4% jump in non-interest income in 4Q25 helped offset a 6.5% decline in NII, keeping the overall balance of its earnings relatively stable.
UOB moved in the opposite direction. Its NII share rose to 71.9% in 4Q25, the highest among the three banks. This happened because non-interest income fell by 6.5% year-on-year, while NII declined by a smaller 4.3%.
This suggests UOB is still more reliant on interest income in the near term, which could make its earnings more sensitive if interest rates fall further compared to DBS and OCBC.
DBS and OCBC delivered record non-interest income; wealth management AUM hits new highs across all three
The big story in FY2025 was the continued shift towards fee-driven income, with all three banks reporting record non-interest income on the back of strong wealth management activity.
DBS saw non-interest income rise 13.5% year-on-year in 4Q25, supported by wealth management fees which grew 24% to S$645 million, and investment banking fees which jumped 45%. For the full year, DBS’ fee income reached a record S$4.9 billion, up 18%.
OCBC delivered the strongest growth in the fourth quarter, with non-interest income up 37.4% year-on-year. This was driven by insurance income more than doubling, while wealth management fees rose 26% to S$311 million. For FY2025, OCBC’s total non-interest income increased 16% to S$5.46 billion, with wealth management fees rising 33%, the fastest growth among the three banks.
UOB was the only bank to see a decline in non-interest income in 4Q25, which fell 6.5% year-on-year as trading and investment income normalised from a strong base a year earlier. Even so, UOB still delivered record results for the full year, with fee income up 7% to S$2.6 billion and wealth management income rising 14%.
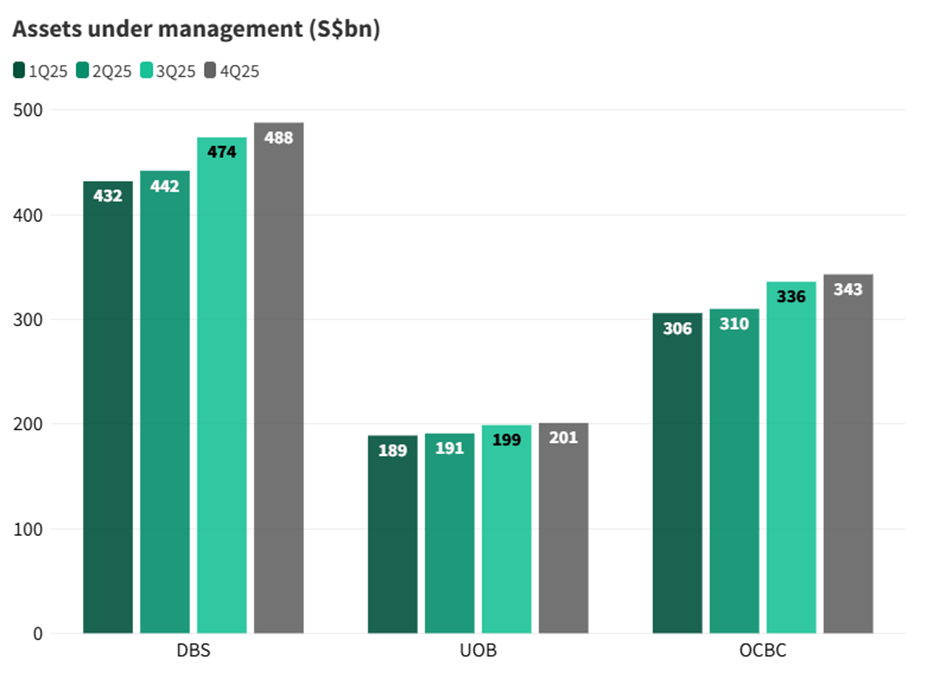
One clear sign of this shift is the growth in assets under management (AUM), which drives fee income. DBS remains the largest with S$488 billion in AUM at end-4Q25, up from S$432 billion at the start of the year. OCBC’s wealth platform, led by Bank of Singapore, recorded the strongest percentage growth, reaching S$343 billion, while UOB’s AUM increased to S$201 billion.
With AUM rising across all three banks, fee income is likely to make up a larger share of earnings going forward, which becomes increasingly important as net interest margins face pressure into 2026.
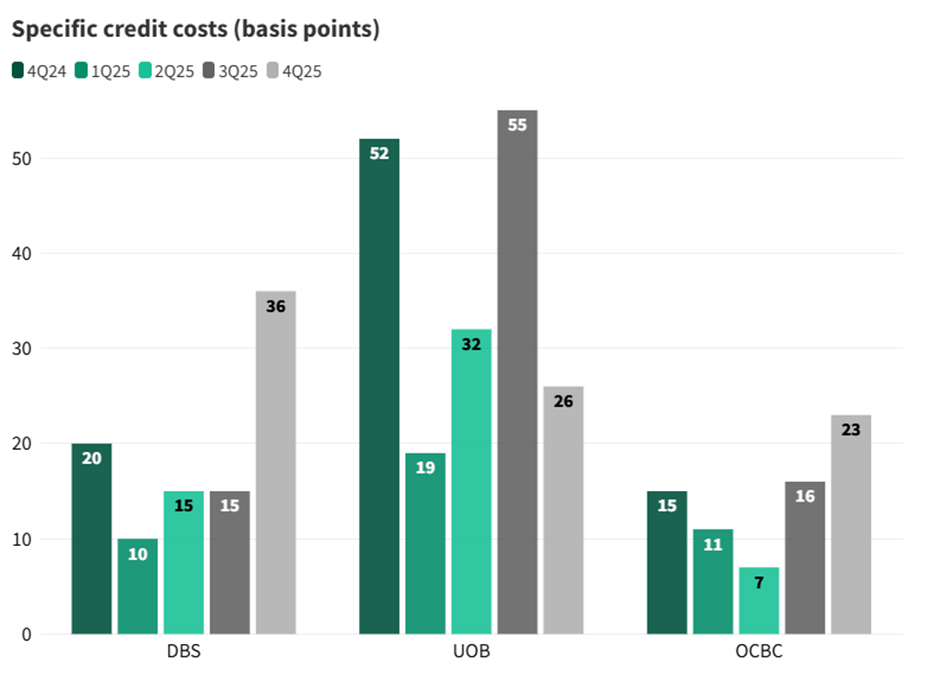
Asset quality remained healthy, though specific credit costs rose at DBS in 4Q25
The main credit story in 2025 was UOB’s decision to set aside higher provisions earlier in the year. In 3Q25, UOB took a more cautious stance by building up general provisions, but by 4Q25 credit costs had eased back to 19 basis points, a sharp improvement from the unusually high level in the previous quarter.
At DBS, credit costs rose in 4Q25 due to a single non-performing loan linked to the real estate sector. Specific provisions increased to S$415 million, largely because of this exposure. However, DBS also wrote back S$206 million of general provisions, including some that had previously been set aside for the same loan, which helped to offset the impact.
For OCBC, credit costs came in at 20 basis points of loans in 4Q25 on an annualised basis, slightly higher than 16 basis points in the previous quarter. Total allowances rose to S$200 million, up 44% quarter-on-quarter, mainly due to higher provisions for impaired loans, although this was partly offset by write-backs on loans that performed better than expected.
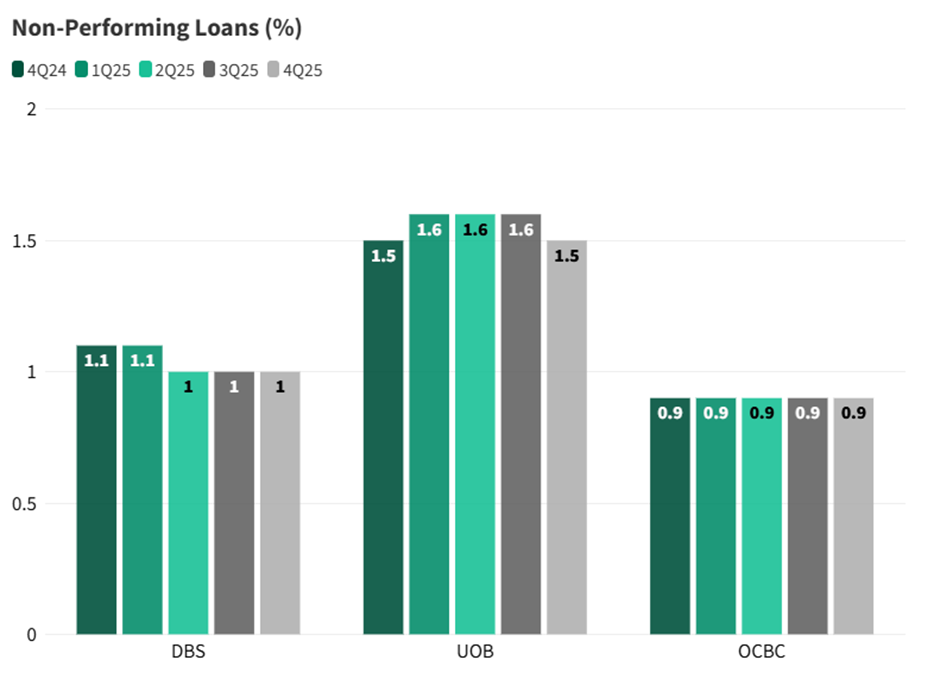
Non-performing loan (NPL) ratios remained stable across all three banks throughout 2025, suggesting that overall credit quality is still holding up well.
OCBC continued to report the lowest NPL ratio at 0.9%, unchanged across all five quarters shown.
DBS saw a slight improvement earlier in the year, with its NPL ratio falling from 1.1% to 1.0%, and it remained steady at that level through the rest of the year.
UOB’s NPL ratio ticked up to 1.6% in 3Q25 but eased back to 1.5% in 4Q25, as loan recoveries and write-offs helped offset new problem loans.
Overall, there were no signs of broad-based deterioration in credit quality across the banking sector. The main area investors are watching remains real estate-related exposures.
Singapore banks offer a forward dividend yield of 4–6%
DBS raised its quarterly ordinary dividend to S$0.66 per share in 4Q25, up from S$0.60 previously, bringing total dividends for FY2025 to S$3.06 per share, about 38% higher than the year before.
The bank has also committed to maintaining its additional S$0.15 per share capital return dividend each quarter through 2026 and 2027.
Find out how much dividends you would have received as a shareholder of DBS in the past 12 months with the calculator below.
OCBC proposed a final ordinary dividend of S$0.42 per share, along with a special dividend of S$0.16 per share, bringing total FY2025 dividends to S$0.99 per share. The special dividend is part of OCBC’s S$2.5 billion capital return plan, which the bank intends to complete by FY2026.
Looking ahead, OCBC has guided for an ordinary dividend payout ratio of about 50% for FY2026.
Find out how much dividends you would have received as a shareholder of OCBC in the past 12 months with the calculator below.
UOB declared a final ordinary dividend of S$0.71 per share, bringing total ordinary dividends for FY2025 to S$1.56 per share, lower than FY2024’s S$1.80.
During 2025, UOB also paid a total of S$0.50 per share in special dividends over two tranches as part of its capital return programme.
Find out how much dividends you would have received as a shareholder of UOB in the past 12 months with the calculator below.
Overall, DBS had the highest FY2025 payout ratio at about 79%, including its capital return dividend. This brings its dividend yield to the highest amongst the three Singapore banks.
By comparison, UOB has a lower payout ratio of about 50%.
OCBC’s payout ratio of around 60% including special dividends, sits in between. However, OCBC has guided for an ordinary payout ratio of about 50% in FY2026.
| Dividends | DBS | UOB | OCBC |
| FY2025 total dividends | S$3.06 | S$1.56 | S$0.99 |
| Special / capital return DPS | S$0.60 (capital return) | S$0.50 (special) | S$0.16 (special) |
| FY2025 vs FY2024 | +38% | -13% | -2% |
| Payout ratio | ~79% incl. cap return | 50% | 60% (incl. special) |
| Forward yield | ~5.9% | ~4.8% | ~4.7% |
| Source: Company data; *Forward yields based on Factset consensus and share prices as at 4 March 2026 | |||
FY2026 outlook
DBS: resilient income, slightly lower net profit
DBS expects total income in FY2026 to be broadly similar to FY2025. Net interest income may come in slightly lower due to softer interest rates and a stronger Singapore dollar, although this could be partly offset by mid-teens growth in wealth management income.
Management has guided for FY2026 net profit to be slightly below FY2025 levels. Specific credit costs are expected to be around 17–20 basis points, with the possibility of some write-backs of general provisions.
CEO Tan Su Shan highlighted geopolitical uncertainty, currency movements and global supply chain shifts as key factors to watch, but noted that market volatility can also support client activity in treasury and wealth products.
DBS is targeting a cost-to-income ratio in the low-40% range, and continues to run its S$3 billion share buyback programme alongside its commitment to pay a capital return dividend.
UOB: credit costs will be key driver in 2026
UOB expects low single-digit loan growth, a full-year NIM of around 1.75%–1.80%, and high single-digit growth in fee income. Operating expenses are expected to grow at a low single-digit pace, while total credit costs are guided at 25–30 basis points.
A key swing factor will be whether credit costs normalise after the higher provisioning seen in 2025.
CFO Leong Yung Chee noted that the bank had already built up buffers in 3Q25, which should give it room to manage pockets of stress without needing large additional provisions.
OCBC: stable to growing total income under new CEO
OCBC expects stable-to-growing total income in FY2026, supported by expected double-digit growth in non-interest income.
Net interest income is still expected to decline slightly, based on management’s assumptions of lower interest rates, including 3-month SORA at about 1.4% and Fed funds at around 3.5%.
The bank is guiding for mid-single-digit loan growth, credit costs of 20–25 basis points, and a cost-to-income ratio in the low-to-mid 40% range.
New CEO Tan Teck Long, who took over at the start of 2026, has outlined the bank’s “Next Frontier” strategy. Key priorities include strengthening OCBC’s Singapore and Hong Kong hubs, refreshing its ASEAN strategy, and completing the S$2.5 billion capital return plan.
Management has also indicated a preference to reward shareholders mainly through dividends rather than share buybacks.
How will the Middle East conflict affect DBS, UOB and OCBC?
With the Middle East conflict adding fresh uncertainty, especially if the conflict lasts longer or spreads, the outlook for bank earnings could weaken.
Slower growth may weigh on both net interest income and fee income, while also increasing the risk of higher credit costs.
Loan growth: If business and consumer confidence weakens, borrowing demand may slow. This would likely lead to softer loan growth and reduce income momentum.
NIM: Net interest margins will depend on the path of interest rates and how quickly funding costs adjust. If rates fall, loan yields may reprice lower faster than deposit costs, putting pressure on margins. If rates stay higher for longer, NIM could hold up better, although deposit competition may still keep funding costs elevated.
Fee income: Management remains positive on wealth and fee income, but this is still tied to market activity. Volatility can support trading and wealth flows, while risk-off sentiment may reduce investment appetite, so the overall impact is less clear.
Credit costs: This remains the key downside risk. If growth slows more sharply or stress emerges in certain sectors, credit costs could rise, and that would likely hit earnings more quickly than the other moving parts.
What would Beansprout do?
The share price performance of DBS, UOB and OCBC have pulled back from highs with the recent escalation in Middle East conflict.
From the latest 2025 earnings, Singapore’s banks remain fundamentally strong, even as earnings become less dependent on interest rates.
However, we have seen a divergence in their financial performance, dividend payouts, as well as share price performances.
- DBS offers the strongest dividend visibility and highest forward yield, but also trades at the richest valuation.
- OCBC has the most constructive FY2026 income outlook, though there is less certainty around special dividends.
- UOB could see steadier earnings if credit costs remain contained, but dividend upside may be more limited.
| Bank | Summary | What to watch |
| DBS | Highest dividend visibility and forward yield, but also the most expensive | NIM trend and any unexpected jump in provisions |
| OCBC | Most constructive FY2026 income guidance, but less clarity on special dividends | Whether fee and insurance momentum can hold up |
| UOB | Earnings may hold up better if provisions stay contained, but dividend payout may be capped | Credit costs and sensitivity to interest income |
At this point, it may be difficult to assess precisely how the rising geopolitical risks will impact the Singapore banks, as it will depend on how long the Middle East conflict goes on for and if we see a further escalation.
Against a weaker economic environment and greater market uncertainty, we think it might be worth looking at Singapore banks from the lens of dividend yield and payout visibility.
DBS stands out because it has given the clearest guidance on dividends, with plans to maintain its S$0.15 quarterly capital return dividend through FY2026 to FY2027, barring unforeseen circumstances, on top of its ordinary dividend. This gives income investors more certainty even if earnings come under pressure.
At an annualised dividend run rate of S$3.24 per share and a share price of S$55 as of 4 March 2026, DBS offers a forward yield of about 5.9%.
Based on consensus estimates, OCBC offers a forward dividend yield of about 4.7%, based on dividend per share of S$0.972 and a share price of S$20.90 as of 4 March 2026.
UOB offers a forward yield of about 4.8%, based on dividend per share of S$1.705 and a closing price of S$35.83 on 4 March 2026.
The price-to-book valuations for all three Singapore banks are currently above their historical averages, with DBS the richest, trading at a price-to-book ratio of 2.2x, followed by the price-to-book ratio of 1.5x for OCBC and price-to-book ratio of 1.2x for UOB.
| Valuation snapshot | DBS | UOB | OCBC |
| Price-to-book | ~2.3x | ~1.2x | ~1.5x |
| Forward dividend yield | ~5.9% | ~4.8% | ~4.7% |
| FY2026 income guidance | Broadly flat | Modest growth | Stable to growing |
| Source: Factset, as of 4 March 2026 | |||
If you’d prefer broad exposure to the Singapore market, you can also consider learning more about the Straits Times Index (STI), which tracks the performance of Singapore’s largest blue chip companies.
Related links:
- DBS share price and share price target
- DBS dividend history and forecast
- OCBC share price and share price target
- OCBC dividend history and forecast
- UOB share price and share price target
- UOB dividend history and forecast
Check out Beansprout's guide to the best stock trading platforms in Singapore with the latest promotions to invest in DBS, UOB and OCBC.
Enjoyed this insight? Follow Beansprout on Telegram, Youtube, Facebook and Instagram, and add Beansprout as your preferred source on Google so you never miss an update.
Read also
Gain financial insights in minutes
Subscribe to our free weekly newsletter for more insights to grow your wealth
Most Popular

Comments
1 comments
- Ben • 09 Mar 2026 12:47 AM
%20--%3e%3csvg%20version='1.1'%20id='Layer_1'%20xmlns='http://www.w3.org/2000/svg'%20xmlns:xlink='http://www.w3.org/1999/xlink'%20x='0px'%20y='0px'%20viewBox='0%200%20160.45%20160.45'%20style='enable-background:new%200%200%20160.45%20160.45;'%20xml:space='preserve'%3e%3cstyle%20type='text/css'%3e%20.st0{fill:%2300DBA4;}%20%3c/style%3e%3cg%3e%3cg%3e%3cpath%20class='st0'%20d='M80.23,0C35.99,0,0,35.99,0,80.23s35.99,80.23,80.23,80.23c44.24,0,80.23-35.99,80.23-80.23S124.46,0,80.23,0%20z%20M80.23,149.37c-1.73,0-3.45-0.09-5.15-0.21l0-38.76c-1.44-31.08,14.86-34.75,32.13-38.65c5.66-1.28,11.08-2.5,15.76-4.7%20c1.78,15.32-1.66,28.48-9.68,37.18c-0.11,0.11-10.83,10.24-23.27,10.24c-1.12,0-2.26-0.08-3.4-0.26l-1.72,10.94%20c1.73,0.27,3.44,0.4,5.11,0.4c16.97,0,30.39-12.77,31.2-13.57c11.35-12.3,15.63-30.42,12.07-51.01l-2.17-12.46l-10.42,7.15%20c-3.7,2.54-9.63,3.87-15.93,5.29c-16.97,3.82-42.62,9.6-40.75,49.71v36.77c-30.32-7.32-52.92-34.67-52.92-67.21%20c0-38.13,31.02-69.15,69.15-69.15c38.13,0,69.15,31.02,69.15,69.15S118.36,149.37,80.23,149.37z'/%3e%3cpath%20class='st0'%20d='M56.13,44.13c-3.86-0.87-7.5-1.69-9.57-3.11l-9.25-6.35l-1.92,11.06c-2.41,13.89,0.52,26.16,8.48,34.77%20c0.37,0.36,7.58,7.23,17.36,8.83c0.43-1.57,0.92-3.09,1.48-4.54c0.85-2.19,1.85-4.26,3-6.21c-7.3,0.3-13.91-5.81-13.92-5.81%20c0,0,0,0,0,0c-4.44-4.81-6.53-11.78-6.09-19.96c2.57,0.91,5.31,1.52,8.01,2.13c8.98,2.02,16.94,3.83,18.8,15.11%20c0.56-0.52,1.13-1.04,1.72-1.53c2.54-2.12,5.24-3.84,8-5.27C77.55,48.96,64.62,46.04,56.13,44.13z'/%3e%3c/g%3e%3c/g%3e%3c/svg%3e) Beansprout • 09 Mar 2026 02:53 AM
Beansprout • 09 Mar 2026 02:53 AM