CapitaLand Integrated Commercial Trust vs CapitaLand Ascendas REIT - Which looks more attractive now
REITs
By Gerald Wong, CFA • 11 Feb 2026
Why trust Beansprout? We’ve been awarded Best Investment Website at the SIAS Investors’ Choice Awards 2025
'%3e%3cpath%20fill-rule='evenodd'%20clip-rule='evenodd'%20d='M17.64%209.20455C17.64%208.56637%2017.5827%207.95273%2017.4764%207.36364H9V10.845H13.8436C13.635%2011.97%2013.0009%2012.9232%2012.0477%2013.5614V15.8195H14.9564C16.6582%2014.2527%2017.64%2011.9455%2017.64%209.20455V9.20455Z'%20fill='%234285F4'/%3e%3cpath%20fill-rule='evenodd'%20clip-rule='evenodd'%20d='M9%2018C11.43%2018%2013.4673%2017.1941%2014.9564%2015.8195L12.0477%2013.5614C11.2418%2014.1014%2010.2109%2014.4205%209%2014.4205C6.65591%2014.4205%204.67182%2012.8373%203.96409%2010.71H0.957275V13.0418C2.43818%2015.9832%205.48182%2018%209%2018V18Z'%20fill='%2334A853'/%3e%3cpath%20fill-rule='evenodd'%20clip-rule='evenodd'%20d='M3.96409%2010.71C3.78409%2010.17%203.68182%209.59318%203.68182%209C3.68182%208.40682%203.78409%207.83%203.96409%207.29V4.95818H0.957273C0.347727%206.17318%200%207.54773%200%209C0%2010.4523%200.347727%2011.8268%200.957273%2013.0418L3.96409%2010.71V10.71Z'%20fill='%23FBBC05'/%3e%3cpath%20fill-rule='evenodd'%20clip-rule='evenodd'%20d='M9%203.57955C10.3214%203.57955%2011.5077%204.03364%2012.4405%204.92545L15.0218%202.34409C13.4632%200.891818%2011.4259%200%209%200C5.48182%200%202.43818%202.01682%200.957275%204.95818L3.96409%207.29C4.67182%205.16273%206.65591%203.57955%209%203.57955V3.57955Z'%20fill='%23EA4335'/%3e%3c/g%3e%3cdefs%3e%3cclipPath%20id='clip0_0_2849'%3e%3crect%20width='18'%20height='18'%20fill='white'/%3e%3c/clipPath%3e%3c/defs%3e%3c/svg%3e)
Make Beansprout your preferred source on Google
Add us on Google to see more of our insights in your search results
We compare CapitaLand Integrated Commercial Trust (CICT) and CapitaLand Ascendas REIT (CLAR) by looking at their performance and dividend yields.
What happened?
Singapore blue chip REITs continue to be in focus amongst investors seeking passive income.
We recently covered 3 Singapore blue chip REITs with dividend yields of above 5%, following their earnings releases.
These results highlighted how different REITs are taking varied approaches to growing income. Some have focused more on acquisitions to support longer-term distributions.
Back in 2025, several Singapore blue chip REITs were actively acquiring assets, with CapitaLand Integrated Commercial Trust (CICT) and CapitaLand Ascendas REIT (CLAR) among the more active acquirers during the year.
With both REITs now having reported their latest earnings, the comparison between the two REITs has come back into focus.
In this article, we take a closer look at how CapitaLand Integrated Commercial Trust and CapitaLand Ascendas REIT stack up heading into 2026.
Comparing CapitaLand Integrated Commercial Trust vs CapitaLand Ascendas REIT - Gross revenue and net property income
At the operating level, both REITs reported growth in gross revenue and net property income (NPI).
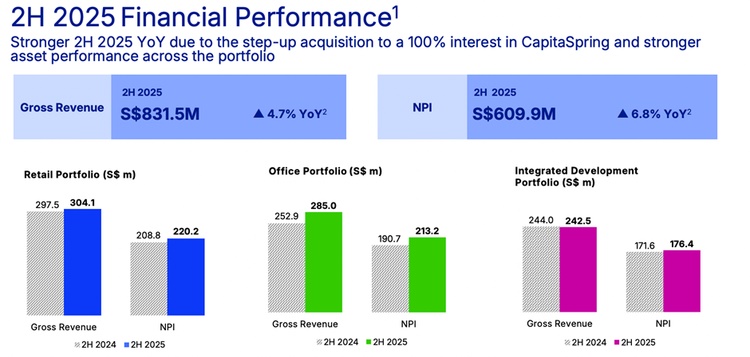
CICT delivered stronger momentum. In 2H 2025, gross revenue rose 4.7% year-on-year to S$831.5 million, while NPI increased 6.8% YoY to S$609.9 million.
For FY2025, CICT’s gross revenue grew 2.1% YoY to S$1.62 billion, and NPI rose 3.1% YoY to S$1.19 billion, supported by the step-up acquisition of CapitaSpring and stable asset performance.
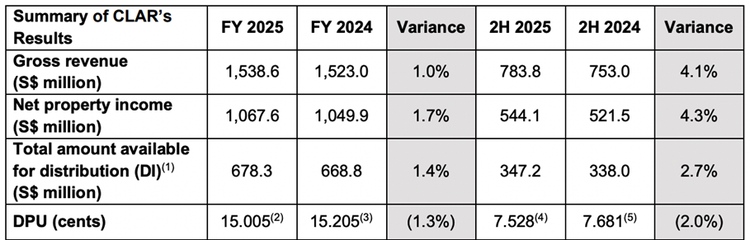
CLAR’s operating growth was more modest. For FY2025, gross revenue increased 1.0% YoY to S$1.54 billion, while NPI rose 1.7% YoY to S$1.07 billion.
On a half-year basis, CLAR’s 2H 2025 gross revenue and NPI rose 4.1% YoY and 4.3% YoY respectively, but this was partly offset by divestments and weaker contributions from Singapore and the UK.
Comparing CapitaLand Integrated Commercial Trust vs CapitaLand Ascendas REIT - Occupancy rates and portfolio performance
CICT’s portfolio occupancy remained high at 96.9% as at end-2025, underpinned by strong performance across retail, office, and integrated developments. Retail assets were near full occupancy, while office occupancy remained above 95%.
This supported the 6.8% YoY increase in NPI in 2H 2025, providing a stable base for income growth.
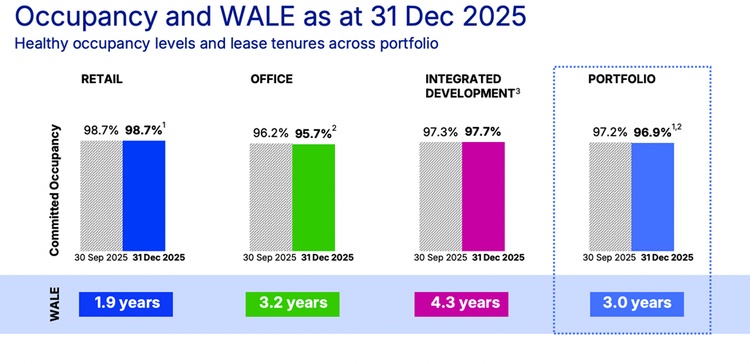
CLAR, on the other hand, saw portfolio occupancy decline to 90.9%. The weakness was mainly due to a logistics asset in the UK vacated ahead of redevelopment.
While management noted that occupancy would have been higher excluding this asset, the near-term impact on reported income was still visible.
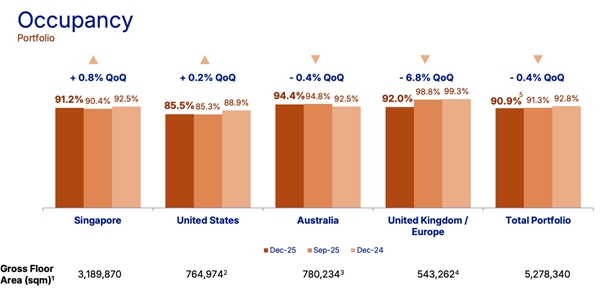
Overall, CICT currently appears to be operating from a position of stronger leasing momentum, while CLAR is navigating more transitional portfolio conditions.
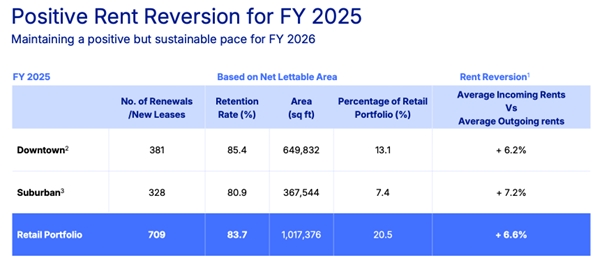
Comparing CapitaLand Integrated Commercial Trust vs CapitaLand Ascendas REIT - Rental reversions and income growth
Rental reversions highlight the difference in income visibility.
CICT continued to record positive rental reversions across its retail portfolio, with overall retail reversions of 6.6% in FY2025. Both downtown and suburban malls contributed, reflecting healthy tenant demand and sustained shopper traffic.
Office rents in Singapore also showed signs of recovery, with average rents edging higher year-on-year.
CLAR’s rental reversions remained positive and accelerated in late 2025, reaching close to 20% for the portfolio in 4Q 2025.
However, management guided that rental reversions are expected to moderate to mid-single-digit levels in FY2026, suggesting that the pace of rental-driven income growth may slow.
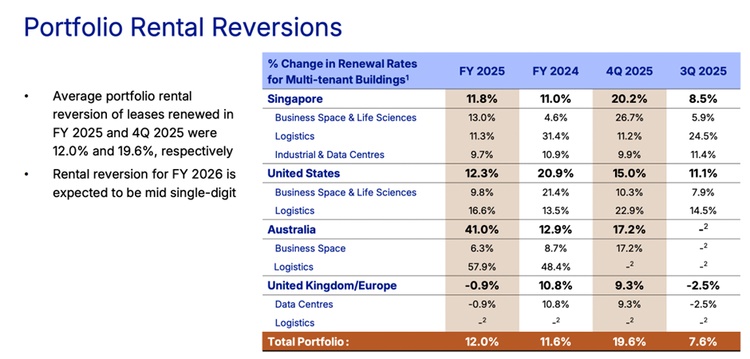
While CLAR has enjoyed stronger recent rental uplift, CICT’s rental performance appears steadier and more predictable at this stage of the cycle.
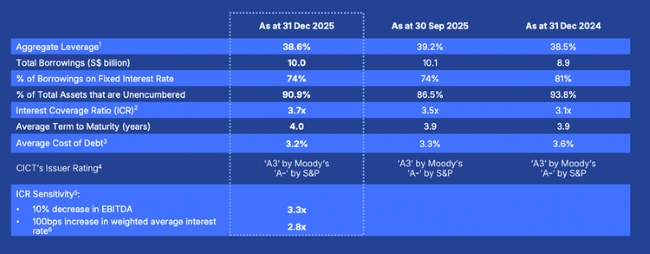
Comparing CapitaLand Integrated Commercial Trustvs CapitaLand Ascendas REIT - Balance sheets
Balance sheet strength remains important for sustaining distributions and managing funding costs.
Starting with CICT, its balance sheet remains healthy and conservatively positioned.
As at 31 December 2025, CICT’s aggregate leverage stood at 38.6%, down from 39.2% as at 30 September 2025, representing a 0.6% QoQ decline.
Its interest coverage ratio was 3.7 times, which remains comfortable.
Importantly, CICT’s average cost of debt declined to 3.2%, from 3.6% a year earlier, a 0.4% YoY reduction, helped by lower interest rates and proactive debt management.
Together with improving asset performance, this reduction in borrowing costs helped support distributable income.
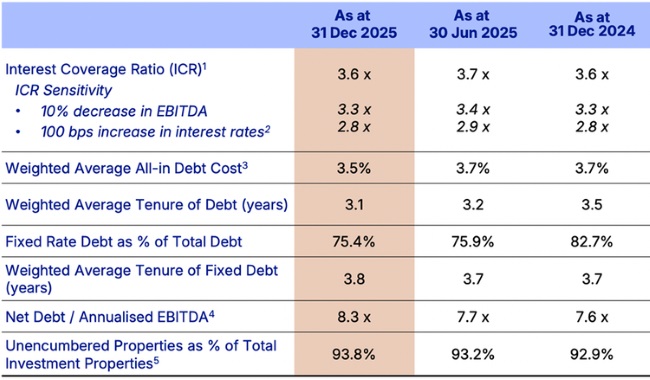
Turning to CLAR, its balance sheet metrics show a slight increase in leverage.
Aggregate leverage rose to around 39%, up from levels seen in June 2025 and at end-2024.
While this remains within a comfortable range, it indicates that recent acquisitions and portfolio reshaping have added incremental leverage.
CLAR also benefited from lower borrowing costs, although the improvement was less pronounced than CICT’s.
The weighted average cost of debt declined to about 3.5%, from 3.7%, as at 31 December 2025.
While this easing helps to partially offset higher leverage, the overall balance sheet profile remains more complex due to CLAR’s larger overseas exposure and more active capital recycling strategy.
Comparing CapitaLand Integrated Commercial Trust vs CapitaLand Ascendas REIT - How have acquisitions and divestments affected their income?
Capital management decisions played a meaningful role in shaping outcomes for both REITs.
CICT’s DPU growth was supported by the step-up acquisition to full ownership of CapitaSpring, which lifted office income. This was complemented by steady organic performance across the rest of the portfolio.
CICT has also been selective in recycling capital, balancing divestments and acquisitions without materially diluting distributions.
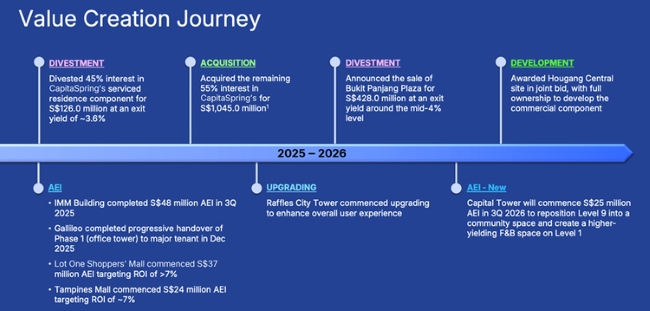
CLAR was more active in capital recycling. In FY2025, it completed S$1.47 billion of acquisitions which expanded its Singapore portfolio and S$506.5 million of divestments, all at premiums to valuation.
While these moves improve long-term flexibility, divestments reduce near-term income unless proceeds are quickly redeployed. Combined with equity fund-raising, this weighed on DPU.
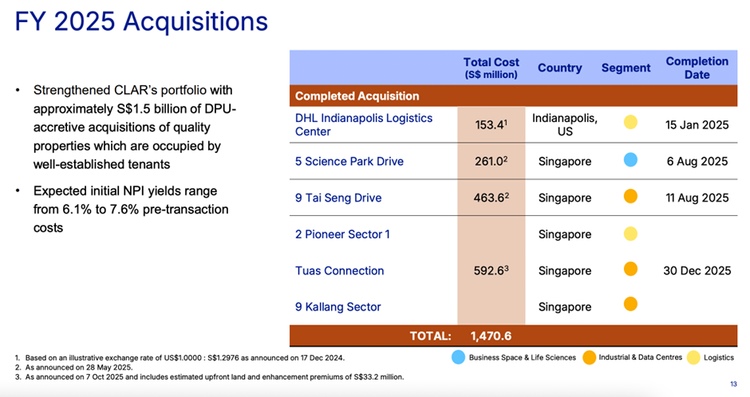
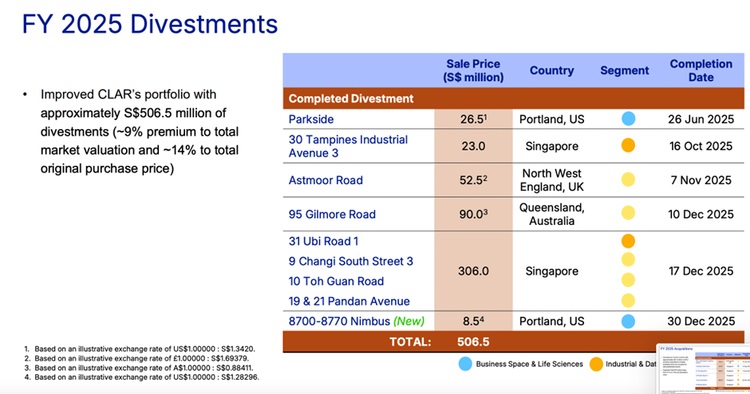
As a result, CICT’s capital actions supported DPU growth, while CLAR’s capital recycling diluted distributions in the short term.
Comparing CapitaLand Integrated Commercial Trust vs CapitaLand Ascendas REIT - Dividend yield and DPU trends?
The divergence between CICT and CLAR is most apparent when looking at distribution per unit (DPU) trends alongside headline dividend yield.
Starting with CapitaLand Integrated Commercial Trust (CICT), the REIT delivered clear DPU growth in its latest results.
For 2H 2025, CICT’s DPU increased 9.4% year-on-year to 5.96 cents, while FY2025 DPU rose 6.4% YoY to 11.58 cents, despite an enlarged unit base following equity fund-raising.
Based on FY2025 distributions and CICT’s unit price of S$2.47 as of 9 February 2026, CICT’s distribution yield stood at around 4.6%.
In contrast, CLAR continued to offer a higher headline yield, at approximately 5.3% based on CLAR’s unit price of S$2.82 as of 9 February 2026, but this came with weaker DPU momentum.
For 2H 2025, CLAR’s DPU declined 2.0% YoY to 7.528 cents, while FY2025 DPU fell 1.3% YoY to 15.005 cents, even though distributable income increased 1.4% YoY.
The decline reflects dilution from a larger unit base following acquisitions and capital recycling.
Putting the two together, CICT paired a growing DPU and a moderate, while CLAR offered a higher yield but declining DPU.
What would Beansprout do?
| Factor | CapitaLand Integrated Commercial Trust (CICT) | CapitaLand Ascendas REIT (CLAR) |
| Gross revenue growth (FY2025) | +2.1% YoY | +1.0% YoY |
| NPI growth (FY2025) | +3.1% YoY | +1.7% YoY |
| Portfolio occupancy (FY 2025) | 96.90% | 90.90% |
| Rental reversions (FY 2025) | 6.60% | 12.00% |
| DPU trend | +6.4% YoY | -1.3% YoY |
| Distribution yield | ~4.6% | ~5.3% |
| Interest Coverage Ratio (as at 31 December 2025) | 3.7x | 3.6x |
| Source: Company Data as of 9 February 2026 | ||
The choice between CICT and CLAR comes down to income stability versus headline yield.
CICT’s recent DPU growth, supported by acquisitions, strong occupancy across its retail and office portfolio, and positive rental reversions, suggests a resilient income profile.
Although CICT offers a lower dividend yield of 4.6%, this may appeal to investors who prioritise consistency and sustainability of distributions.
On the other hand, CLAR continues to offer a higher dividend yield of 5.3% and broader geographical diversification. However, its recent DPU decline highlights the impact of dilution, divestments, and softer occupancy in certain markets.
Looking ahead into 2026, we expect Singapore REITs to benefit from falling interest rates.
Within the sector, we favour REITs that can sustain and grow distributions through active portfolio management, such as asset enhancements, selective acquisitions, or rental reversion opportunities.
To screen for Singapore REITs with lowest price-to-book valuation or highest dividend yield, check out our best Singapore REIT screener.
You can find out what may drive further potential upside in Singapore stocks here.
If you are new to investing in Singapore REITs, you can start to learn more about Singapore REITs here.
If you prefer diversification without picking individual REITs, you can also gain exposure through Singapore REIT ETFs.
Lastly, you can also check out Beansprout's guide to the best stock trading platforms in Singapore with the latest promotions to invest in REITs.
Related links:
- CapitaLand Integrated Commercial Trust (SGX: C38U) share price history and share price target
- CapitaLand Integrated Commercial Trust (SGX: C38U) dividend forecast and dividend yield
- CapitaLand Ascendas REIT (SGX: A17U) share price history and share price target
- CapitaLand Ascendas REIT (SGX: A17U) dividend forecast and dividend yield
Follow us on Telegram, Youtube, Facebook and Instagram to get the latest financial insights.
Read also
Gain financial insights in minutes
Subscribe to our free weekly newsletter for more insights to grow your wealth
Most Popular

Comments
0 comments