DBS, UOB and OCBC in focus: Weekly Review with SIAS
Stocks
Powered by
By Gerald Wong, CFA • 09 Mar 2026
Why trust Beansprout? We’ve been awarded Best Investment Website at the SIAS Investors’ Choice Awards 2025
'%3e%3cpath%20fill-rule='evenodd'%20clip-rule='evenodd'%20d='M17.64%209.20455C17.64%208.56637%2017.5827%207.95273%2017.4764%207.36364H9V10.845H13.8436C13.635%2011.97%2013.0009%2012.9232%2012.0477%2013.5614V15.8195H14.9564C16.6582%2014.2527%2017.64%2011.9455%2017.64%209.20455V9.20455Z'%20fill='%234285F4'/%3e%3cpath%20fill-rule='evenodd'%20clip-rule='evenodd'%20d='M9%2018C11.43%2018%2013.4673%2017.1941%2014.9564%2015.8195L12.0477%2013.5614C11.2418%2014.1014%2010.2109%2014.4205%209%2014.4205C6.65591%2014.4205%204.67182%2012.8373%203.96409%2010.71H0.957275V13.0418C2.43818%2015.9832%205.48182%2018%209%2018V18Z'%20fill='%2334A853'/%3e%3cpath%20fill-rule='evenodd'%20clip-rule='evenodd'%20d='M3.96409%2010.71C3.78409%2010.17%203.68182%209.59318%203.68182%209C3.68182%208.40682%203.78409%207.83%203.96409%207.29V4.95818H0.957273C0.347727%206.17318%200%207.54773%200%209C0%2010.4523%200.347727%2011.8268%200.957273%2013.0418L3.96409%2010.71V10.71Z'%20fill='%23FBBC05'/%3e%3cpath%20fill-rule='evenodd'%20clip-rule='evenodd'%20d='M9%203.57955C10.3214%203.57955%2011.5077%204.03364%2012.4405%204.92545L15.0218%202.34409C13.4632%200.891818%2011.4259%200%209%200C5.48182%200%202.43818%202.01682%200.957275%204.95818L3.96409%207.29C4.67182%205.16273%206.65591%203.57955%209%203.57955V3.57955Z'%20fill='%23EA4335'/%3e%3c/g%3e%3cdefs%3e%3cclipPath%20id='clip0_0_2849'%3e%3crect%20width='18'%20height='18'%20fill='white'/%3e%3c/clipPath%3e%3c/defs%3e%3c/svg%3e)
Make Beansprout your preferred source on Google
Add us on Google to see more of our insights in your search results
We share about Singapore banks in the latest Weekly Market Review.

What happened?
In this week's Weekly Market Review in partnership with Securities Investors Association Singapore (SIAS), we discuss key developments in the global equity market alongside DBS, UOB and OCBC.
Watch the video to learn more about what we are looking out for this week.
Weekly Market Review
1:33 - Macro Update
- Escalating Middle East conflict drove severe global sell-offs. The S&P 500 fell 2%, erasing its year-to-date gains, while the Dow dropped 3%. Locally, the STI fell 3% last week, plunging a further 2.75% on Monday morning toward the 4,000 level.
- The Middle East conflict escalated rapidly over the weekend. Consequently, crude oil prices, which had already risen 20% to $70 earlier this year, spiked to $93 last Friday and surged past $100 per barrel at Monday's open.
- Unlike typical crises where investors rush to US government bonds and drive yields down, US bond yields are currently rising. The oil price shock has reignited fears of sticky inflation, potentially derailing the Federal Reserve's rate cut plans.
- The US unexpectedly shed 92,000 jobs in February, badly missing the 59,000 anticipated additions. Coupled with rising oil prices, this ignited "stagflation" fears and pushed Fed rate cut expectations back to at least July.
- ST Engineering emerged as a standout winner, jumping 10% over the past week. Investors flocked to the stock, viewing it as a primary aerospace and defence pure-play within Asia amidst the escalating Middle East conflict.
- Conversely, transport and aviation stocks bore the brunt of the sell-down due to fears that surging oil prices will crush profit margins and impact air travel demand. SIA and SATS both plummeted 7%. City Developments also dropped 7% as investors locked in profits from its strong run over the past year.
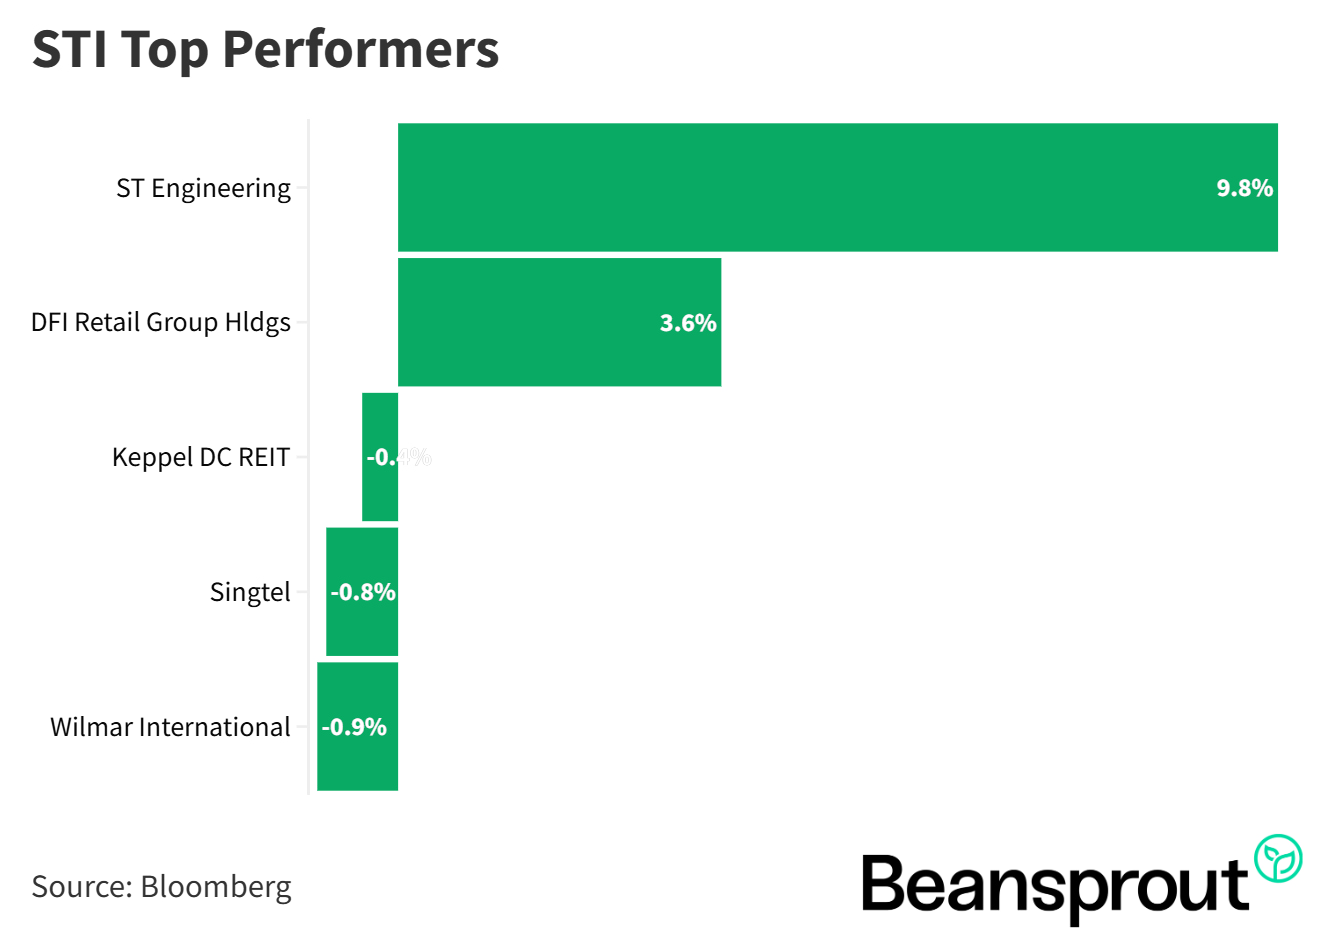
STI Top Performers:
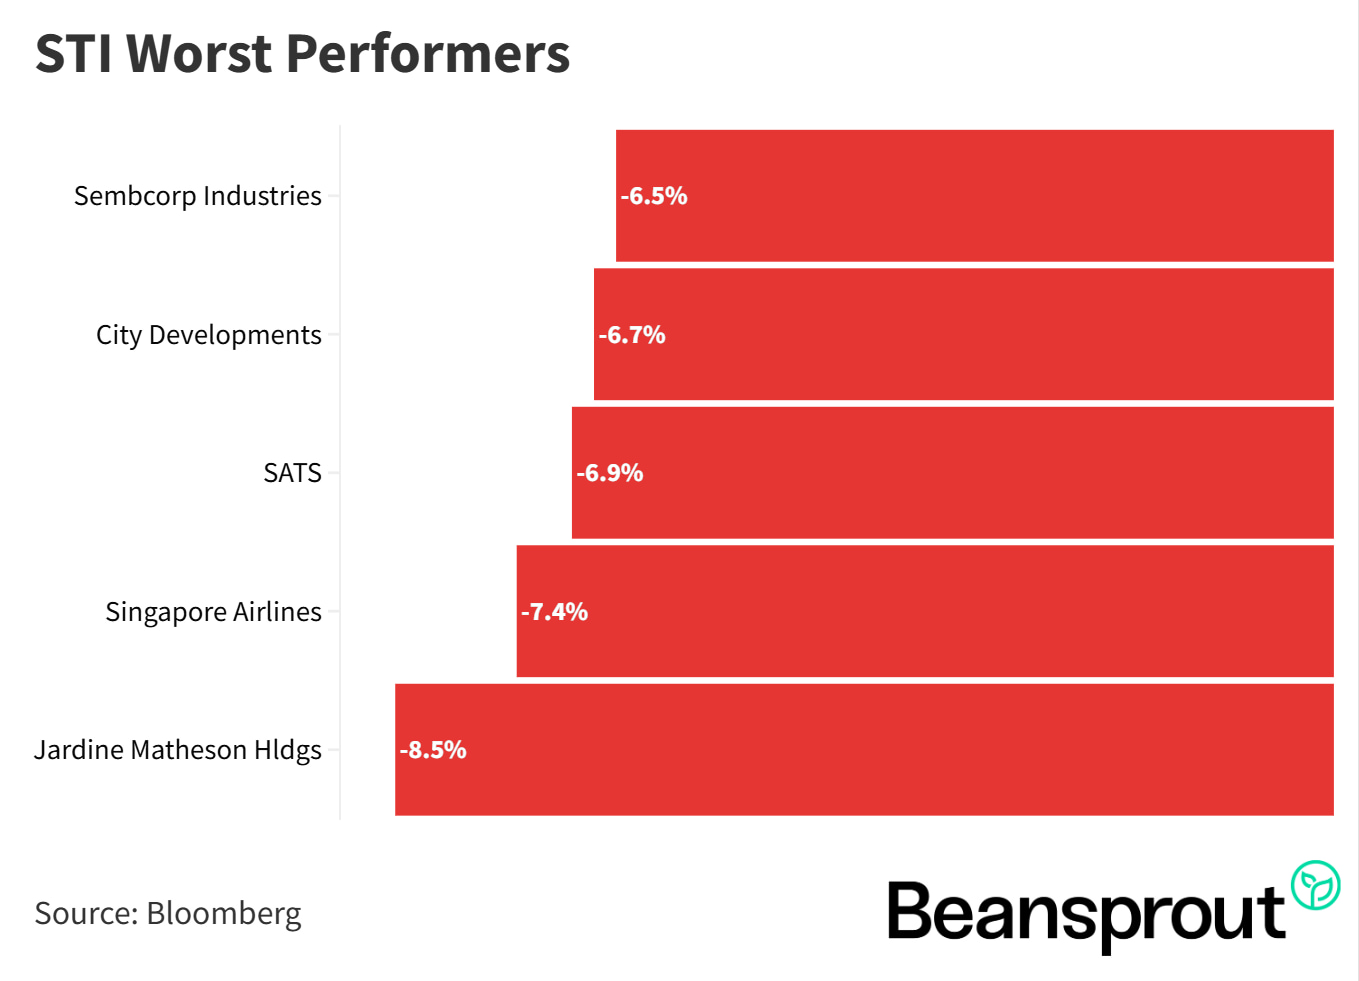
STI Worst Performers:
Singapore Banks in Focus: DBS, OCBC and UOB
- Q4 2025 results signaled a pause in Singapore banks' strong multi-year earnings growth, driven primarily by a decline in net interest income. As a result, OCBC was the only local bank to report year-on-year net profit growth, while DBS and UOB both posted declines.
- All three banks suffered from lower Net Interest Income (NII) due to compressing Net Interest Margins (NIM) year-on-year. However, on a quarter-on-quarter basis, NIMs for UOB and OCBC are showing signs of stabilization. Crucially, strong growth in wealth management fees and higher Assets Under Management (AUM) helped offset the interest income declines.
- Non-performing loans remain very contained (DBS at 1%, OCBC at 0.9%, UOB at 1.5%), though any severe economic deterioration stemming from the current geopolitical crisis could threaten these levels.
- Singapore banks continues to offer highly attractive dividend yields ranging between 4.7% and 5.9%. DBS increased its total dividends year-over-year, UOB dividends coming down more sharply, and OCBC saw a slight overall decrease.
- Although the sector has experienced mixed earnings, DBS remains the standout pick for income investors by offering the highest potential yield and clearest dividend visibility based on Q42025 results.
Read also: DBS offers 5.9% dividend yield. Better buy than UOB and OCBC after the recent dip?
Related Links:
- DBS Share Price and Share Price Target
- DBS forecast and dividend history
- OCBC Share Price and Share Price Target
- OCBC forecast and dividend history
- UOB Share Price and Share Price Target
- UOB forecast and dividend history
Technical Analysis
Straits Times Index
- The index suffered a sharp breakdown, falling below its long-term uptrend line established during the tariff war in April of last year.
- Monday morning's massive 130-point (2.75%) drop brings the index perilously close to the 4,000 level. The next critical technical support rests at 4,575, which is the November high acting as new support.
- Momentum is severely bearish: the RSI has plunged to 33 and is expected to dip into deep oversold territory below 30 this week for a potential technical rebound around the 4,500 to 4,600 levels.
- Meanwhile, the MACD negative divergence has expanded below the zero baseline, signaling potential further near-term downside toward 4,500.
Dow Jones Industrial Average
- The sell-off has continued relentlessly, dragging the index down to a close of 47,500 last Friday.
- Technical indicators confirm the weakness, with the MACD and its signal line both crossing below the zero baseline. The RSI is rapidly approaching the 30-point oversold mark.
- If the index falls another 1,000 to 2,000 points, it will test a crucial double-bottom support zone located around 45,600 to 45,700, representing the September and November lows.
- Despite the heavy selling pressure, some bargain hunting and dip buying were observed when the index briefly touched the 47,000 handle last Friday, showing attempts to pick the market bottom.
S&P 500
- The broad market index has wiped out its 2026 gains, closing at 6,740 after briefly touching the year-to-date low of 6,711.
- With the RSI reading at a weak 38 and the MACD expanding negatively below zero, downside momentum remains dominant.
- Expectations point to a further 100 to 200-point decline toward the next major support level of 6,521 established in November.
- A technical rebound is unlikely to occur until the RSI indicator drops further to hit the 30-point oversold mark.
Nasdaq Composite Index
- The tech index attempted a minor rebound late last week to close at 22,387, but devastating payroll data and war rhetoric crushed the recovery.
- It is currently on the verge of breaking the critical October support level at 22,200.
- Indicators have flipped firmly bearish, with the RSI breaking below 50 (sitting at 40 now) and the MACD turning negative.
- A break of current support targets a further slide down to the November low of 21,800, representing a potential 500 to 600-point drop. We will need to see a convincing rebound of the MACD above its signal line to conclude the bottom is in.
What to look out for this week
Monday, 9 March 2026: BHG Retail REIT ex-dividend
Tuesday, 10 March 2026: Lendlease REIT preferential offering opens
Wednesday. 11 March 2026: US Consumer Price Index (CPI) data
Thursday, 12 March 2026: Singapore 6 month Singapore T-bill Auction
Friday, 13 March 2026: US PCE Price Index data
Get the full list of stocks with upcoming dividends here.
Follow us on Telegram, Youtube, Facebook and Instagram to get the latest financial insights.
Read also
Gain financial insights in minutes
Subscribe to our free weekly newsletter for more insights to grow your wealth
Most Popular

Comments
0 comments