
Singapore REITs: Stronger distributions meet renewed rate uncertainty
REITs
By Gerald Wong, CFA • 09 Sep 2026
Why trust Beansprout? We’ve been awarded Best Investment Website at the SIAS Investors’ Choice Awards 2025
'%3e%3cpath%20fill-rule='evenodd'%20clip-rule='evenodd'%20d='M17.64%209.20455C17.64%208.56637%2017.5827%207.95273%2017.4764%207.36364H9V10.845H13.8436C13.635%2011.97%2013.0009%2012.9232%2012.0477%2013.5614V15.8195H14.9564C16.6582%2014.2527%2017.64%2011.9455%2017.64%209.20455V9.20455Z'%20fill='%234285F4'/%3e%3cpath%20fill-rule='evenodd'%20clip-rule='evenodd'%20d='M9%2018C11.43%2018%2013.4673%2017.1941%2014.9564%2015.8195L12.0477%2013.5614C11.2418%2014.1014%2010.2109%2014.4205%209%2014.4205C6.65591%2014.4205%204.67182%2012.8373%203.96409%2010.71H0.957275V13.0418C2.43818%2015.9832%205.48182%2018%209%2018V18Z'%20fill='%2334A853'/%3e%3cpath%20fill-rule='evenodd'%20clip-rule='evenodd'%20d='M3.96409%2010.71C3.78409%2010.17%203.68182%209.59318%203.68182%209C3.68182%208.40682%203.78409%207.83%203.96409%207.29V4.95818H0.957273C0.347727%206.17318%200%207.54773%200%209C0%2010.4523%200.347727%2011.8268%200.957273%2013.0418L3.96409%2010.71V10.71Z'%20fill='%23FBBC05'/%3e%3cpath%20fill-rule='evenodd'%20clip-rule='evenodd'%20d='M9%203.57955C10.3214%203.57955%2011.5077%204.03364%2012.4405%204.92545L15.0218%202.34409C13.4632%200.891818%2011.4259%200%209%200C5.48182%200%202.43818%202.01682%200.957275%204.95818L3.96409%207.29C4.67182%205.16273%206.65591%203.57955%209%203.57955V3.57955Z'%20fill='%23EA4335'/%3e%3c/g%3e%3cdefs%3e%3cclipPath%20id='clip0_0_2849'%3e%3crect%20width='18'%20height='18'%20fill='white'/%3e%3c/clipPath%3e%3c/defs%3e%3c/svg%3e)
Make Beansprout your preferred source on Google
Add us on Google to see more of our insights in your search results
Singapore's underlying property fundamentals have not deteriorated as REIT managers delivered distribution growth despite the higher-for-longer rate backdrop. But a renewed and unexpected hike would be a fresh headwind for yield-sensitive REIT prices, so near-term volatility looks likely to stay.

Singapore REITs have widened their gap with the broader market
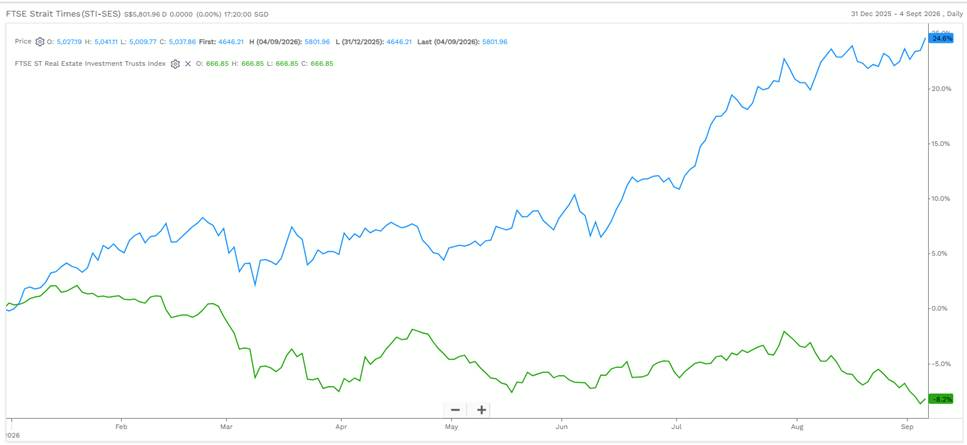
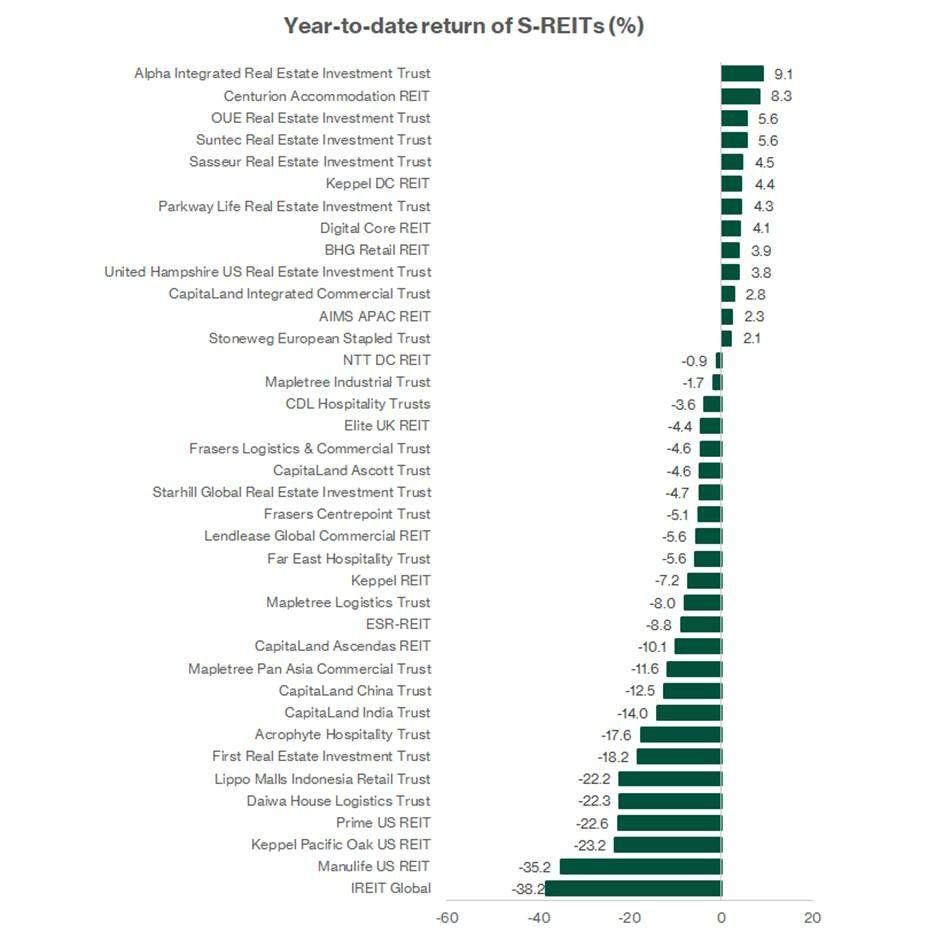
As at 4 September 2026, the FTSE ST All-Share REIT Index was down 8.2% year-to-date, compared with a 24.6% gain for the FTSE Straits Times Index.
The underperformance reflects a shift towards pricing in an upward trend in US interest rates. Markets had spent much of the first half of 2026 anticipating that the Fed's next move would be a cut. That narrative has now reversed.
That said, despite the spike in oil prices, the majority of the REITs posted healthy underlying operating performance.
Both factors matter for REITs, as they can affect borrowing costs, asset valuations, operating expenses and investor appetite for yield-sensitive stocks.
Markets are now expecting at least one rate hike by the end of 2026. This has led investors to reassess duration risk, especially for sectors like REITs that are sensitive to interest rates. Higher-for-longer interest rates and elevated energy costs have kept sentiment cautious towards the REIT sector.
|
Source: FactSet, 7 Sep 2026 |
Higher U.S. Treasury yields point to a Fed pivot from possible cut to possible hike
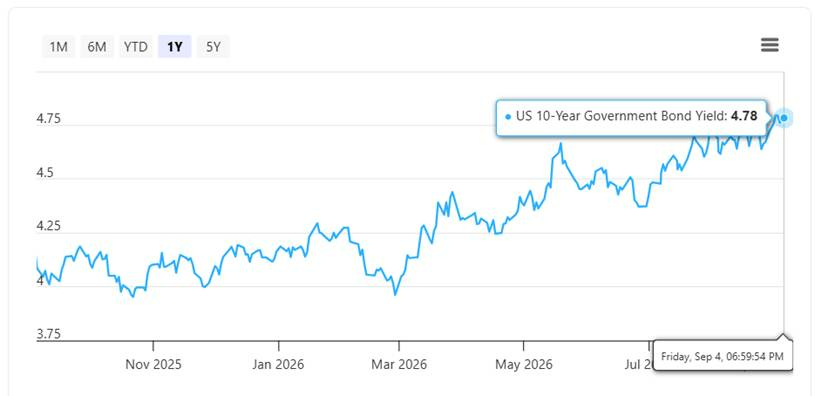
U.S. Treasury yields have moved higher as markets reassess the Fed’s policy path.
The Federal Reserve kept its benchmark rate unchanged at 3.50% to 3.75% at its July 2026 meeting, but the decision was far from unanimous, with three of the Fed's policymakers dissenting in favour of an immediate hike.
That split vote has left markets uneasy about the Fed's tolerance for near-term inflation, and JPMorgan Wealth Management strategists now expect a 25 basis point hike at the September meeting — a reversal from their earlier base case of no changes for the rest of 2026.
Futures markets are pricing in roughly a 60% probability of that September hike.
The main driver is energy. Oil prices have climbed towards the US$80 to US$120 per barrel range, largely on Iran-related disruption to shipping through the Strait of Hormuz, compounded by a slower-than-expected normalisation of global supply chains.
Markets are pricing in this hawkish shift. CME FedWatch data, as of 7 September 2026, shows a 60.4% probability of a 25 basis point hike at the 16 September meeting, with the probability of at least two hikes rising further by December.
This has pushed the U.S. 10-year Treasury yield towards 4.8%, with the yield at 4.78% as at 7 September 2026.
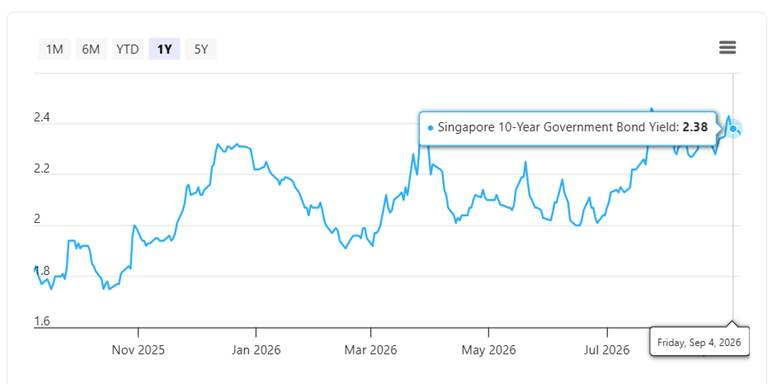
In Singapore, the domestic interest rates have been rising as well. The Singapore 10-year government bond yield stood at 2.38% as at 4 September 2026, up 0.53 percentage points over the past year.
For Singapore REITs, this matters because higher risk-free yields make REIT distributions less attractive on a relative basis. To maintain an attractive yield spread, REIT yields may need to rise, which usually means REIT prices come under pressure.
|
Source: Beansprout, 7 Sep 2026 |
|
Source: Beansprout, 7 Sep 2026 |
Is this still a buying opportunity for S-REITs?
The renewed rate uncertainty makes it harder to call a broad-based recovery in the S-REIT sector in the near term, in our view.
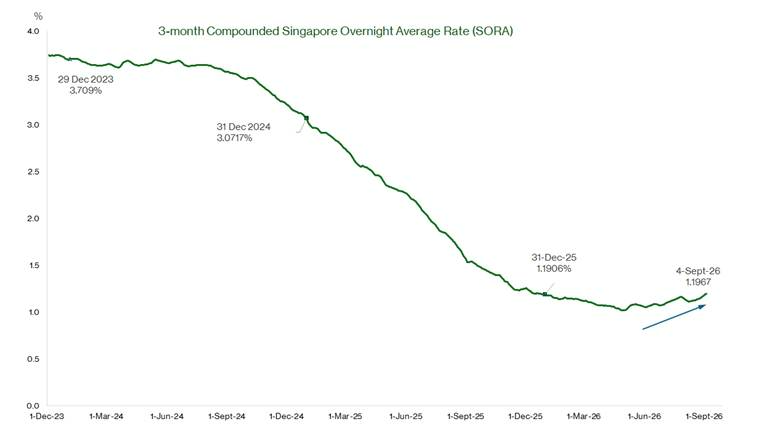
The three-month SORA has already ticked up to around 1.2% as at 4 September 2026, from about 1.0% at end-May. This matters because many REITs still have debt that needs to be refinanced or repriced over time.
If SORA continues to rise, interest expenses could increase again, putting pressure on distributable income and distribution per unit.
|
Source: Monetary Authority of Singapore |
That said, the operating picture reported this results season was considerably better than the share price performance would suggest. Singapore's office, retail and industrial rental markets continued to strengthen through the second quarter, and the majority of REITs we tracked grew their distributions year-on-year, several by double digits.
Selectivity still matters more than ever. REITs backed by structurally supported Singapore demand — offices, logistics, data centres and worker or student accommodation — again delivered some of the strongest growth this quarter.
REITs facing segment-specific headwinds, such as US data-centre lease non-renewals or a weaker Japanese yen, had a tougher time regardless of the broader rate backdrop.
Data centre REITs stay in growth mode
Data centre REITs continue to be among the more resilient parts of the S-REIT sector, supported by structural undersupply in key markets and continued demand from cloud, AI and enterprise customers.
Keppel DC REIT's 1H26 results extended its run of consistent growth. Gross revenue climbed 14.5% year-on-year to S$242.0 million, partly driven by positive rental reversion of 10%. Net property income increased 15.1% to S$210.4 million.
Keppel DC REIT’s 1H26 distributable income rose 18.5% year-on-year to S$150.7 million. DPU grew 11.3% to 5.714 cents. Growth was also driven inorganically by the acquisition of Tokyo Data Centre 3 and an increased effective interest in Keppel DC Singapore 3 & 4.
The balance sheet stayed conservative. Aggregate leverage improved 110 basis points to 34.0%, leaving S$673 million of debt headroom. 1H26 cost of debt was at 2.6%, among the lowest in the REIT space. Interest coverage was 6.9x, slightly lower compared to 7.2x as at 31 March 2026.
Portfolio metrics softened slightly quarter-on-quarter. Occupancy eased to 92.5% from 95.6% in 1Q2026. Contracted power capacity was stable, at 95%. WALE extended to 6.7 years, from 6.5 years in 1Q26. Finance costs increased 25.2% year-on-year to S$30.7 million due to acquisition loans drawn in 4Q2025.
Keppel DC REIT continues to point to structural tailwinds — global data centre demand is projected to grow at a 25% CAGR to 256GW by 2030 — as it evaluates further hyperscale opportunities in Singapore, Japan, South Korea and Europe.
Digital Core REIT reported 1H26 gross revenue declined 0.4% year-on-year to US$88.6 million. The decline was due to the redevelopment of Linton Hall. Net property income (NPI) fell 5.7% to US$43.7 million. DPU was unchanged year-on-year at 1.80 US cents, translating to a forward distribution yield of about 7.4%.
Away from Linton Hall, the picture was healthy. Portfolio occupancy improved 20 basis points quarter-on-quarter to 97.3%, with Northern Virginia, Silicon Valley and Toronto fully occupied. Rental reversions came in at a strong 25% on new and renewed leases. Gearing edged up 20 basis points quarter-on-quarter to 39.2%. All-in cost of debt was 3.6%, relatively stable, marginally higher by 10 bps quarter-on-quarter. Interest coverage ratio remains strong, at 3.2x.
Linton Hall’s redevelopment remains on track for completion in December 2026. It has secured a ten-year lease with an investment-grade global cloud customer. The asset is poised to generate about 35% higher net rent than the previous lease. Moreover, it will significantly extend portfolio weighted average lease expiry to about 5.3 years.
NTT DC REIT, which only listed more recently, delivered an even stronger set of numbers. First-quarter FY2026/27 distributable income of US$22.6 million beat its own IPO prospectus projection by 10.6%, even as gross revenue of US$58.1 million came in slightly below projection; lower real estate taxes, operating expenses and finance costs, together with favourable foreign exchange movements, more than made up the difference.
Portfolio occupancy rose 0.8 percentage points quarter-on-quarter to 95.9%, with committed occupancy — including leases signed but not yet commenced — reaching 99.2%. Rental reversions were a robust 13.4%, led by a 23% uplift on the renewal of the SG1 NTT Master Services Agreement. Aggregate leverage rose to 31.0% from 29.2% as debt increased to fund growth, though the cost of debt eased slightly to 3.98% and interest cover improved to 4.7x.
Data centre REITs continue to offer some of the clearest structural growth stories in the S-REIT sector, even as individual results can be lumpy around redevelopment and ramp-up phases.
Industrial and logistics REITs: Singapore holds firm
Industrial and logistics assets are fairly resilient.
CapitaLand Ascendas REIT's (CLAR) reported gross revenue of S$805.5 million, up 6.7% year-on-year. NPI grew 6.2% to S$556.1 million in 1H26. CLAR completed several acquisitions across Singapore, Europe, the US and Japan, with close to S$1.8 billion of acquisitions in 1H26 alone.
Distributable income increased 8.6% year-on-year to S$359.4 million. DPU was broadly stable at 7.482 Scts, up 0.1% year-on-year. DPU decreased by 0.8% quarter-on-quarter, led by an enlarged unit base from an April 2026 equity raise.
CLAR reported rental reversions at 8.5% in 1H26. New leases at 27 International Business Park were signed at around S$5.00 per square foot, well above surrounding market rents of about S$3.50 psf. Occupancy dipped to 89.1% from 90.5%, largely because newly completed redevelopments such as Geneo and 27 IBP are still in their initial lease-up phase. Excluding these two assets which completed in 2Q26, occupancy was broadly stable near 90.3%.
Aggregate leverage improved 2.3 percentage points to 39.7% after the equity raise, with cost of debt stable at 3.5%. CLAR completed or announced close to S$1.8 billion of acquisitions in 1H26 alone.
Mapletree Industrial Trust’s (MINT) 1QFY27 gross revenue fell 7.7% year-on-year to S$162.3 million. NPI decreased 8.5% year-on-year to S$122.3 million in 1QFY27. The weaker 1QFY27 performance largely reflected the loss of income from three divested Singapore properties, North American lease non-renewals and a weaker US dollar. DPU fell 4.9% year-on-year to 3.11 cents, though it improved slightly quarter-on-quarter.
Gearing rose to 37.5% from 34.0%. Management is targeting S$500 million to S$600 million of divestments under its North American asset-recycling programme.
MINT’s Singapore assets remained the bright spot within the portfolio. Its Singapore portfolio reported occupancy up 0.9 percentage points to 94.3%. The Singapore portfolio had rental reversions of 5.3% in 1H26.
North American occupancy fell 3.6 percentage points to 82.5%. There were pockets of encouraging news even in North America: a five-year lease extension at Sunnyvale Data Centre was signed at around a 20% rental reversion, and a new lease at Hawthorne Data Centre secured a high-single-digit reversion, with both due to start contributing from the third quarter of FY2026/27.
Mapletree Logistics Trust (MLT) delivered 1QFY27 gross revenue at S$178.9 million, up 0.8% year-on-year. NPI grew 2.0% year-on-year to S$156.4 million, helped by a full quarter's contribution from its India acquisition and the newly completed Mapletree Joo Koon Logistics Hub.
MLT’s DPU edged up 0.2% year-on-year to 1.816 cents. Portfolio rental reversion moderated to 0.9% from 3.3% in 4QFY26. Assets in China continued to stabilise, with rental reversion improving to -1.8% from -2.0% in 4QFY26. Excluding China, MLT achieved stronger rental reversion in 1QFY27, at 2.3%.
Gearing was stable at 40.5%, with management targeting up to S$300 million of divestments this financial year to redeploy into higher-growth Vietnam, Malaysia and India. Post 1QFY27, MLT announced divestments in China and Singapore, totalling about S$155 million.
Daiwa House Logistics Trust's (DHLT) overseas exposure proved a bigger drag. 1H26 gross revenue fell 11.8% year-on-year to S$25.7 million. NPI decreased 13.4% year-on-year to S$19.5 million. The weaker performance was due to the Japanese yen depreciating 9.6% against the Singapore dollar, as well as softer Japan portfolio occupancy.
DPU fell 18.8% to 1.82 cents. Gearing held stable at 40.1% with interest coverage ratio at 4.8x. Looking ahead, DHLT faces near-term pressure on distributions as refinancing is completed at higher interest rates.
Taken together, industrial and logistics REITs illustrate how much performance now depends on geographic mix. Singapore-anchored portfolios kept benefiting from a rental upcycle now in its sixth year, while REITs with meaningful North American, Japanese or Chinese exposure had a much tougher time navigating lease non-renewals, currency swings and market-specific vacancies.
Industrial data supports the resilience story
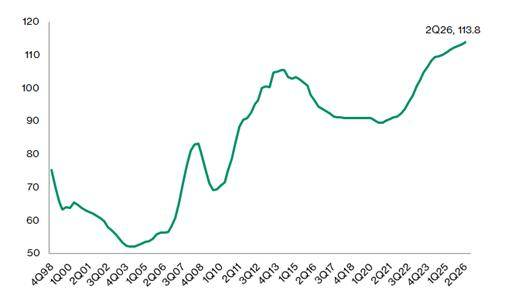
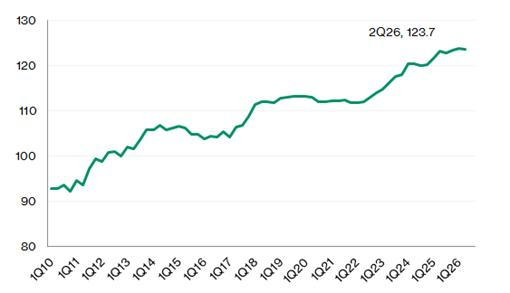
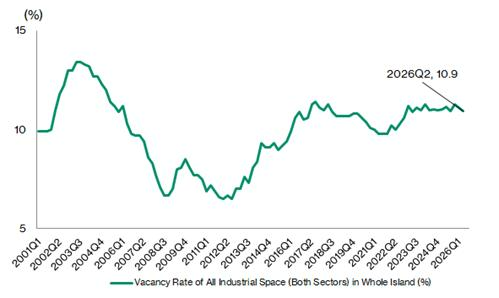
Singapore's industrial property market kept extending its multi-year upcycle in 2Q26. JTC's All Industrial Rental Index rose 0.5% quarter-on-quarter in 2Q26, marking its 23rd consecutive quarterly increase and pushing the index to its highest level since 2Q1996 — up 27.2% cumulatively since its pandemic-era trough.
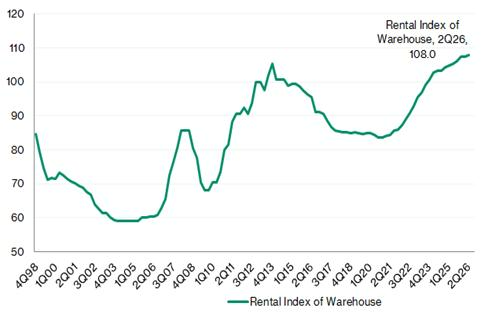
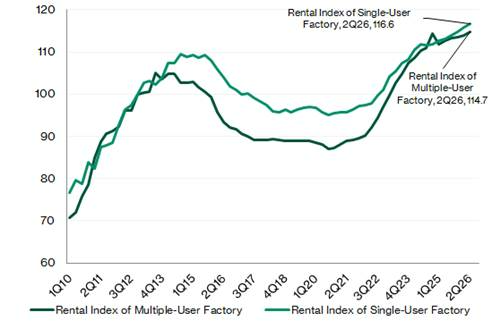
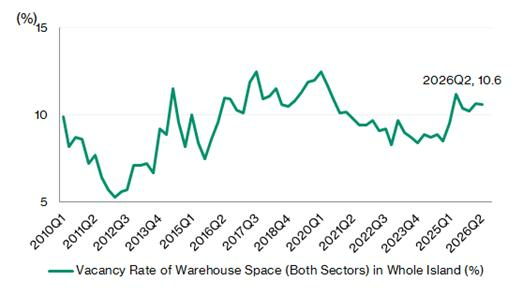
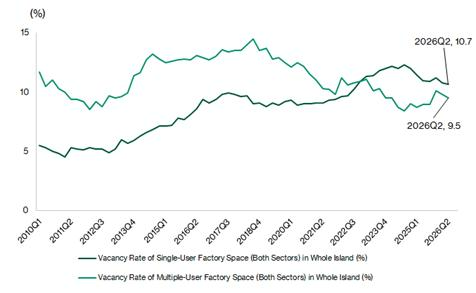
Rental growth was again led by single-user factories (+0.7% quarter-on-quarter, occupancy 89.3%) and multi-user factories (+0.6%, occupancy 90.5%). Warehouses reported rental growth of +0.5% quarter-on-quarter and occupancy of 89.4%.
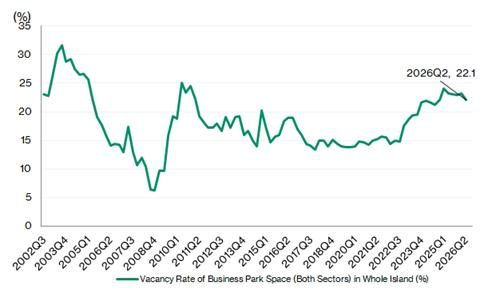
Business parks were the lone soft spot, with rents down 0.1%, even as occupancy there improved 1.2 percentage points to 77.9%.
The All Industrial Price Index rose 0.6% quarter-on-quarter and 3.8% year-on-year, and supply remains manageable, with about 4.4 million square feet — just 0.7% of existing stock — due for completion in the second half of 2026.
Rental index of all industrial property | Rental index of business park | |
|
| |
Source: JTC | Source: JTC | |
Rental index of warehouse |
Rental index of factories | |
|
| |
Source: JTC | Source: JTC | |
Vacancy rate of all industrial property | Vacancy rate of business park |
|
|
Source: JTC | Source: JTC |
| Vacancy rate of warehouse spaces | Vacancy rate of factory spaces |
|
|
Source: JTC | Source: JTC |
Retail REITs: Singapore holds up
Singapore holds up while China and business parks still adjusting.
Singapore's retail rental market firmed in 2Q26 after a soft patch.
URA's retail rental index rose 0.6% quarter-on-quarter in 2Q26, reversing the 0.6% decline registered in 1Q26. URA retail vacancies were broadly higher, with overall vacancy rising marginally to 6.5% in 2Q26 from 6.3% in 1Q26.
Retail space vacancy rates | Retail space rental index |
|
|
Source: URA | Source: URA |
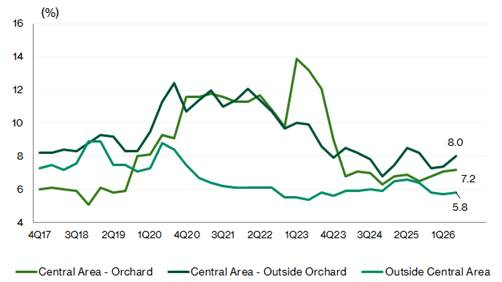
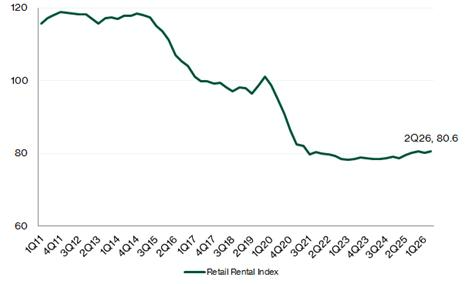
CapitaLand Integrated Commercial Trust's (CICT) results captured Singapore retail's continued resilience.
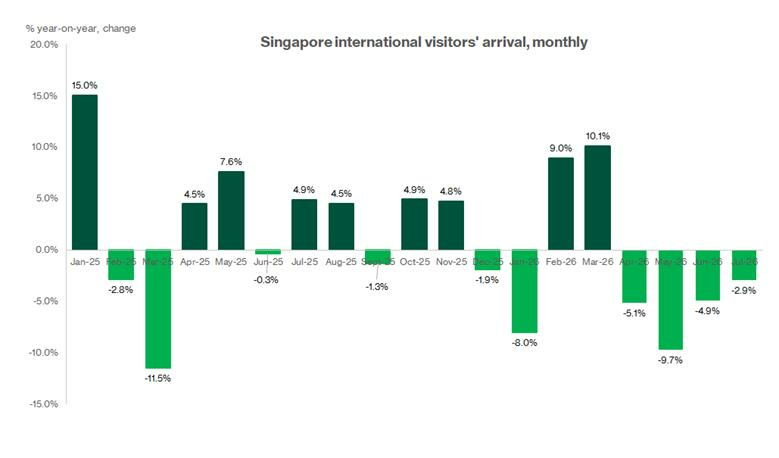
Portfolio DPU rose 7.1% year-on-year to 6.02 Scts in 1H26. Distributable income increased by a faster 13.3% to S$466.7 million. Retail occupancy stayed high at 97.7%, with rental reversions of 4.0%. Shopper traffic was up 2.4% year-on-year, even as tourist arrivals softened in the second quarter.
Tourist arrivals fell 6.6% year-on-year in 2Q26 as the Middle East conflict disrupted airfares and flight schedules. For 1H26, Singapore tourist arrivals declined 2.0% year-on-year to 8.2 million.
The S$3.9 billion Paragon acquisition was completed in July at a 3.9% net yield and will begin contributing from July 2026.
Other earnings contributors are ramp-up at Gallileo and an ongoing asset-enhancement pipeline spanning Tampines Mall, Lot One and the S$160 million Plaza Singapura/The Atrium@Orchard project.
CapitaLand China Trust (CLCT) reported 1H26 gross revenue at RMB822.6 million, down 5.2% year-on-year. On a same-store basis, excluding Yuhuating which was divested, revenue was roughly flat.
For 1H26, CLCT declared DPU of 2.45 Singapore cents, an increase of 2.9% year-on-year on a same-store basis. Management guided for a stable core DPU. CLCT is targeting to acquire a retail asset by end-2026, at around a 7% yield.
Aggregate leverage improved to 40.4% as at 30 June 2026, from 41.4% as at 31 March 2026.
Retail remains the main contributor, accounting for 70.7% of NPI. Occupancy remained healthy at 97.3%. Reflecting competition in the retail space, rental reversion came in at -2.7%. CLCT kept operations versatile, achieving growth in shopper traffic and tenant sales, up 3.2% and 2.6% respectively.
Business parks were the weaker segment, with occupancy down to 85.1%. Rental reversion was also negative, at -12.0%. On the other hand, the smaller logistics portfolio improved markedly, with reversion recovering to -1.2% from -20% in 2025.
Starhill Global REIT (SGREIT) reported full-year FY2025/26 results ending June. Revenue rose modestly by 0.2% year-on-year to S$192.5 million. DPU grew 0.8% year-on-year to 3.68 Singapore cents.
SGREIT’s Singapore portfolio is the main revenue contributor, at 61.5%. Revenue from the Singapore portfolio fell 1.3% year-on-year due to divestment of some strata units in Wisma Atria. Malaysia and Australia reported revenue growth of 0.5% and 7.6% year-on-year, respectively. Portfolio-wide occupancy rose to 97.2% from 94.6% a year earlier. Gearing stood at 35.8% with interest cover of 3.1x, comfortably above the sector average of 2.7x.
Lendlease Global Commercial REIT (LREIT) also reported FY2025/26 results for the year ended June. LREIT posted 2HFY2026 DPU growth of 3% year-on-year to 1.85 Scts, bringing full-year FY2026 DPU to 3.70 Scts, also up 3% year-on-year.
Retail rental reversion for the year came in at a strong 11.7%, and like-for-like tenant sales grew 4.0% (24.0% including the newly acquired PLQ Mall).
Aggregate leverage improved to 38.9% in FY26, from 42.6% in FY25. This was driven by the divestment of Jem's office component. Management flagged a pipeline of potential Sponsor-linked acquisitions including PLQ Office, Comcentre and Paya Lebar Green.
Across the retail sub-sector, Singapore's necessity-led, well-connected malls continued to hold rental power even as tourism tailwinds moderated. Overseas assets are showing modest improvement, as China and business-park-exposed portfolios remain works in progress.
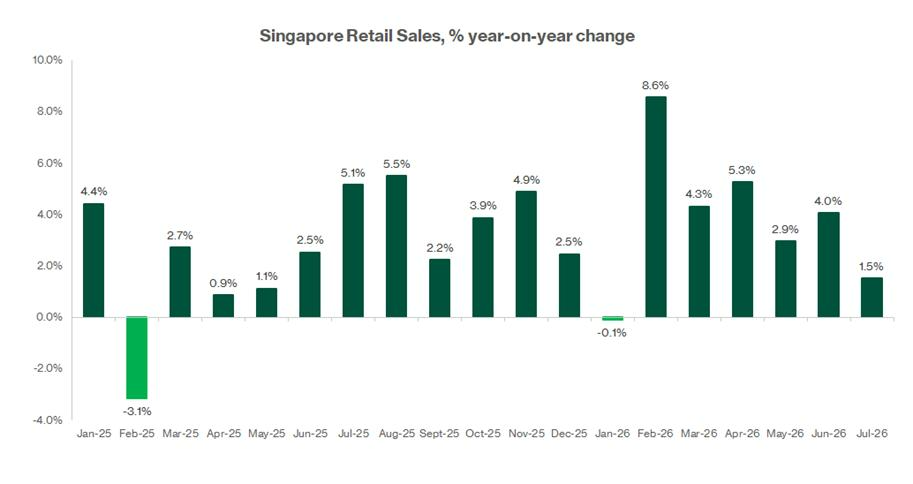
Singapore retail sales grew around 4% year-on-year in 2Q26, supported by resilient discretionary spending, particularly on recreational goods, watches and jewellery, and electronics.
CBRE is maintaining its forecast for 1% to 2% full-year retail rental growth, supported by a healthy MICE and concert calendar and limited new supply over the next three years.
While retail REITs remain supported by positive rental growth and limited supply, the reopening and tourism tailwind is becoming less powerful.
|
Source: Department of Statistics |
Office REITs ride a sixth straight quarter of rent growth
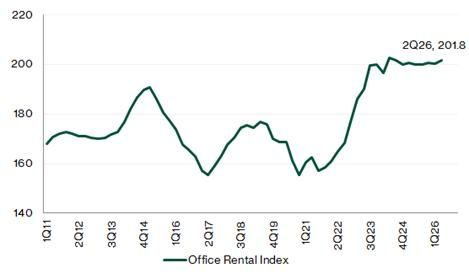
Singapore’s office market continued to strengthen in 2Q26. URA’s Central Region Office Rental Index rose 0.8% quarter-on-quarter, reversing the 0.2% decline in the previous quarter.
CBRE’s Core CBD Grade A rents also rose 0.8% quarter-on-quarter to S$12.50 per square foot per month. This marked the sixth consecutive quarter of rental growth, bringing cumulative growth for 1H26 to 1.6%.
Vacancy in the Core CBD Grade A market remained tight at a record-low 3.3%.
Colliers’ data also points to a stronger market, with CBD Grade A and Premium rents rising 1.9% quarter-on-quarter. This led Colliers to upgrade its full-year 2026 office rental growth forecast to 4% to 6%.
Islandwide office vacancy ticked up to 11.0%, from 10.8% in 1Q2026, mainly due to the completion of Shaw Tower, which added about 0.4 million square feet of new Downtown Core supply.
CBRE expects this to ease in 2H2026 as tenants complete their move-ins.
With Shaw Tower the only major office completion in 2026 and new supply expected to remain below average in 2027, the CBD office market should stay landlord-favourable.
Demand from financial services firms and AI companies taking dedicated space could continue to support rents.
Singapore office REITs remain supported by tight CBD vacancy, limited new supply and steady rental growth.
Office space vacancy rates, by type | Office space rental index |
|
|
Source: URA | Source: URA |
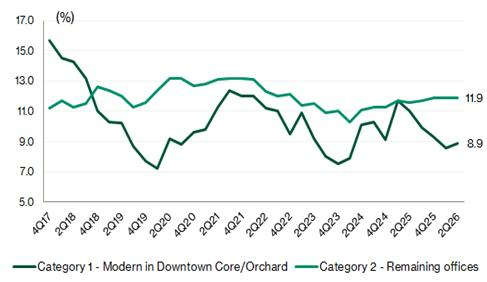
OUE REIT stands out on hospitality rebound and capital recycling. OUE REIT’s 1H26 results were among the stronger results reported by office-linked REITs.
OUE reported 1H26 DPU rose 28.6% year-on-year to 1.26 cents, supported by a recovery in hospitality income, capital recycling gains and lower financing costs. Revenue increased 3.8% to S$136.1 million, while net property income grew 4.8% to S$110.3 million.
Finance costs fell 16.6%, helped by proactive refinancing.
The Singapore office portfolio also remained resilient. Average passing rent rose 0.9% quarter-on-quarter to S$11.10 per square foot per month, while rental reversion came in at 4.7% in 2Q26.
OUE REIT also benefited from its 19.9% stake in Sydney’s Salesforce Tower, which contributed S$2.2 million in associate income.
Balance sheet metrics were stable. Aggregate leverage stood at 41.5%, while the weighted average cost of debt improved to 3.6%.
Management also announced a proposed S$500.0 million divestment of Crowne Plaza Changi Airport at a 4.3% exit yield and at a premium to valuation.
This forms part of its “Phase 3” value-crystallisation strategy. If completed, the divestment could free up about 5 percentage points of leverage headroom, giving OUE REIT more flexibility to pursue accretive acquisitions.
OUE REIT is benefiting from both stronger operating performance and active capital recycling, but investors should watch how management redeploys the divestment proceeds.
Suntec REIT delivered one of the sector's stronger prints. Distributable income rose 25.5% to S$116.5 million.
Suntec REIT’s 1H26 DPU jumped 24.8% year-on-year to 3.936 Scts, as lower financing costs and a strong Singapore office and retail portfolio more than offset a softer overseas showing.
Suntec City Office reached 100% committed occupancy and Suntec City Mall improved to 99.6%, with management guiding to around 5% office and close to 10% retail rental reversions for the full year.
Overseas, Australia's 177 Pacific Highway, 21 Harris Street and Olderfleet stayed fully occupied, though 55 Currie Street in Adelaide eased to 61.1%, while London's Minster Building remained Suntec REIT's weakest link at 85.4% occupancy following a 2025 tenant expiry.
A change in ownership of the REIT's manager was completed during the period, removing a longstanding governance overhang, though gearing at 43.0% remains among the highest in the sector.
Keppel REIT's (KREIT) results showed the office upcycle flowing through, even as an equity raise diluted per-unit distributions.
Distributable income rose a stronger 25.2% year-on-year to S$119.6 million, largely on the back of the additional one-third stake in Marina Bay Financial Centre Tower 3 and Australia's Top Ryde Shopping Centre.
However, the enlarged unit base following the MBFC Tower 3 equity funding diluted DPU, which fell 4.0% year-on-year to 2.61 Scts.
Rental reversion stayed firm at 12.8%, with new Singapore leases signed at an average of S$13.14 psf against expiring rents of S$12.24 psf for FY2026 — implying further positive mark-to-market potential ahead.
Singapore occupancy improved to 98.1%, though Australia softened to 93.7%.
Aggregate leverage improved 7.9 percentage points to 40.0% after repaying an equity bridge loan.
KREIT's proposed divestment of Tokyo's KR Ginza II at a 9.7% premium to valuation should further strengthen the balance sheet once it completes in the third quarter.
Hospitality and accommodation REITs hold steady
CapitaLand Ascott Trust’s 1H26 results were steady at the headline level.
DPS was flat year-on-year at 2.53 Singapore cents.
Income available for distribution rose 11% to S$107.1 million, helped by non-periodic items such as realised exchange gains.
However, excluding these one-off items, core distribution income fell 10%. This reflected transitional drag from the closures of The Cavendish London and Madison Hamburg, ongoing asset enhancement works and foreign exchange effects.
Operating performance was still resilient. Same-store RevPAU grew 1% year-on-year, with 1H26 RevPAU at S$147 and 2Q26 RevPAU at S$156.
Average occupancy stood at about 78% to 79%.
CapitaLand Ascott Trust also continued to reshape its portfolio. It acquired three rental housing assets in Japan and lined up a S$360.0 million divestment of The Robertson House in Singapore at a 4.0% premium to book value.
The balance sheet remained manageable, with gearing at 37.7% as at 30 June 2026.
Cost of debt was stable at 2.8%, while interest cover stood at 2.9x.
CLAS continues to offer an attractive yield, but investors should look beyond the headline DPS and watch whether core distribution income recovers as portfolio transitions and asset enhancement works are completed.
|
Source: Singapore Tourism Board |
CDL Hospitality Trust's (CDLHT) 1H26 DPS grew a healthy 8.6% to 2.15 Scts, helped by a 31.9% year-on-year fall in interest expense following proactive refinancing.
Revenue rose 1.4% year-on-year to S$126.9 million.
Singapore hotels were the standout, with 1H26 RevPAR up 4.1% year-on-year to S$172 on stronger occupancy, even as the broader travel backdrop turned more cautious.
Elsewhere in the portfolio, performance was much softer: Japan RevPAR fell 4.5% on weaker Chinese visitor demand, and Maldives RevPAR plunged 18.3% as the Middle East conflict disrupted flight connectivity and visitor arrivals fell 15.2% between March and June.
New Zealand, benefiting from the newly opened New Zealand International Convention Centre, was a bright spot overseas, with RevPAR up 10.4% in local currency terms.
Gearing stayed low at 35.3% with cost of debt down to 2.8%.
Investors remain focused on how CDLHT will fund the roughly S$475 million forward purchase of Moxy Singapore Clarke Quay, due to complete around end-2026.
Centurion Accommodation REIT (CAREIT), which listed more recently as the first pure-play purpose-built worker and student accommodation REIT globally, delivered a strong debut set of results.
1H26 revenue of S$108.9 million and NPI of S$78.4 million beat its own IPO prospectus by 5.1% and 4.3% respectively.
1H26 DPU of 3.499 Scts beat prospectus by 9.6%.
Financial occupancy came in at 92.2% for its worker-accommodation (PBWA) portfolio and 98.8% for its student-accommodation (PBSA) portfolio
Gearing was low at 29.9%, leaving about S$380 million of debt headroom to pursue a sponsor development pipeline of roughly 9,198 beds through 2026 to 2028.
Overseas REITs: fundamentals hold up beneath the currency noise
REITs with overseas exposure have seen a wider spread of outcomes, mainly due to currency swings and different local market conditions.
CapitaLand India Trust (CLINT) delivered resilient results despite INR depreciation eating into reported figures.
1H26 property income fell 7.8% year-on-year and NPI dropped 5.4%, but distributable income still rose 7.7% to S$64.2 million.
DPU grew 1.0% to 4.0 Singapore cents (a stronger 13.0% in INR terms).
Committed occupancy held steady at 91%, with rental reversions of 24% over the trailing twelve months.
Gearing rose to 38.0% as CLINT continues to fund its data-centre pipeline — its 50MW Navi Mumbai Tower 1 was handed over in July 2026, with a committed pipeline of 200MW of data-centre capacity targeted by end-2026, a segment management expects to become "a more meaningful earnings contributor" from 2H26.
Stoneweg Europe Stapled Trust posted a broadly flat 1H26. Gross revenue and NPI both fell about 2.2-2.3% year-on-year on a reported basis, though like-for-like growth was a positive 1.3%.
Distribution per stapled security still edged up 1.4% to 6.642 Euro cents.
Occupancy stood at 93.7%, with rental reversion of 6.5% (logistics and light industrial +9.6%, offset by office at -4.1%).
Net gearing rose to 41.9% from 38.0%, at the upper end of management's targeted range, partly reflecting continued investment in the AiOnX data-centre fund, which management is targeting to grow to 15-25% of the portfolio by FY2028 from 7.2% currently.
United Hampshire US REIT (UHREIT) was one of the quarter's steadier overseas performers. 1H26 gross revenue rose 5.8% to US$37.8 million.
DPU grew 3.4% to 2.16 US cents, supported by 97.6% committed occupancy and a 7.9-year weighted average lease expiry.
Aggregate leverage rose modestly to 40.4%, though the weighted average interest rate continued its multi-quarter decline to 4.89%.
UHREIT continued recycling capital, divesting the BJ’s Quincy property at a 4.9% premium to valuation while funding smaller accretive acquisitions.
However, the underlying operating picture has generally remained resilient.
Many overseas-focused REITs are still reporting positive rental reversions, stable occupancies and disciplined capital management.
This suggests that the headline numbers may look noisy, but the core property fundamentals have not broken down.
The key takeaway is that investors should separate currency translation effects from actual operating performance.
For overseas REITs, the more important questions are whether tenants are still renewing leases, whether occupancy is holding up, and whether managers are actively protecting distributions through hedging, refinancing and portfolio adjustments.
What do we focus on: distribution growth, not just yield
Uncertainty around Singapore government bond and T-bill yields has weighed on S-REITs.
When safer instruments offer attractive yields, REITs look less compelling by comparison, and that repricing has shown up in REIT prices. Against this backdrop, we would focus on REITs with stronger underlying assets and clearer levers for distribution growth.
This includes segments where demand has remained relatively steady, such as Singapore office, logistics, data centres and purpose-built accommodation.
Overseas-focused REITs that actively manage currency exposure may also be better placed to ride through volatility.
Many REIT managers have also locked in borrowing costs over longer tenors in recent years, giving them some buffer if interest rates stay elevated for longer.
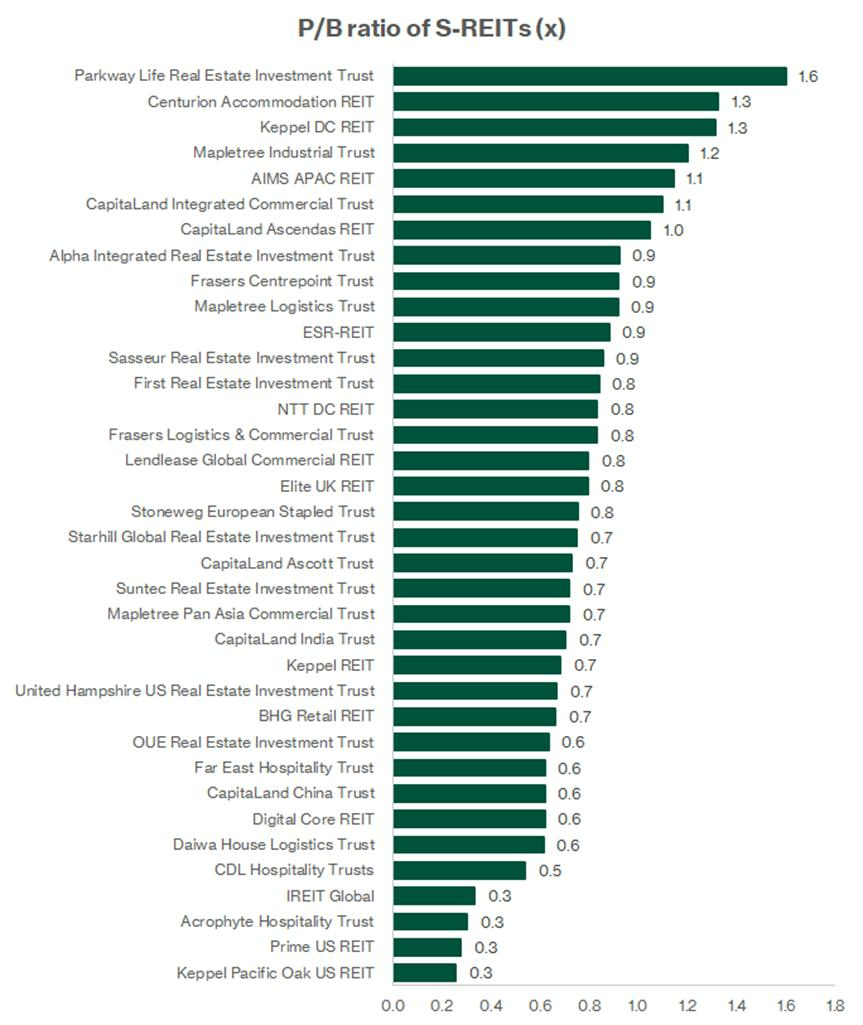
Valuations have become more reasonable after the pullback. The Lion-Philip S-REIT ETF now trades at 1.0x price-to-book, below its historical average of 1.16x.
Its forward distribution yield has risen to 5.8%, above the long-term average distribution yield of 5.1%. However, we would not chase yield alone. The better approach is to look for REITs that can sustain and grow distributions through active portfolio management.
This could come from asset enhancements, accretive acquisitions, positive rental reversions or balance sheet discipline.
Performance is likely to remain uneven across the sector, depending on sub-sector exposure, geographic mix, debt structure and management execution.
Among mid-cap REITs, CapitaLand India Trust, Digital Core REIT and Stoneweg Europe Stapled Trust stand out for growth potential. AIMS APAC REIT and Parkway Life REIT have also shown more defensive distribution profiles.
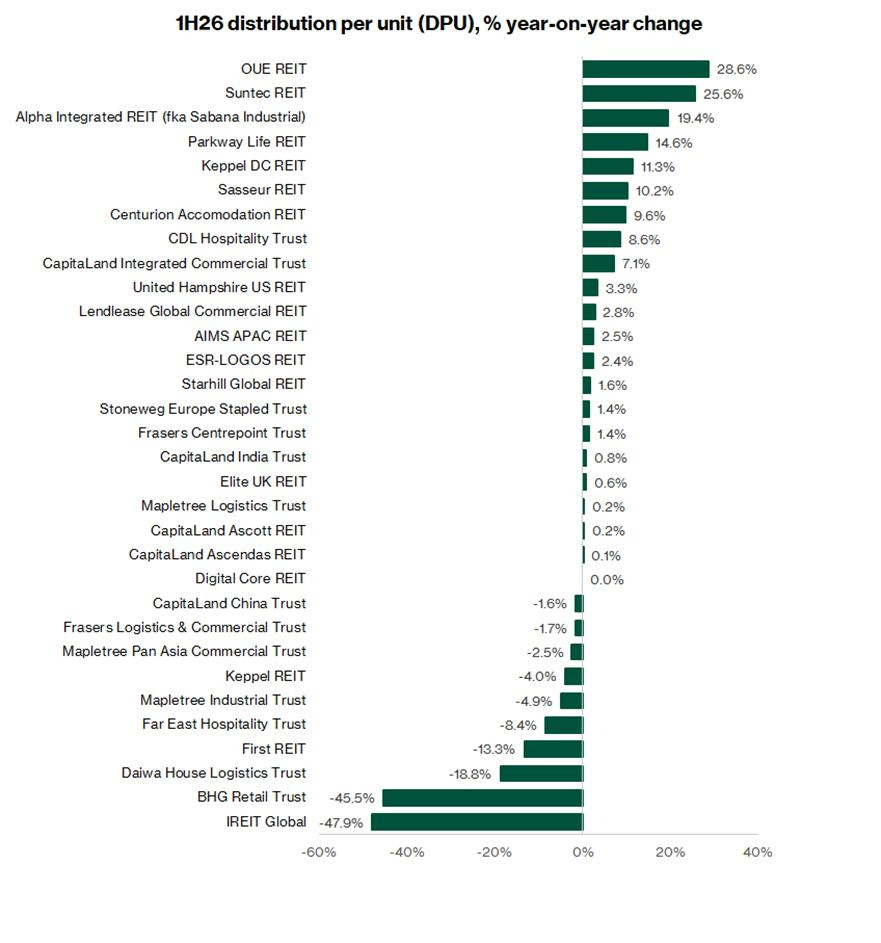
By contrast, many other S-REITs saw distributions decline, especially those with significant overseas exposure, which were hit by currency effects and higher borrowing costs.
Industrial and retail REITs with meaningful Singapore exposure proved comparatively more resilient. That pattern has carried into the latest results.
Looking at 1H26 DPU trends, data centre and prime office REITs were the standout gainers. Keppel DC REIT and OUE REIT both posted double-digit DPU growth in 1H26.
The key takeaway is that S-REITs are not a broad-based recovery trade today. We would focus on REITs with visible distribution growth, resilient assets and disciplined capital management, rather than simply buying the highest-yielding names.
|
Source: Beansprout, Sep 2026 |
|
Source: FactSet, 8 September 2026 |
|
Source: FactSet, 8 September 2026 |
You can learn more about how I use the three simple checks I use to screen Singapore REITs for passive income here.
For a REIT to form part of my Income Pot within the Beansprout's four pots of wealth, I would look beyond its headline yield and assess whether its occupancy, rental growth, balance sheet and DPU can remain resilient through different market conditions.
At Beansprout, we still see Singapore stocks as a core part of a globally diversified portfolio, especially for investors looking for dividend income.
However, rather than relying too heavily on REITs alone, I would build a broader mix of income sources, including quality Singapore blue-chip stocks with sustainable dividends, resilient earnings and strong balance sheets.
To find out which stocks we would hold in our model portfolio, check out how we would invest $100,000 in Singapore today.
If you are looking for greater clarity on the markets and the investment decisions that matter, explore Beansprout Pro for our latest views, portfolio thinking and the reasoning behind each opportunity.To screen for Singapore REITs with lowest price-to-book valuation or highest dividend yield, check out our best Singapore REIT screener.
If you are new to investing in Singapore REITs, you can start to learn more about Singapore REITs here.
If you prefer diversification without picking individual REITs, you can also gain exposure through Singapore REIT ETFs.
Check out Beansprout guide to the best stock trading platforms in Singapore with the latest promotions to Singapore REITs Sector.
Download the full report here.
Enjoyed this insight? Follow Beansprout on Youtube, Facebook and Instagram, and add Beansprout as your preferred source on Google so you never miss an update.
Important Disclosures
Analyst Certification and Disclosures
The analyst(s) named in this report certifies that (i) all views expressed in this report accurately reflect the personal views of the analyst(s) with regard to any and all of the subject securities and companies mentioned in this report and (ii) no part of the compensation of the analyst(s) was, is, or will be, directly or indirectly, related to the specific views expressed by that analyst herein. The analyst(s) named in this report (or their associates) does not have a financial interest in the corporation(s) mentioned in this report.
An associate is defined as (i) the spouse, or any minor child (natural or adopted) or minor step-child, of the analyst; (ii) the trustee of a trust of which the analyst, his spouse, minor child (natural or adopted) or minor step-child, is a beneficiary or discretionary object; or (iii) another person accustomed or obliged to act in accordance with the directions or instructions of the analyst.
Company Disclosure
Global Wealth Technology Pte Ltd (“Beansprout”) does not have any financial interest in the corporation(s) mentioned in this report.
Disclaimer
This report is provided by Beansprout for the use of intended recipients only and may not be reproduced, in whole or in part, or delivered or transmitted to any other person without our prior written consent. By accepting this report, the recipient agrees to be bound by the terms and limitations set out herein.
You acknowledge that this document is provided for general information purposes only. Nothing in this document shall be construed as a recommendation to purchase, sell, or hold any security or other investment, or to pursue any investment style or strategy. Nothing in this document shall be construed as advice that purports to be tailored to your needs or the needs of any person or company receiving the advice. The information in this document is intended for general circulation only and does not constitute investment advice. Nothing in this document is published with regard to the specific investment objectives, financial situation and particular needs of any person who may receive the information.
Nothing in this document shall be construed as, or form part of, any offer for sale or subscription of or solicitation or invitation of any offer to buy or subscribe for any securities. The data and information made available in this document are of a general nature and do not purport, and shall not in any way be deemed, to constitute an offer or provision of any professional or expert advice, including without limitation any financial, investment, legal, accounting or tax advice, and shall not be relied upon by you in that regard. You should at all times consult a qualified expert or professional adviser to obtain advice and independent verification of the information and data contained herein before acting on it. Any financial or investment information in this document are intended to be for your general information only. You should not rely upon such information in making any particular investment or other decision which should only be made after consulting with a fully qualified financial adviser. Such information do not nor are they intended to constitute any form of financial or investment advice, opinion or recommendation about any investment product, or any inducement or invitation relating to any of the products listed or referred to. Any arrangement made between you and a third party named on or linked to from these pages is at your sole risk and responsibility.
You acknowledge that Beansprout is under no obligation to exercise editorial control over, and to review, edit or amend any data, information, materials or contents of any content in this document. You agree that all statements, offers, information, opinions, materials, content in this document should be used, accepted and relied upon only with care and discretion and at your own risk, and Beansprout shall not be responsible for any loss, damage or liability incurred by you arising from such use or reliance.
This document (including all information and materials contained in this document) is provided “as is”. Although the material in this document is based upon information that Beansprout considers reliable and endeavours to keep current, Beansprout does not assure that this material is accurate, current or complete and is not providing any warranties or representations regarding the material contained in this document. All opinions contained herein constitute the views of the analyst(s) named in this report, they are subject to change without notice and are not intended to provide the sole basis of any evaluation of the subject securities and companies mentioned in this report. Any reference to past performance should not be taken as an indication of future performance. To the fullest extent permissible pursuant to applicable law, Beansprout disclaims all warranties and/or representations of any kind with regard to this document, including but not limited to any implied warranties of merchantability, non-infringement of third-party rights, or fitness for a particular purpose.
Beansprout does not warrant, either expressly or impliedly, the accuracy or completeness of the information, text, graphics, links or other items contained in this document. Neither Beansprout nor any of its affiliates, directors, employees or other representatives will be liable for any damages, losses or liabilities of any kind arising out of or in connection with the use of this document. To the best of Beansprout’s knowledge, this document does not contain and is not based on any non-public, material information. The information in this document is not intended for distribution to, or use by, any person or entity in any jurisdiction where such distribution or use would be contrary to law or regulation, or which would subject Beansprout to any registration requirement within such jurisdiction or country. Beansprout is not licensed or regulated by any authority in any jurisdiction or country to provide the information in this document.
As a condition of your use of this document, you agree to indemnify, defend and hold harmless Beansprout and its affiliates, and their respective officers, directors, employees, members, managing members, managers, agents, representatives, successors and assigns from and against any and all actions, causes of action, claims, charges, cost, demands, expenses and damages (including attorneys’ fees and expenses), losses and liabilities or other expenses of any kind that arise directly or indirectly out of or from, arising out of or in connection with violation of these terms, use of this document, violation of the rights of any third party, acts, omissions or negligence of third parties, their directors, employees or agents. To the extent permitted by law, Beansprout shall not be liable to you, any other person, or organization, for any direct, indirect, special, punitive, exemplary, incidental or consequential damages, whether in contract, tort (including negligence), or otherwise, arising in any way from, or in connection with, the use of this document and/or its content. This includes, without limitation, liability for any act or omission in reliance on the information in this document. Beansprout expressly disclaims and excludes all warranties, conditions, representations and terms not expressly set out in this User Agreement, whether express, implied or statutory, with regard to this document and its content, including any implied warranties or representations about the accuracy or completeness of this document and the content, suitability and general availability, or whether it is free from error.
If these terms or any part of them is understood to be illegal, invalid or otherwise unenforceable under the laws of any state or country in which these terms are intended to be effective, then to the extent that they are illegal, invalid or unenforceable, they shall in that state or country be treated as severed and deleted from these terms and the remaining terms shall survive and remain fully intact and in effect and will continue to be binding and enforceable in that state or country.
These terms, as well as any claims arising from or related thereto, are governed by the laws of Singapore without reference to the principles of conflicts of laws thereof. You agree to submit to the personal and exclusive jurisdiction of the courts of Singapore with respect to all disputes arising out of or related to this Agreement. Beansprout and you each hereby irrevocably consent to the jurisdiction of such courts, and each Party hereby waives any claim or defence that such forum is not convenient or proper.
Read also
Gain financial insights in minutes
Subscribe to our free weekly newsletter for more insights to grow your wealth
Most Popular

Comments
0 comments