Sembcorp Industries, SGX and Wilmar in focus: Weekly Review with SIAS
Stocks
Powered by
By Gerald Wong, CFA • 06 Apr 2026
Why trust Beansprout? We’ve been awarded Best Investment Website at the SIAS Investors’ Choice Awards 2025
'%3e%3cpath%20fill-rule='evenodd'%20clip-rule='evenodd'%20d='M17.64%209.20455C17.64%208.56637%2017.5827%207.95273%2017.4764%207.36364H9V10.845H13.8436C13.635%2011.97%2013.0009%2012.9232%2012.0477%2013.5614V15.8195H14.9564C16.6582%2014.2527%2017.64%2011.9455%2017.64%209.20455V9.20455Z'%20fill='%234285F4'/%3e%3cpath%20fill-rule='evenodd'%20clip-rule='evenodd'%20d='M9%2018C11.43%2018%2013.4673%2017.1941%2014.9564%2015.8195L12.0477%2013.5614C11.2418%2014.1014%2010.2109%2014.4205%209%2014.4205C6.65591%2014.4205%204.67182%2012.8373%203.96409%2010.71H0.957275V13.0418C2.43818%2015.9832%205.48182%2018%209%2018V18Z'%20fill='%2334A853'/%3e%3cpath%20fill-rule='evenodd'%20clip-rule='evenodd'%20d='M3.96409%2010.71C3.78409%2010.17%203.68182%209.59318%203.68182%209C3.68182%208.40682%203.78409%207.83%203.96409%207.29V4.95818H0.957273C0.347727%206.17318%200%207.54773%200%209C0%2010.4523%200.347727%2011.8268%200.957273%2013.0418L3.96409%2010.71V10.71Z'%20fill='%23FBBC05'/%3e%3cpath%20fill-rule='evenodd'%20clip-rule='evenodd'%20d='M9%203.57955C10.3214%203.57955%2011.5077%204.03364%2012.4405%204.92545L15.0218%202.34409C13.4632%200.891818%2011.4259%200%209%200C5.48182%200%202.43818%202.01682%200.957275%204.95818L3.96409%207.29C4.67182%205.16273%206.65591%203.57955%209%203.57955V3.57955Z'%20fill='%23EA4335'/%3e%3c/g%3e%3cdefs%3e%3cclipPath%20id='clip0_0_2849'%3e%3crect%20width='18'%20height='18'%20fill='white'/%3e%3c/clipPath%3e%3c/defs%3e%3c/svg%3e)
Make Beansprout your preferred source on Google
Add us on Google to see more of our insights in your search results
We share about more about Sembcorp Industries, SGX, Wilmar and how higher oil prices are driving Singapore stock performance in the latest Weekly Market Review.

What happened?
In this week's Weekly Market Review in partnership with Securities Investors Association Singapore (SIAS), we discuss how global markets rebounded even as investors remained focused on the Iran conflict, oil price volatility and bond yields, alongside Sembcorp Industries, SGX and Wilmar International.
Watch the video to learn more about what we are looking out for this week.
Weekly Market Review
2:00 - Macro Update
- The S&P 500 rebounded 3.4% last week, its first weekly gain in six weeks, while the NASDAQ rose 4.4% as US equities recovered despite heightened geopolitical uncertainty.
- The STI also remained resilient, rising 1.0% to 4,948, staying close to its all-time high even as global markets continued to grapple with volatility linked to the Middle East conflict.
- Oil prices remained highly volatile. Brent crude oil prices briefly eased below US$100 per barrel on hopes of de-escalation, but rebounded again after Donald Trump’s latest address, reinforcing investor concerns about inflation and growth.
- US government bond yields eased slightly from their recent highs, with the US 10-year Treasury yield falling back to 4.3% from above 4.4%, while the Singapore 10-year government bond yield declined to around 2.2% from 2.4%.
- Powell’s recent comments helped calm fears of an imminent Fed response to rising oil prices, though markets remain focused on whether elevated energy prices will feed through into inflation in the months ahead.
- In Singapore, OCBC was among the top performers with a 3.8% gain, becoming the second Singapore-listed company to cross the S$100 billion market capitalisation mark. Sembcorp Industries also gained 3.8%, while Keppel DC REIT rose 1.8% as lower bond yields supported selected REIT names.
- On the weaker side, City Developments fell 2.1% on continued profit-taking, while Hongkong Land declined 5.8%.
- For March, the STI’s top performers included SGX with an 8.1% gain, Wilmar with an 8.8% gain, and Sembcorp Industries with a 12.2% gain, highlighting the continued strength of selected Singapore blue chips despite broader global weakness.
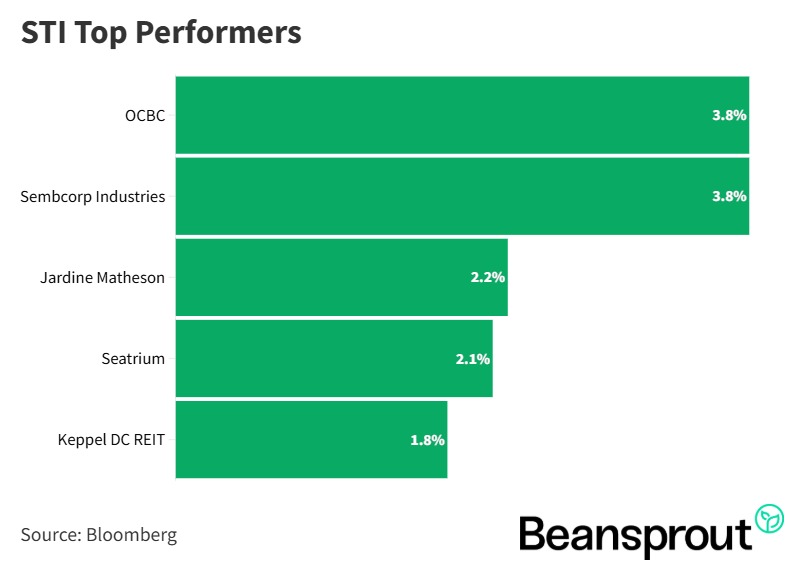
STI Top Performers:
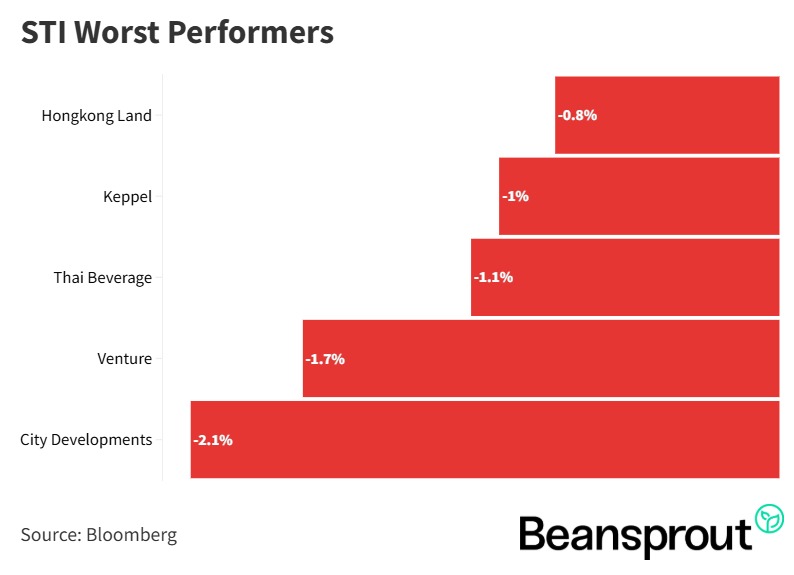
STI Worst Performers:
- Hongkong Land Holdings Limited
- Keppel Ltd.
- Thai Beverage Public Company Limited
- Venture Corporation Limited
- City Developments Limited
Sembcorp Industries (SGX: U96)
- Sembcorp Industries was one of the strongest performers on the STI in March, with its share price rebounding sharply after earlier weakness in February.
- The company reported 2025 net profit of just above S$1 billion, down about 1% year on year, while revenue declined 10% compared to 2024.
- Despite the softer headline earnings, investors turned more constructive on the stock because of its diversified energy portfolio across Singapore, India, the Middle East, Australia and renewable energy markets.
- In Singapore, Sembcorp remains a leading integrated energy player with the country’s largest gas-fired fleet and solar portfolio, alongside access to piped natural gas and liquefied natural gas.
- Its gas-related business was a key source of weakness in 2025 due to lower spreads in Singapore. However, renewed volatility in gas prices has improved sentiment, as past periods of market disruption have tended to support stronger gas trading profits.
- The company’s renewable energy portfolio continued to grow steadily, with renewable profit increasing in 2025 despite ongoing headwinds in China.
- In the Middle East, management said operations remain unaffected so far despite the conflict, while in Australia the recently approved Alinta acquisition adds further scale to its portfolio.
- Overall, investors appear to be focusing on Sembcorp’s diversified energy exposure and its potential to benefit from elevated gas price volatility, while still offering long-term dividend growth supported by conventional and renewable assets.
Related Links:
- Sembcorp Industries share price history and share price target
- Sembcorp Industries dividend history and dividend forecast
Singapore Exchange (SGX: S68)
- SGX was another standout performer in March, with its share price moving above S$20 and remaining one of the stronger STI names year to date.
- The key driver has been the sharp improvement in trading activity. Securities daily average value rose 45% year on year to S$2.1 billion in February, marking the highest level since 2020.
- Retail participation also increased 45% year on year, reaching its highest level in 13 years, reflecting stronger investor engagement amid market volatility.
- This supported SGX’s latest earnings for the half year ended December 2025. Adjusted net profit after tax rose 11.6% year on year to S$357 million, while revenue increased 7.6%.
- The strongest growth came from fixed income, currencies and commodities, supported by higher commodities and FX trading activity. Cash equities also saw a significant uplift as daily average traded volume rose sharply.
- Management continues to execute on its multi-asset strategy, spanning equities, FX, commodities and derivatives, while also benefiting from measures aimed at revitalising the Singapore equities market.
- SGX is targeting medium-term organic revenue growth of 6% to 8% per annum, and has also given clearer visibility on dividend growth through FY2028.
- The combination of stronger trading activity, improved earnings momentum and a rising dividend outlook has helped support investor confidence in the stock.
Related Links:
Wilmar International (SGX: F34)
- Wilmar was also among the better-performing STI stocks in March, with its share price rising above S$3.80 as investor sentiment improved.
- While Wilmar’s 2025 results were weighed down by regulatory-related provisions, the market has become more optimistic that some of the major headwinds from last year may be easing.
- The standout segment was Feed and Industrial Products, where pre-tax profit surged 62% year on year to US$479 million.
- This strength helped offset weaker performance in the Food Products and Plantation and Sugar Milling businesses, both of which saw year-on-year profit declines.
- Within Feed and Industrial Products, the key contributors were tropical oils, oilseeds and grains. Higher oil prices have led investors to expect improved profitability from Wilmar’s palm oil-related operations.
- That shift in sentiment appears to be a key reason behind the stock’s recent outperformance.
- On dividends, Wilmar reduced its total dividend slightly to 14 Singapore cents in 2025, down from 16 cents in 2024.
- Based on the latest payout, the stock is offering a dividend yield of just below 4%.
- Overall, Wilmar’s recent share price recovery reflects improving confidence that its core earnings can strengthen as commodity-related businesses benefit from a firmer oil price environment, even though some parts of the business remain under pressure.
Related Links:
Read also: 3 best-performing Singapore blue chip stocks in March
Technical Analysis
Straits Times Index
- The STI has remained relatively resilient and is trading near the 4,900 pivot level, close to its 20-day moving average.
- Immediate support is around the 4,800 level, which also lines up with the lower end of its recent trading range.
- Momentum remains fairly neutral, with the RSI slightly above 50, suggesting there is still mild positive momentum in the index.
- For now, the STI may stay range-bound, with near-term resistance at the psychological 5,000 level and support around 4,800.
Learn more about the Straits Times Index (STI) here.
Dow Jones Industrial Average
- The Dow Jones remains under pressure and is down 3.3% year to date, although it managed a rebound last week.
- The index is now trading near its pivot level around 46,500, with immediate resistance near 48,000 and support around 45,000.
- Momentum remains slightly weak, with the RSI below the 50 mark, pointing to lingering downside pressure despite the recent bounce.
- In the near term, the Dow may remain range-bound between 45,000 and 48,000, with further direction likely to depend on geopolitical developments and earnings season.
S&P 500
- The S&P 500 is down 4.3% year to date and remains weaker than the STI, even after rebounding last week.
- The index closed near 6,582 and is hovering close to its 20-day moving average around 6,600, which could act as near-term resistance.
- Momentum is still soft, with the RSI at 46, suggesting that the broader market has yet to regain stronger upward momentum.
- If sentiment improves, the index could move towards 6,800 again, but for now, geopolitical uncertainty and oil price volatility remain key risks.
Learn more about the S&P 500 index here.
Nasdaq Composite Index
- The Nasdaq remains the weakest among the three major US indices, down 6.8% year to date despite a sharp rebound last week.
- The index has recovered to around 21,879, but the 20-day moving average near 21,987 remains an important level to watch.
- Momentum is still weak, with the RSI below 50, suggesting that last week’s rebound may not yet be enough to reverse the downtrend seen in March.
- Near-term resistance is around 23,000, while support is between 20,944 and 21,000. A break below support could signal further downside for the tech-heavy index.
What to look out for this week
- Wednesday. 8 April: DBS ex-dividend
- Thursday, 9 April: 6-month Singapore T-bill auction
- Friday, 10 April: US Consumer Price Index (CPI) data
Get the full list of stocks with upcoming dividends here.
Follow us on Telegram, Youtube, Facebook and Instagram to get the latest financial insights.
Read also
Gain financial insights in minutes
Subscribe to our free weekly newsletter for more insights to grow your wealth
Most Popular

Comments
0 comments