
Data Centre Sector: Riding on structural growth
Stocks
By Gerald Wong, CFA • 28 May 2026
Why trust Beansprout? We’ve been awarded Best Investment Website at the SIAS Investors’ Choice Awards 2025
'%3e%3cpath%20fill-rule='evenodd'%20clip-rule='evenodd'%20d='M17.64%209.20455C17.64%208.56637%2017.5827%207.95273%2017.4764%207.36364H9V10.845H13.8436C13.635%2011.97%2013.0009%2012.9232%2012.0477%2013.5614V15.8195H14.9564C16.6582%2014.2527%2017.64%2011.9455%2017.64%209.20455V9.20455Z'%20fill='%234285F4'/%3e%3cpath%20fill-rule='evenodd'%20clip-rule='evenodd'%20d='M9%2018C11.43%2018%2013.4673%2017.1941%2014.9564%2015.8195L12.0477%2013.5614C11.2418%2014.1014%2010.2109%2014.4205%209%2014.4205C6.65591%2014.4205%204.67182%2012.8373%203.96409%2010.71H0.957275V13.0418C2.43818%2015.9832%205.48182%2018%209%2018V18Z'%20fill='%2334A853'/%3e%3cpath%20fill-rule='evenodd'%20clip-rule='evenodd'%20d='M3.96409%2010.71C3.78409%2010.17%203.68182%209.59318%203.68182%209C3.68182%208.40682%203.78409%207.83%203.96409%207.29V4.95818H0.957273C0.347727%206.17318%200%207.54773%200%209C0%2010.4523%200.347727%2011.8268%200.957273%2013.0418L3.96409%2010.71V10.71Z'%20fill='%23FBBC05'/%3e%3cpath%20fill-rule='evenodd'%20clip-rule='evenodd'%20d='M9%203.57955C10.3214%203.57955%2011.5077%204.03364%2012.4405%204.92545L15.0218%202.34409C13.4632%200.891818%2011.4259%200%209%200C5.48182%200%202.43818%202.01682%200.957275%204.95818L3.96409%207.29C4.67182%205.16273%206.65591%203.57955%209%203.57955V3.57955Z'%20fill='%23EA4335'/%3e%3c/g%3e%3cdefs%3e%3cclipPath%20id='clip0_0_2849'%3e%3crect%20width='18'%20height='18'%20fill='white'/%3e%3c/clipPath%3e%3c/defs%3e%3c/svg%3e)
Make Beansprout your preferred source on Google
Add us on Google to see more of our insights in your search results
A look at the basics of data centre sector, industry growth trends, key data centre evaluation metric and investment risks.
Introduction
Data centres are specialised physical facilities that house IT infrastructure such as servers, storage systems and network equipment. They are essential for every online service, from business operations and cloud services to modern artificial intelligence (AI). Businesses require them to handle the large volumes of data generated from their online operations.
In the global data centre industry, the installed capacity has grown at compound annual growth rate (CAGR) of 14.2 percent between 2019 – 2025, to reach 114.3 GW in 2025. Fuelled by demand from AI and machine learning, the momentum is set to continue. The installed base is expected to grow to 240.1 GW by 2030, at a CAGR of 16.0%. In terms of the revenue size, the market is forecasted to grow at CAGR of 11.2 percent from 2025 to 2030, to US$652.0 billion.
The four main types of data centres are Enterprise, Colocation, Hyperscale and Edge. We will focus on capacity growth, revenue models and capital expenditure trends of Colocation and Hyperscale data centres.
Singapore-listed companies with significant exposure to data centre assets are the REITs operating the stabilised data centres - include Digital Core REIT (SGX: DCRU), Keppel DC REIT (SGX: AJBU), NTT DC REIT (SGX: NTDU) and Mapletree Industrial Trust (SGX: ME8U).
In the global data centre industry, the dominant data centre REIT in the U.S. include Digital Realty and Equinix. In Australia, the leading data centre operators are NextDC and Airtrunk.
REIT vs Corporate
Investors can gain exposure to data centres through either REITs or listed corporates, which differ mainly in their revenue model, cash flow profile and risk-return characteristics.
- Revenue model: A data centre REIT receives rental revenue from customers who lease the space to host servers and IT infrastructure. The rental revenue is based on rent per kW, per cabinet or per square foot. A data centre corporate generates revenue from providing services including cloud computing, managed hosting, connectivity or AI compute.
- Cash flow visibility: REIT is distribution oriented and defensive. REIT is required by law to distribute a high proportion of taxable income as dividends. Investors receive a steady and recurring source of income. Corporate, on the other hand, has full discretion over dividends and would typically prefer to reinvest profits into expansion. Thus, corporate provides higher capital appreciation potential but less income certainty.
- Risk-return characteristics: REIT offers more predictable returns, driven by long term lease contracts. The tenure of the lease contracts ranges from 5 to 15 years, with built-in escalation clauses. Corporate’s revenue is driven by execution, operational and technological positioning. At the same time, corporate offers significant upside potential in an upcycle.
Industry Growth Trends
The data centre industry grew rapidly in recent years, fuelled by demand from cloud computing and AI. For the period 2020 to 2025, the industry revenue grew at CAGR 9.1 percent to US$383.8 billion. Based on the pipeline of data centre under development, the industry is poised to continue with the steady growth.
The global data centre market is projected to grow at a compound annual growth rate (CAGR) of 11.2 percent from 2025 to 2030, reaching US$652.0 billion.
Key Metrics to evaluating a Data Centre
For investors assessing data centre assets, several operating metrics are critical in determining the attractiveness and performance of the properties. These include vacancy rate, rental rate trend, power usage effectiveness (PUE) and IT load capacity. We will discuss these further on page 22.
- IT load capacity measure the maximum amount of electrical power that a data centre can supply to IT equipment, expressed through the Density metric. Rack Density refers to the amount of power a fully populated server rack consumes.
- Vacancy rate and rental rate are key operating metrics of data centres. Vacancy rate is the percentage of commissioned power that is currently available to be leased.
- Rental rate refers to the monthly cost per kilowatt ($/kW/month) that data centre operators charge tenants for colocation and power. A higher occupancy rate and rental rates translate to stronger revenue.
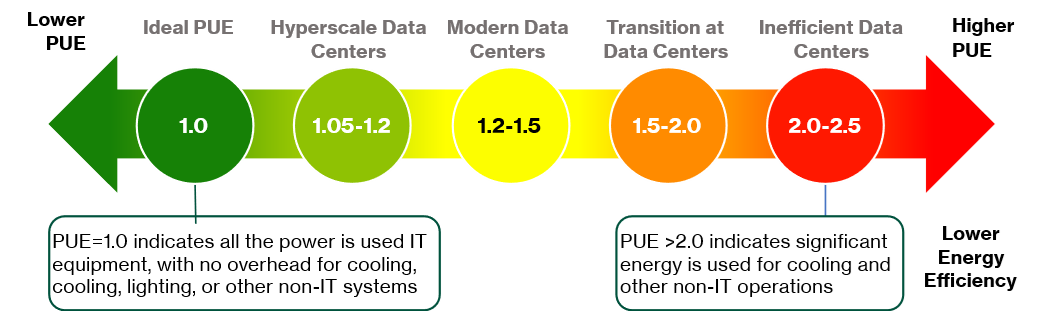
- PUE measures the ratio of the total power consumption of data centre to the energy solely used by IT equipment. The closer the ratio is to 1.0, the more efficient the data centre.
Investment risks
Power supply risk: A reliable source of power supply is imperative to a data centre. Power is also the largest cost component. Any interruption, including grid failure, can create immediate revenue loss and customer defection.
Regulatory and environmental risk: Governments are classifying data centres as critical infrastructure requiring interventions. There are energy efficiency directives that include mandatory PUE reporting and sustainability disclosures.
Interest rate and leverage risk: Data centre developers and operators are highly leveraged to the capital-intensive business model. With rises in interest rates, the annual debt service costs increases as well.
Cybersecurity and data breach risk: Data centres are prime targets for cyber-attacks. Ransomware attacks on facility management systems can shut down entire operations. This can lead to reputational damage and loss of business as tenants switch to more reliable providers.
Oversupply risk: There is the possibility that the primary growth drivers like AI and cloud computing do not sustain and that the demand may not meet the future supply. As excessive capacity is being built in many regions, this may lead to potential declines in occupancy rates.
Introduction to Data Centre Sector
Data Centre Sector: A Defensive Asset Class With Strong Growth
Data Centre: An essential infrastructure driving digital transformation
Data centres are specialised physical facilities that house IT infrastructure such as servers, storage systems and network equipment. They are essential for every online service, from business operations and cloud services to modern AI. Businesses require them to handle the large volumes of data generated from their online operations.
Colocation
Colocation or multi-tenant data centres are third-party facilities renting data centre space, power and cooling to businesses that wish to host their servers and computing hardware offsite. These facilities provide proper components for a functioning data centre. Companies that do not have the space for their own enterprise data centre, or an IT team to manage, would opt for a colocation data centre. As an organisation’s needs change, they can quickly scale up or down.
A key attraction is location, as they are often located near internet exchange points, providing high-speed and low-latency connectivity. It offers tenants scalability and flexibility when adjusting their capacity according to demand. Tenants typically commit to a lease period of three to five years. Tenants have access to the physical space, power, and security to host their critical applications and workloads in an integrated ecosystem.
For investors, the appeal of the colocation data centre lies in its cashflow visibility. The monthly billing generates monthly recurring revenue for the data centre operator, providing predictable cash flow. In addition, the asset is highly diversified across multiple tenants and requires lower capital investment per revenue dollar compared to hyperscale data centre. As businesses increasingly rely on both on-premise and servers and cloud services, along with backup systems for disaster recovery, demand for colocation data centre space is set to grow. The global colocation market is projected to grow at a 16% CAGR from 2025 to 2030.
| Comparison of Colocation and Hyperscale DC | ||
| Aspect | Colocation | Hyperscale |
| Purpose | Lease space, power, and cooling to multiple tenants | Built and operated by a single cloud provider for massive workloads |
| Users | Small-to-large businesses, IT firms, enterprises needing off-site hosting | Large cloud providers, AI platforms, hyperscale cloud clients |
| Size & Scale | Medium to large; flexible modular growth | Extremely large; tens of thousands of servers |
| Revenue Model | Recurring income from multiple tenants (space, power, services) | Revenue tied to cloud services and subscriptions |
| Capex | Moderate; spread across tenants; operator invests in facility | Very high; operator funds entire facility for massive infrastructure |
| Growth Driver | Demand from multiple businesses needing reliable | Rapid expansion of cloud, AI, and big data workloads |
| shared facilities | ||
| Flexibility | High – multiple tenants can scale individually | Lower flexibility for others; capacity dedicated to one operator |
| Key Operators | Equinix, Digital Realty, NTT, Keppel DC | AWS, Microsoft Azure, Google Cloud, Meta (Facebook) |
| Source: Beansprout Research | ||
Hyperscale
Hyperscale data centres are large facilities owned or leased by major cloud providers. Hyperscale data centres are typically around 10,000 square feet or larger. They are designed to support very large-scale IT infrastructure. The number of large data centres operated by hyperscale companies reached over 1,000 at the end 1Q2025 and they account for 44% of the worldwide capacity of all data centres. Companies which use them include Amazon, Meta, Microsoft, and Google.
Amazon, Microsoft Azure and Google Cloud are three dominant cloud computing providers. They account for 65% of global cloud infrastructure spending.
As enterprises continue migrating from on-premises infrastructure to online cloud models, the surge in cloud services has resulted in steady demand for hyperscale data centres designed to handle large-scale workloads and provide reliable, high-capacity connectivity.
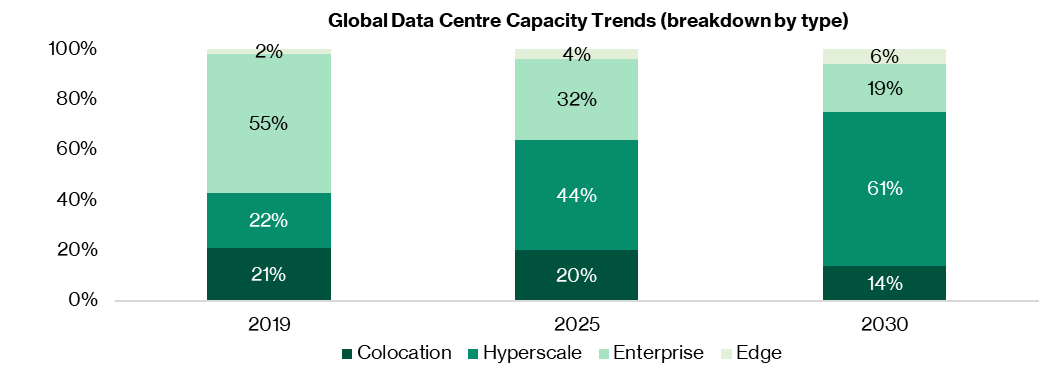
The global hyperscale data centres is projected to grow from US$162.8 billion in 2024 to US$608.5 billion by 2030 — implying a robust 24.6% CAGR over that period.
Enterprise
Enterprise data centres are privately-owned facilities that a company builds and operates for its own exclusive use. All the servers, networking, storage and IT equipment.
They remain relevant for companies that require dedicated infrastructure to meet compliance, regulatory, security requirements, or legacy application constraints. Enterprise data centres also provide low-latency connections to on-site operations, example factories.
Typically owned by large companies including banks and financial institutions, telcos, industrial conglomerates with legacy setups, healthcare groups and government agencies.
As capacity is sized for peak workloads, the facilities operate at low utilisation. That said, enterprise data centres grow more slowly, usually only when the company itself needs more capacity. The enterprise data centre is projected to grow from US$1.26 billion in 2024 to US$4.73 billion by 2030, representing 24.7% CAGR over 2025 to 2030.
Edge
Edge data centers are smaller, decentralized facilities located closer to where the data is actually being generated and consumed.
The idea is to process data near the "edge" of the network — the point where end users, devices, or sensors connect – reducing latency from 50-100 milliseconds down to single digits. They support applications that require near-instantaneous processing, such as 5G, augmented reality, IoT devices, autonomous vehicles, real-time analytics, and content delivery or streaming services.
By processing data closer to the source, edge data centers reduce network congestion and improve performance, making them critical for use cases where speed and responsiveness directly impact outcomes.
Type of operating models
Data centres are usually developed and operated under the following operating models – self-build, powered shell, fully fitted data centres and colocation.
Self-build
Hyperscalers like AWS, Microsoft, and Google are increasingly building and operating their own data centre facilities rather than leasing space from colocation providers.
In this model, developers are instrumental in sourcing land, managing shell construction, and arranging essential utilities. Developers commonly benefit from early-stage revenue opportunities, such as premiums on land acquisition and profits from initial design-build projects.
Additionally, hyperscalers often commit to large-scale, multi-phase developments for future expansion, providing developers with a clear and predictable project pipeline.
Developers with expertise in land assembly, permitting, and large-scale shell delivery are best positioned to thrive in this environment.
Colocation
Colocation facilities are owned and operated by a provider who leases space, power, and cooling to multiple tenants, each housing their own IT equipment.
This model creates diversified income from many tenants, reducing dependence on any single tenant and often delivering higher internal rates of return (IRRs) than other data centre models.
However, it requires the owner to manage complex operations like power, cooling, maintenance, and tenant relations, demanding specialized industry knowledge. There are also substantial capital investments and ongoing operational expenses involved in running these facilities. Colocation data centres tend to be more management intensive, and the owner is exposed to operational risks including the maintenance and replacement of M&E infrastructure.
| Hyperscale self-build vs leasing | ||
| Factor | Self-build | Leasing |
| Cost | High CapEx, lower OpEx long-term | Lower CapEx, higher OpEx long-term |
| Time-to-Market | Slower (years to build) | Faster (months to deploy) |
| Control | Full control over infrastructure | Limited to provider’s offerings, although there’s more control in a build-to-suit scenario |
| Scalability | Tailored to projected long-term needs | Easier to scale incrementally |
| Risk | Greater risk during construction | Shared risk with the lessor |
| Customizability | High | Moderate to low, although more customizability in a build-to-suit scenario |
| Geographic Expansion | Slower, requires local expertise | Faster, utilizes provider networks |
| Operational Complexity | High, requires in-house expertise | Low, outsourced to provider |
| Source: Independent research | ||
Shell & core or powered shell
The powered shell model involves the owner delivering a partially finished data centre building that includes the building shell, basic utilities, and power infrastructure, while tenants take responsibility for interior fit-out and IT operations.
The landlord is only responsible for the provision of power to the property, and the exposure to technical and operational risks is limited. These properties are typically let to a single data centre operator and leases tend to be relatively long, at least 10 years.
This model enables faster development and lower upfront costs compared to colocation facilities, as tenants complete the specialized interior setups themselves. Lease terms are often structured by square meter, similar to traditional real estate leases, offering reduced operational complexity for the owner.
This model offers a middle ground between full owner-operated colocation centres (higher revenue but complex operations) and hyperscale facilities (one-time development revenue) by balancing upfront investment, flexibility, and operational roles.
Fully-fitted data centres
Landlords handle the full fit-out of these facilities, including the mechanical and electrical (M&E) systems inside the data halls.
Fully fitted data centres are usually leased to a single tenant on long-term agreements.
These leases are often structured on a triple-net basis (NNN), so the tenant manages the upkeep of both the building and the installed M&E systems.
While fully fitted centres carry minimal operational risk, they do come with higher exposure to M&E obsolescence compared with shell-and-core facilities.
Type of pricing models
Different pricing models of colocation data centre contracts cater to different operational priorities, whether a customer need guaranteed power, lower costs, or room to scale.
- Gross pricing like per contracted kW address high-power demands with reserved allocations, whereas consumption-based billing supports businesses with fluctuating needs.
- Per-kW or pass-through pricing are suitable for companies who want tighter cost control and transparency.
- Triple Net (NNN) leases are common as well, passing operational costs such as maintenance and utilities to tenants.
- Per-rack or bundled pricing are suitable for customers who prefer straightforward, predictable bill.
| Pricing models | |||
| Pricing Model | Description | Primary Users | Key Features |
| Modified Gross | Fixed fee for reserved power capacity (kW), regardless of usage. Includes share of operating expenses. | Businesses with steady, high-density workloads. | Guaranteed power allocation; predictable billing; overage billed per kWh. |
| Gross (All-in) Pricing | Fixed fee for reserved power (kW) inclusive of utility rate changes, power consumption, and operating expenses. | Customers seeking steady, consistent billing | Consistent billing; risk is taken on by provider. |
| Triple Net (NNN) | Base price. Respective operating expenses passed through to the tenant. | Large businesses with desire to oversee and operate equipment and operations. | Ability to minimize operating expenses, greater operational efficiency resulting in lower costs to the user. |
| Per Rack | Flat monthly fee per rack or cabinet. | Businesses with predictable, moderate resource needs. | Simplified pricing; bundled services (space, power, connectivity); predictable costs. |
| Source: datacenterhawk | |||
From an investor's perspective, the triple-net lease with its stable and predictable margins, is the most preferred.
The contracts are repriced when the leases expire. Hyperscalers tend to sign longer leases of between 10 to 15 years. Colocation customers usually commit for a shorter contract period of 1 to 5 years.
For example, in January 2026, Digital Core REIT signed a 10-year agreement with a global cloud service provider to occupy the facility at 8217 Linton Hall Road. On the other hand, Keppel DC REIT’s portfolio of colocation contract has a weighted average lease expiry (WALE) of 3.2 years as at 31 December 2025.
Demand drivers of Data Centres
While cloud computing, data generation and storage are long-term demand drivers for data centres, artificial intelligence and machine learning are powerful catalysts since 2022. The trend is set to continue, supported by several structural factors.
#1 – Rising demand for cloud computing
Cloud computing is the biggest data centre demand driver. Enterprises are still shifting workloads from on-premise systems to public and hybrid cloud. This migration creates sustained demand for both colocation and hyperscale capacity.
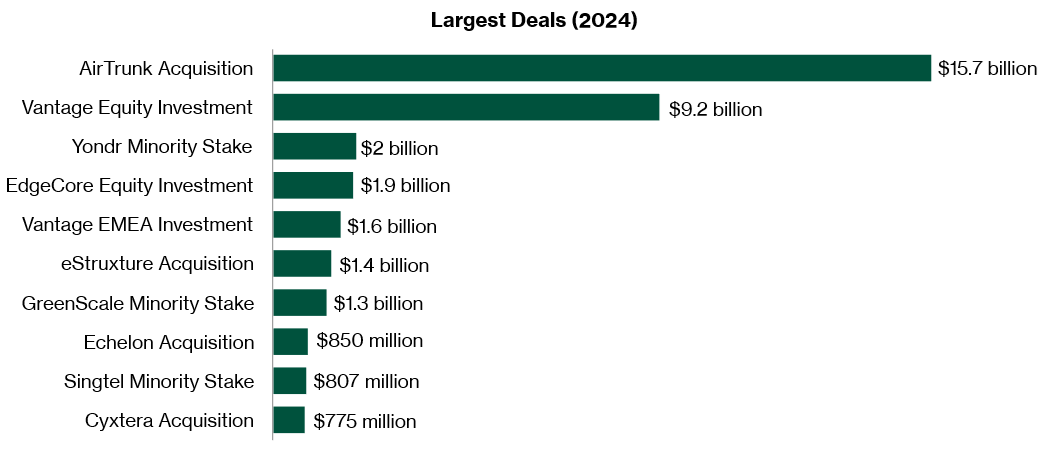
As more organizations move workloads to the public cloud for scalability and convenience, hyperscalers will continue to expand across markets. The structural demand drivers continue to fuel growth in the data‑centre industry, attracting significant capital.
Hyperscalers are securing new development projects, creating additional cloud regions, and upgrading digital infrastructure to serve clients and meet rising demand.
The big three cloud providers—Amazon Web Services, Microsoft Azure, and Google Cloud—keep expanding their offerings, adding more edge and core services. This strengthens their role as the go-to platforms for large enterprises and government agencies.
Public cloud providers drive most of the world’s data centre leasing, in both self-build and colocation capacity. They accounted for 40% of leasing transactions in 2024 and roughly 36% of total leasing activity to date.
Combined cloud revenues for the four major US cloud providers — Microsoft, Amazon Web Services, Google, and Oracle — grew 16% in 2024 and have expanded at a 23% CAGR over the past four years.
The global cloud computing market size is estimated to reach US$2,390 billion by 2030, registering to grow at a CAGR 20.4% from 2025 to 2030.
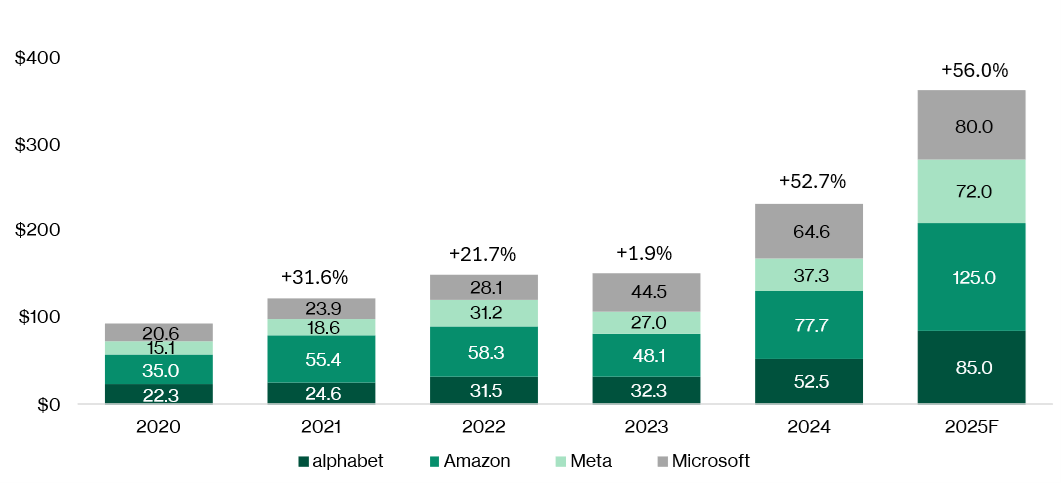
Notably, major tech giants like Alphabet, Amazon, Meta, and Microsoft more than tripled their capital expenditures from around US$93 billion in 2020 to approximately US$362 billion in 2025.
#2 – Artificial intelligence models
AI has also become a key driver in data centre demand worldwide. The increase in capital expenditure is also mainly AI-driven, with heavy investment in data centres, high-performance GPU infrastructure, and cloud capabilities to support the next wave of AI innovation.
AI-specific infrastructure is growing rapidly. In the US, OpenAI’s $500 billion “Stargate” project aims to build next-generation AI facilities nationwide. Japan plans to fund domestic AI chips and edge infrastructure to reduce reliance on foreign technology. In the UK, government involvement in data centre planning shows a commitment to boosting AI capabilities and research infrastructure.
Generative AI, including tools for creating images, videos, text, and chat, is being widely adopted by major companies worldwide. Models like OpenAI’s DALL-E and ChatGPT are key drivers of this AI revolution.
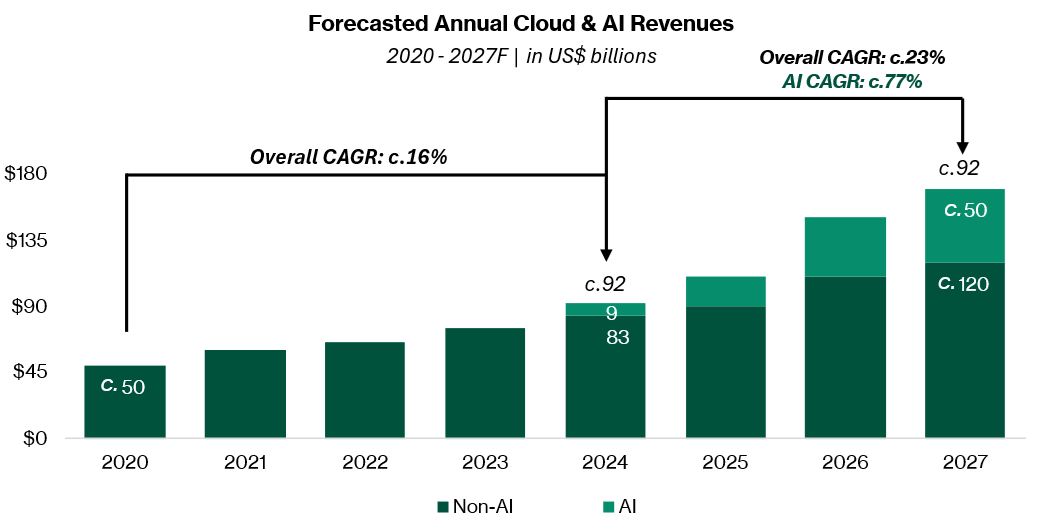
As AI models become larger and more powerful, they require more data centre capacity. Generative AI is driving significant growth in the global data centre market.
AI workloads, particularly generative AI, are projected to account for approximately 40% of total data centre demand through 2030. AI workloads consume vastly more electricity than traditional computing, as they require fundamentally different hardware configurations with exponentially higher power consumption. The computational intensity of AI model training is staggering as training GPT-4 alone required around 30 megawatts of power.
Cloud and AI revenues are expected to grow at a 23.3% CAGR from 2024 to 2028, up from 16.4% from 2020 to 2024, with AI-related revenue alone projected to grow 72.5% annually over the same period.
#3 – Meeting regulatory requirements
As data centre markets mature, regulations tend to tighten. Established markets worldwide face measures such as temporary halts on new projects, stricter sustainability requirements, limits on noise and environmental impact, and restrictions on suitable locations for building data centres. Stringent regulations in established market could persuade companies to explore emerging markets.
Many countries now require certain types of data to remain within national borders. This drives demand for local data centres:
- Local storage mandates: sensitive data (financial, healthcare, government) must be stored domestically.
- Edge computing deployment: closer proximity to users is required to reduce latency while complying with local data laws.
- National security considerations: governments prefer domestic infrastructure to protect critical data from foreign access.
In Europe, growth in data centre market was partly to support compliance with data‑sovereignty regulations such as General Data Protection Regulation (GDPR).
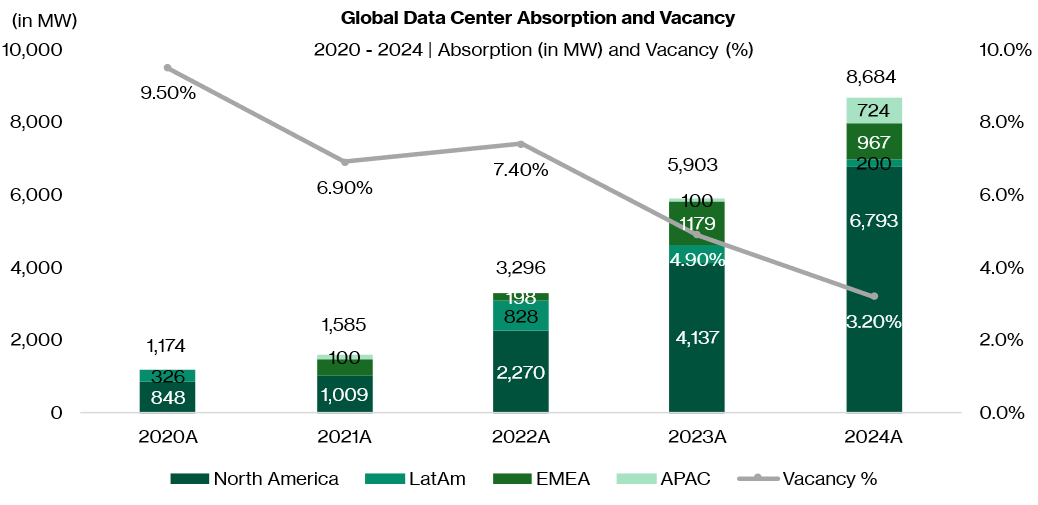
Demand, as represented by absorption, refers to the newly leased capacity each year, as measured in MW. North America has the highest demand for data centre, at 6,793 MW in 2024. Absorption refers to the new leases recorded and is a reflection of the demand for data centre capacity. As demand has outpaced new supply, vacancy rates have been declining since 2020. Among the regions, North America has seen particularly strong growth in data centre absorption.
#4 – 5G adoption
With rising 5G deployment, data centres are crucial for telecommunications infrastructure, processing calls, messages, and data for mobile and internet services. With 5G, edge data centres help bring computing resources closer to users for lower latency.
Example telecommunications or 5G networking companies include Verizon, AT&T, China Mobile, Comcast, and Vodafone.
#5 – Others
- Website, application and content hosting: Data centres host websites, applications, and mobile apps, ensuring they are available to users with high reliability, speed, and scalability. As of December 2024, approximately 33.0% of all websites are hosted on servers located in the United States. In addition, data centres power content delivery networks that cache and distribute media, enabling fast, high-quality streaming for videos, games, and other content. The rise of platforms like Netflix has pushed global internet traffic higher, driving additional demand for data centre capacity.
- Enterprise Resource Planning (ERP) and business applications: Data centres host ERP systems and business applications like finance and supply chain management. Users include SAP, Oracle and Workday.
- Data storage, backup and analytics: Data centres hold large volumes of information, supporting backup and disaster-recovery needs. This helps organizations maintain data integrity and meet regulatory requirements. Data centres power analytics platforms that process and analyse large datasets in fields like finance and healthcare, providing insights for data-driven decision-making. Example big data and analytics companies include Databricks, Snowflake and Palantir.
Key Data Centre Evaluation Metrics
Vacancy, rents, PUE, and IT load capacity are key metrics
For investors assessing data centre assets, several operating metrics are critical in determining the attractiveness and performance of the properties. These include vacancy rate, rental rate trend, power usage effectiveness (PUE) and IT load capacity.
For the REIT, they are asset owners and are likely to focus on vacancy rate and rental growth. For the operators, they may not own the assets and are focus on growth. As operators are providing a service, they do not have the avenue to pass on the operating expenses. They focus on PUE and rack density in order to optimise the profitability.
Vacancy Rate
Vacancy rate and rental rate are key operating metrics of data centres. Vacancy rate is the percentage of commissioned power that is currently available to be leased.
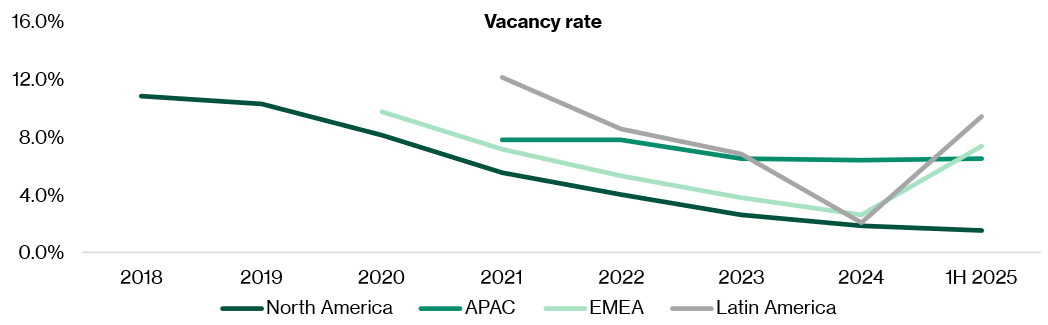
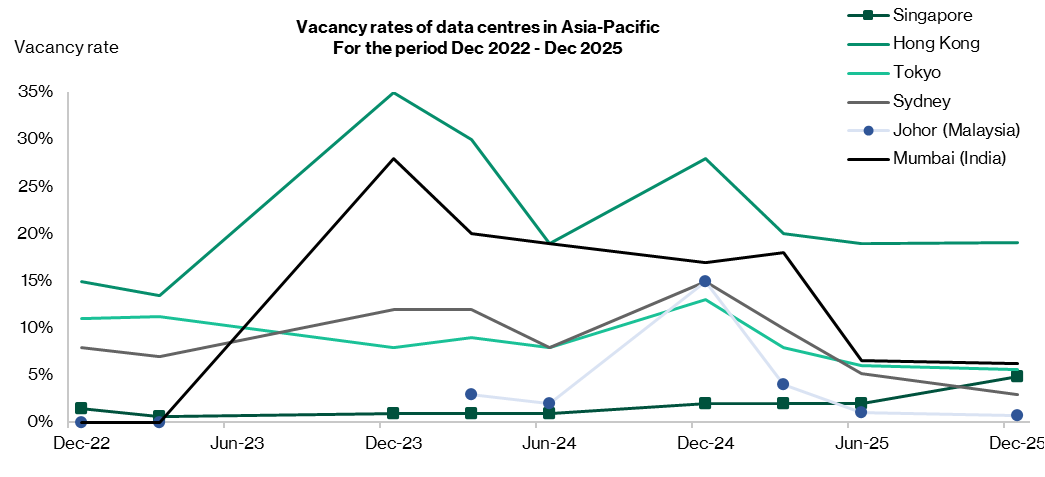
Vacancy rates are extremely tight. About 20 markets across the world have extremely tight capacity, with vacancy below 5%. Several markets reported vacancy rates below 1%.
Singapore remains one of the tightest markets globally. In late 2024, Singapore had only 7.2 MW of available capacity with a vacancy rate of about 1%, and by 1Q25, this had edged up only slightly to about 2% The market's overall vacancy rate stays tight at around 2%, with operators awaiting government approval of an additional 300 MW of capacity.
Rental Rate and Rental Growth
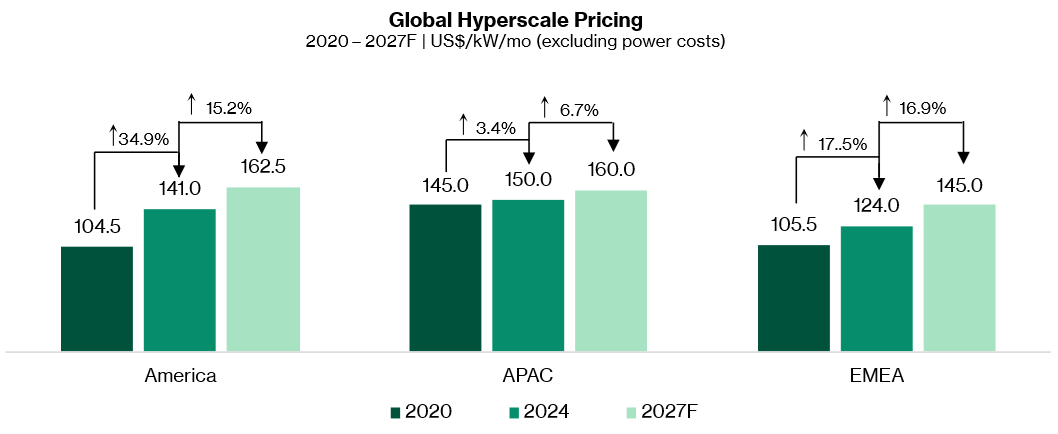
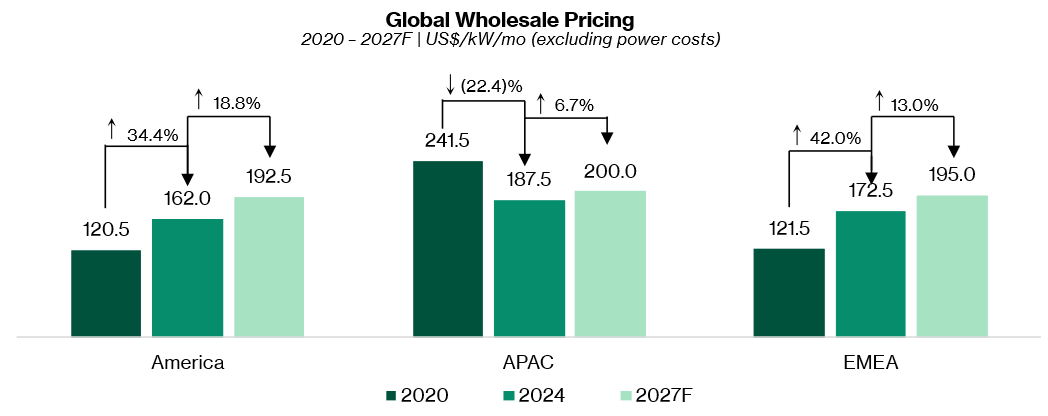
Rental rate refers to the monthly cost per kilowatt ($/kW/month) that data centre operators charge tenants for colocation and power. A higher occupancy rate and rental rates translate to stronger revenue.
To offset inflation, the agreements with tenants have contracted rental escalations per annum during the relevant lease periods.
Pricing trends have generally been on a uptrend and expected to grow in the medium term. Hyperscale prices are expected to rise by 15.2% in the Americas, 6.7% in APAC and 16.9% in EMEA between 2024 and 2027F. Wholesale prices are similarly expected to rise across all three regions, with increases of 18.8% in the Americas, 6.7% in APAC and 13.0% in EMEA between 2024 and 2027F.
Power usage effectiveness (PUE)
PUE (Power Usage Effectiveness) is a key metric used to measure the energy efficiency of a data centre.
PUE measures the ratio of the total power consumption of data centre to the energy solely used by its IT equipment. The closer the ratio is to 1.0, the more efficient the data centre.
Launched in May 2024, the Singapore government’s Green Data Centre Roadmap targets for all Singapore data centres to achieve a PUE below 1.3 at 100% IT load in the next 10 years. According to Uptime Institute, the average PUE across global data centres is around 1.55. In Singapore, our facilities’ PUE ranges from 1.2 to 1.9, with an average of around 1.47. Newly built data centres, however, achieve a PUE of about 1.35.
IT load capacity and rack density
IT load capacity measure the maximum amount of electrical power that a data centre can supply to IT equipment, expressed through the Density metric.
Power density refers to the amount of electrical power supplied to a specific area within the data centre, usually measured in kilowatts per square foot (kW/sq ft) or kilowatts per rack (kW/rack).
Rack density refers to the physical concentration of servers, storage, and networking equipment within a rack, typically measured as the number of units (U) of equipment installed per rack.
Rack density determines the physical space utilization in the data centre. It impacts cooling and airflow design, as densely packed racks generate more heat.
Rack density has been climbing steadily, and that shift matters for valuation. In 2010, most data centres ran at 4–5 kW per rack. By 2020, densities had doubled to 8–10 kW. New completions today average 12–15 kW, and operators are still chasing demand as customers push peak loads toward 16–20 kW.
What this really means is that facilities built for higher densities can command better economics. They support more compute per square foot, attract AI-heavy workloads, and justify higher pricing because the power and cooling backbone is tougher to replicate.
In hyperscale environments above 10 MW, roughly half of operators already use racks above 20 kW, and close to one in five run beyond 40 kW. AI applications, particularly those involving large language models (LLMs) and deep learning (DL), need significantly more computational power. This has led to the development of high-density racks that can support 60-120 kW or more per rack.
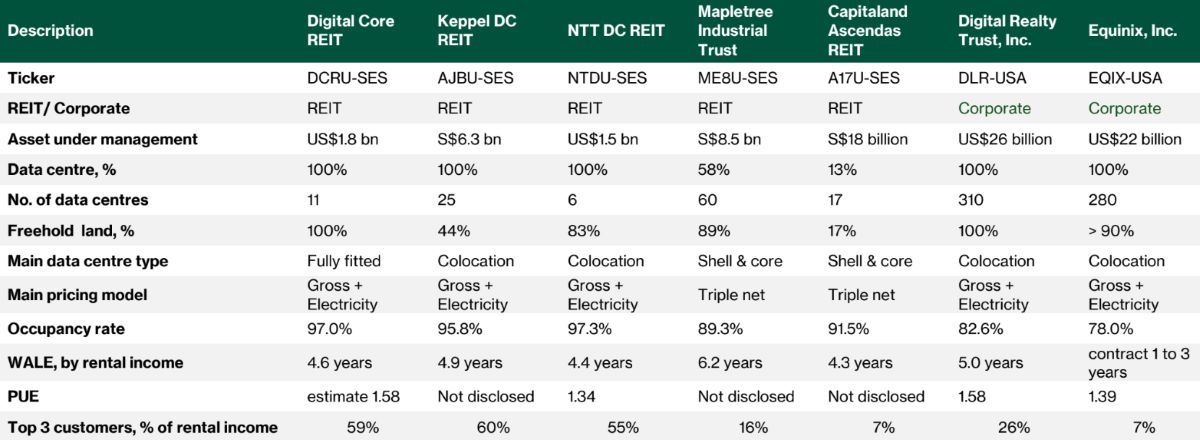
Note: 1. Mapletree Industrial Trust : statistics based on North America portfolio
2. Capitaland Ascendas REIT : post the Japan DC acquisition (49% interest), in Greater Osaka
3. Keppel DC REIT : Due to confidentiality reason, the effective PUE has been excluded in disclosure.
4. Equinix does not disclose WALE as a standard metric. Customer contracts are typically colocation agreements of 1 to 3 years.
For investors who are keen to look beyond dividends and be involved in Singapore's growth opportunities, we believe there are four long-term themes : energy security, AI and data centres, government spending, and Singapore’s rise as a wealth hub.
For investors who want to understand the broader AI opportunity, you can read our guide on how to invest in AI, where we look at the different parts of the AI value chain beyond just the big US technology stocks.
You can also read our take on whether the AI rally has gone too far, where we discuss the reasons the rally may be real, as well as the warning signs investors should watch.
Learn more about data centre sector by downloading our guide for investors here.
Follow us on Telegram, Youtube, Facebook and Instagram to get the latest financial insights.
Important Disclosures
Analyst Certification and Disclosures
The analyst(s) named in this report certifies that (i) all views expressed in this report accurately reflect the personal views of the analyst(s) with regard to any and all of the subject securities and companies mentioned in this report and (ii) no part of the compensation of the analyst(s) was, is, or will be, directly or indirectly, related to the specific views expressed by that analyst herein. The analyst(s) named in this report (or their associates) does not have a financial interest in the corporation(s) mentioned in this report.
An associate is defined as (i) the spouse, or any minor child (natural or adopted) or minor step-child, of the analyst; (ii) the trustee of a trust of which the analyst, his spouse, minor child (natural or adopted) or minor step-child, is a beneficiary or discretionary object; or (iii) another person accustomed or obliged to act in accordance with the directions or instructions of the analyst.
Company Disclosure
Global Wealth Technology Pte Ltd (“Beansprout”) does not have any financial interest in the corporation(s) mentioned in this report.
Beansprout was appointed by Singapore Exchange Limited via a third party platform provider and received monetary compensation from SGX via such third party platform provider to provide independent research. Beansprout is solely responsible for the contents of this document. Singapore Exchange Limited and/or its affiliates, including Singapore Exchange Regulation Pte. Ltd. (collectively, SGX Group Companies) assume no responsibility (whether under contract, tort (including negligence) or otherwise), directly or indirectly, for the contents of this document. The general disclaimers and jurisdiction specific disclaimers found on SGX’s website at http://www.sgx.com/terms-use are also incorporated into and applicable to this document.
Disclaimer
This report is provided by Beansprout for the use of intended recipients only and may not be reproduced, in whole or in part, or delivered or transmitted to any other person without our prior written consent. By accepting this report, the recipient agrees to be bound by the terms and limitations set out herein.
You acknowledge that this document is provided for general information purposes only. Nothing in this document shall be construed as a recommendation to purchase, sell, or hold any security or other investment, or to pursue any investment style or strategy. Nothing in this document shall be construed as advice that purports to be tailored to your needs or the needs of any person or company receiving the advice. The information in this document is intended for general circulation only and does not constitute investment advice. Nothing in this document is published with regard to the specific investment objectives, financial situation and particular needs of any person who may receive the information.
Nothing in this document shall be construed as, or form part of, any offer for sale or subscription of or solicitation or invitation of any offer to buy or subscribe for any securities. The data and information made available in this document are of a general nature and do not purport, and shall not in any way be deemed, to constitute an offer or provision of any professional or expert advice, including without limitation any financial, investment, legal, accounting or tax advice, and shall not be relied upon by you in that regard. You should at all times consult a qualified expert or professional adviser to obtain advice and independent verification of the information and data contained herein before acting on it. Any financial or investment information in this document are intended to be for your general information only. You should not rely upon such information in making any particular investment or other decision which should only be made after consulting with a fully qualified financial adviser. Such information do not nor are they intended to constitute any form of financial or investment advice, opinion or recommendation about any investment product, or any inducement or invitation relating to any of the products listed or referred to. Any arrangement made between you and a third party named on or linked to from these pages is at your sole risk and responsibility.
You acknowledge that Beansprout is under no obligation to exercise editorial control over, and to review, edit or amend any data, information, materials or contents of any content in this document. You agree that all statements, offers, information, opinions, materials, content in this document should be used, accepted and relied upon only with care and discretion and at your own risk, and Beansprout shall not be responsible for any loss, damage or liability incurred by you arising from such use or reliance.
This document (including all information and materials contained in this document) is provided “as is”. Although the material in this document is based upon information that Beansprout considers reliable and endeavours to keep current, Beansprout does not assure that this material is accurate, current or complete and is not providing any warranties or representations regarding the material contained in this document. All opinions contained herein constitute the views of the analyst(s) named in this report, they are subject to change without notice and are not intended to provide the sole basis of any evaluation of the subject securities and companies mentioned in this report. Any reference to past performance should not be taken as an indication of future performance. To the fullest extent permissible pursuant to applicable law, Beansprout disclaims all warranties and/or representations of any kind with regard to this document, including but not limited to any implied warranties of merchantability, non-infringement of third-party rights, or fitness for a particular purpose.
Beansprout does not warrant, either expressly or impliedly, the accuracy or completeness of the information, text, graphics, links or other items contained in this document. Neither Beansprout nor any of its affiliates, directors, employees or other representatives will be liable for any damages, losses or liabilities of any kind arising out of or in connection with the use of this document. To the best of Beansprout’s knowledge, this document does not contain and is not based on any non-public, material information. The information in this document is not intended for distribution to, or use by, any person or entity in any jurisdiction where such distribution or use would be contrary to law or regulation, or which would subject Beansprout to any registration requirement within such jurisdiction or country. Beansprout is not licensed or regulated by any authority in any jurisdiction or country to provide the information in this document.
As a condition of your use of this document, you agree to indemnify, defend and hold harmless Beansprout and its affiliates, and their respective officers, directors, employees, members, managing members, managers, agents, representatives, successors and assigns from and against any and all actions, causes of action, claims, charges, cost, demands, expenses and damages (including attorneys’ fees and expenses), losses and liabilities or other expenses of any kind that arise directly or indirectly out of or from, arising out of or in connection with violation of these terms, use of this document, violation of the rights of any third party, acts, omissions or negligence of third parties, their directors, employees or agents. To the extent permitted by law, Beansprout shall not be liable to you, any other person, or organization, for any direct, indirect, special, punitive, exemplary, incidental or consequential damages, whether in contract, tort (including negligence), or otherwise, arising in any way from, or in connection with, the use of this document and/or its content. This includes, without limitation, liability for any act or omission in reliance on the information in this document. Beansprout expressly disclaims and excludes all warranties, conditions, representations and terms not expressly set out in this User Agreement, whether express, implied or statutory, with regard to this document and its content, including any implied warranties or representations about the accuracy or completeness of this document and the content, suitability and general availability, or whether it is free from error.
If these terms or any part of them is understood to be illegal, invalid or otherwise unenforceable under the laws of any state or country in which these terms are intended to be effective, then to the extent that they are illegal, invalid or unenforceable, they shall in that state or country be treated as severed and deleted from these terms and the remaining terms shall survive and remain fully intact and in effect and will continue to be binding and enforceable in that state or country.
These terms, as well as any claims arising from or related thereto, are governed by the laws of Singapore without reference to the principles of conflicts of laws thereof. You agree to submit to the personal and exclusive jurisdiction of the courts of Singapore with respect to all disputes arising out of or related to this Agreement. Beansprout and you each hereby irrevocably consent to the jurisdiction of such courts, and each Party hereby waives any claim or defence that such forum is not convenient or proper.
Read also
Gain financial insights in minutes
Subscribe to our free weekly newsletter for more insights to grow your wealth
Most Popular

Comments
0 comments