3 Singapore REITs with dividend yields above 6%. More attractive after the March pullback?
REITs
By Gerald Wong, CFA • 14 Mar 2026
Why trust Beansprout? We’ve been awarded Best Investment Website at the SIAS Investors’ Choice Awards 2025
'%3e%3cpath%20fill-rule='evenodd'%20clip-rule='evenodd'%20d='M17.64%209.20455C17.64%208.56637%2017.5827%207.95273%2017.4764%207.36364H9V10.845H13.8436C13.635%2011.97%2013.0009%2012.9232%2012.0477%2013.5614V15.8195H14.9564C16.6582%2014.2527%2017.64%2011.9455%2017.64%209.20455V9.20455Z'%20fill='%234285F4'/%3e%3cpath%20fill-rule='evenodd'%20clip-rule='evenodd'%20d='M9%2018C11.43%2018%2013.4673%2017.1941%2014.9564%2015.8195L12.0477%2013.5614C11.2418%2014.1014%2010.2109%2014.4205%209%2014.4205C6.65591%2014.4205%204.67182%2012.8373%203.96409%2010.71H0.957275V13.0418C2.43818%2015.9832%205.48182%2018%209%2018V18Z'%20fill='%2334A853'/%3e%3cpath%20fill-rule='evenodd'%20clip-rule='evenodd'%20d='M3.96409%2010.71C3.78409%2010.17%203.68182%209.59318%203.68182%209C3.68182%208.40682%203.78409%207.83%203.96409%207.29V4.95818H0.957273C0.347727%206.17318%200%207.54773%200%209C0%2010.4523%200.347727%2011.8268%200.957273%2013.0418L3.96409%2010.71V10.71Z'%20fill='%23FBBC05'/%3e%3cpath%20fill-rule='evenodd'%20clip-rule='evenodd'%20d='M9%203.57955C10.3214%203.57955%2011.5077%204.03364%2012.4405%204.92545L15.0218%202.34409C13.4632%200.891818%2011.4259%200%209%200C5.48182%200%202.43818%202.01682%200.957275%204.95818L3.96409%207.29C4.67182%205.16273%206.65591%203.57955%209%203.57955V3.57955Z'%20fill='%23EA4335'/%3e%3c/g%3e%3cdefs%3e%3cclipPath%20id='clip0_0_2849'%3e%3crect%20width='18'%20height='18'%20fill='white'/%3e%3c/clipPath%3e%3c/defs%3e%3c/svg%3e)
Make Beansprout your preferred source on Google
Add us on Google to see more of our insights in your search results
These 3 Singapore REITs now yield above 6% after the March pullback. We look at whether their dividends are attractive and sustainable for income investors.
What happened?
Singapore REITs dipped in March 2026.
With sentiment turning more cautious, many in the Beansprout community have been asking whether this has created opportunities among Singapore REITs again.
We recently looked at Singapore blue chip stocks that offer dividend yields of above 5%. In particular, Singapore banks now also offer more attractive dividend yields, with DBS’ dividend yield at close to 6%.
This led me to wonder if there are Singapore REITs that also offer dividend yields of above 6% with the pullback.
In this article, we look whether the dividend yields of these REITs are sustainable, and what investors should watch before adding them to their portfolio for income.
3 Singapore REITs with dividend yields above 6% after March pullback
#1 - Mapletree Industrial Trust (SGX: ME8U)
Mapletree Industrial Trust is one of the larger industrial REITs in Singapore, with a portfolio spanning industrial properties in Singapore as well as data centre exposure in North America and Japan.
As at 31 December 2025, Mapletree Industrial Trust had total assets under management of S$8.5 billion across 79 properties in Singapore, 55 properties in North America, including 13 data centres held through a joint venture, and two properties in Japan.
This gives Mapletree Industrial Trust a different earnings profile from a purely Singapore-focused industrial REIT.
While its Singapore and Japan assets have continued to provide a relatively stable base, its North American portfolio has become a more important swing factor for distributions due to lease renewals, occupancy trends and US dollar movements.
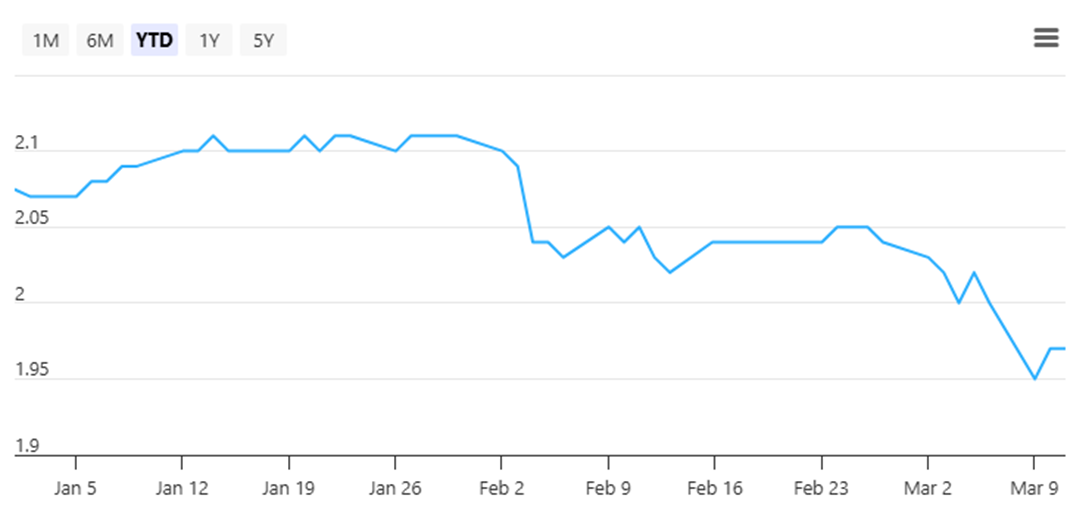
Following the recent sell-down, Mapletree Industrial Trust’s share price fell to S$1.96 as of 12 March 2026, leaving it down about 5.3% year-to-date.
In 3Q FY25/26, Mapletree Industrial Trust reported gross revenue of S$163.1 million and net property income of S$122.8 million, down 8.0% and 7.8% year-on-year respectively.
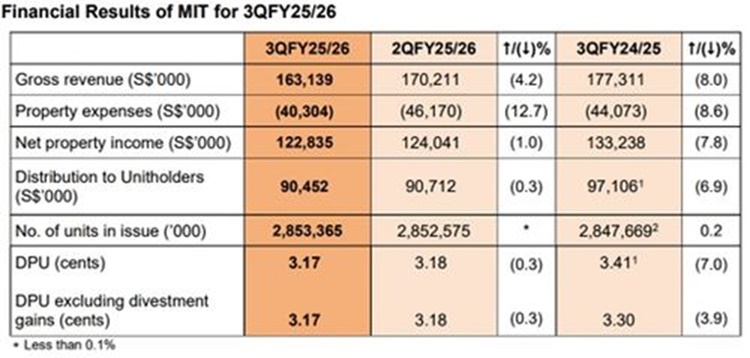
The weaker performance was mainly due to the absence of income from the divestment of three Singapore industrial properties in August 2025, lower contribution from the North American portfolio following lease non-renewals, and the depreciation of the US dollar against the Singapore dollar.
These were partly offset by contributions from the Tokyo mixed-use facility acquired in October 2024 and the completion of the final phase of fitting-out works at the Osaka data centre in May 2025.
Operationally, average overall portfolio occupancy in 3Q FY25/26 was 91.4%, slightly higher than 91.3% in the previous quarter.
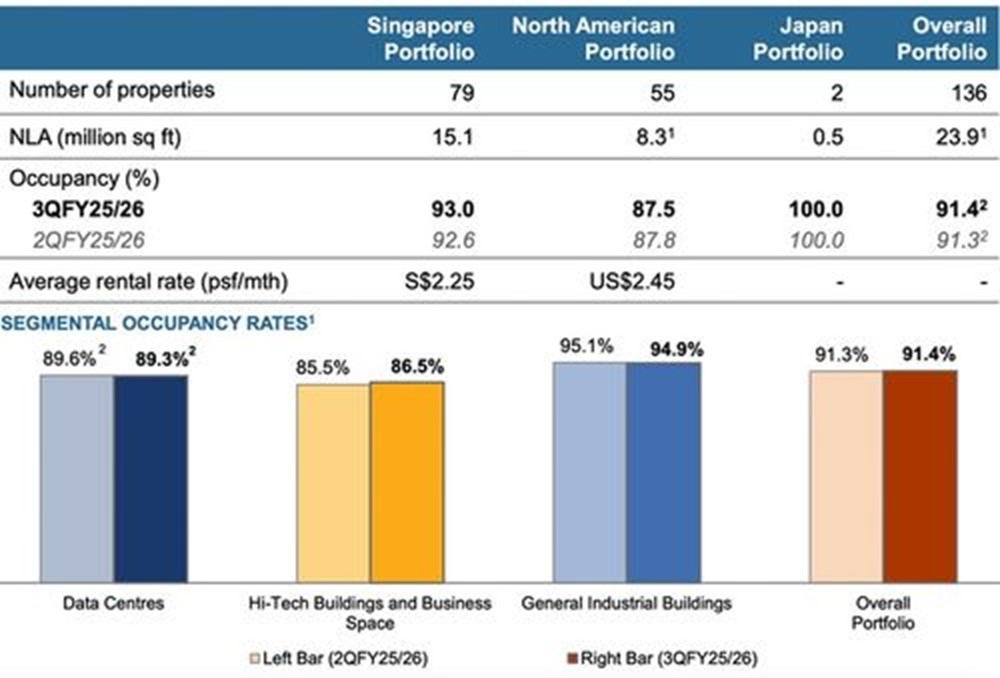
In Singapore, portfolio occupancy improved to 93.0%, while renewal leases in Singapore recorded a weighted average rental reversion of 7.1%, with positive reversions across both hi-tech/business space and general industrial assets.
MINT also saw a modest improvement in committed occupancy at Mapletree Hi-Tech Park @ Kallang Way, which rose 0.7 percentage points quarter-on-quarter to 65.1%.
In North America, the picture remains more mixed.
Occupancy slipped 0.3 percentage points quarter-on-quarter to 87.5%, weighed down by the non-renewal of a lease at 400 Holger Way in San Jose.
Even so, MINT continued to make leasing progress. It executed leases covering 217,062 square feet, or 3.0% of net lettable area, at a weighted average rental reversion of 3.1%.
It also secured a 13-year lease for a new tenant at the previously vacant 2055 East Technology Circle in Tempe, Arizona, helping to maintain the North America portfolio’s weighted average lease expiry at 6.2 years.
Management is prioritising longer leases to improve income visibility even as the portfolio works through near-term vacancies.
Another drag came from its second data centre joint venture. Cash distribution from the 50%-owned Mapletree Rosewood Data Centre Trust declined 14.6% year-on-year in 3Q FY25/26 due to the repricing of matured interest rate swaps, which resulted in higher borrowing costs.
Mapletree Industrial Trust reported aggregate leverage of 37.2% and an interest coverage ratio of 3.9 times as at 31 December 2025.
The average borrowing cost for 3Q FY25/26 rose to 3.1%, and management noted that borrowing costs may continue to increase as earlier interest rate swaps mature and are repriced at higher prevailing rates.
It has guided for borrowing costs of around 3.1% to 3.2% for FY26 and 3.3% to 3.4% for FY27, which could continue to weigh on distributions.
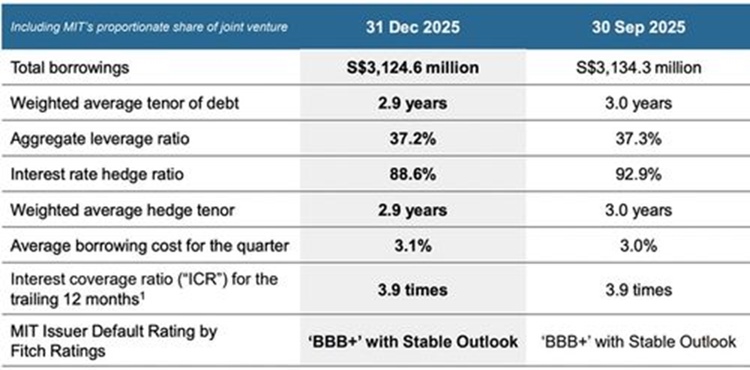
That said, about 91.4% of the amount available for distribution over the next 12 months is either denominated in Singapore dollars or hedged into Singapore dollars, which helps reduce currency volatility.
Looking ahead, management remains focused on improving occupancy in North America, while pursuing selective divestments in North America and Singapore to improve financial flexibility and redeploy capital into assets that can support more sustainable growth.
In particular, Mapletree Industrial Trust is still targeting S$500 million to S$600 million of divestments in North America over the next two years, with S$100 million to S$200 million planned for FY26 and S$400 million to S$500 million for FY27.
The assets earmarked for sale are mainly data centres that are currently vacant or have smaller power capacity, and are therefore seen as more vulnerable to non-renewal risk.
Over time, this could help rebalance the portfolio towards higher-growth data centre assets in Asia Pacific and Europe.
Mapletree Industrial Trust announced a DPU of 3.17 cents for 3Q FY25/26, down 7.0% from 3.41 cents in the previous year.
This is due to non renewal leases in the US and downtime in North American data centers despite strong rental reversions in the Singapore portfolio.
Based on its unit price of S$1.96 as of 12 March 2026, and consensus DPU estimate of S$0.128 for FY26, Mapletree Industrial Trust offers a forward dividend yield of approximately 6.5%.
Find out how much dividends you would have received as a shareholder of Mapletree Industrial Trust in the past 12 months with the calculator below.
Related links:
- Mapletree Industrial Trust share price history and share price target
- Mapletree Industrial Trust dividend history and dividend forecasts
#2 - Frasers Logistics & Commercial Trust (SGX: BUOU)
Frasers Logistics & Commercial Trust owns a diversified portfolio of logistics, industrial and commercial properties across five developed markets, namely Australia, Germany, the Netherlands, Singapore and the United Kingdom.
As at 31 December 2025, the portfolio comprised 113 properties with a total portfolio value of S$6.9 billion, with logistics and industrial assets making up 75.1% of the portfolio by value.
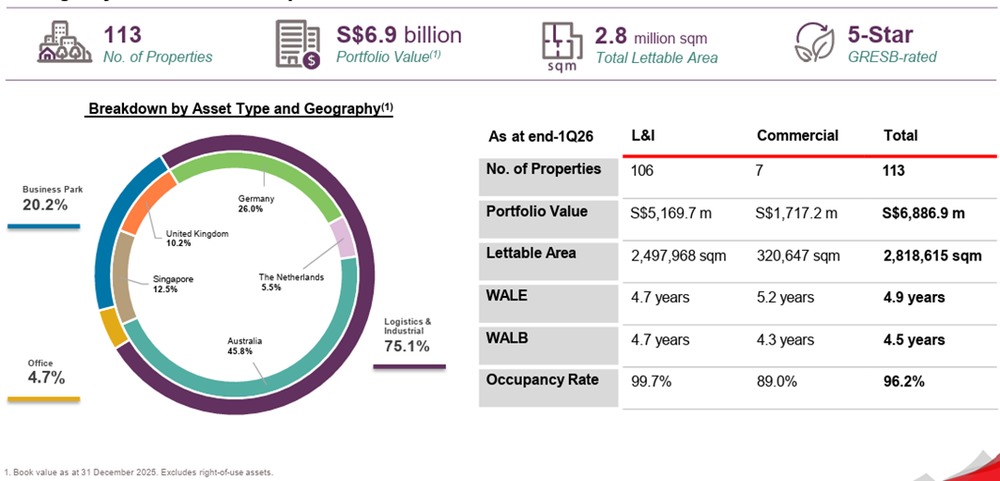
This gives Frasers Logistics & Commercial Trust a different earnings profile from a pure Singapore REIT. Its income is supported by diversification across multiple developed markets, but performance is also shaped by leasing conditions across different geographies and sectors.
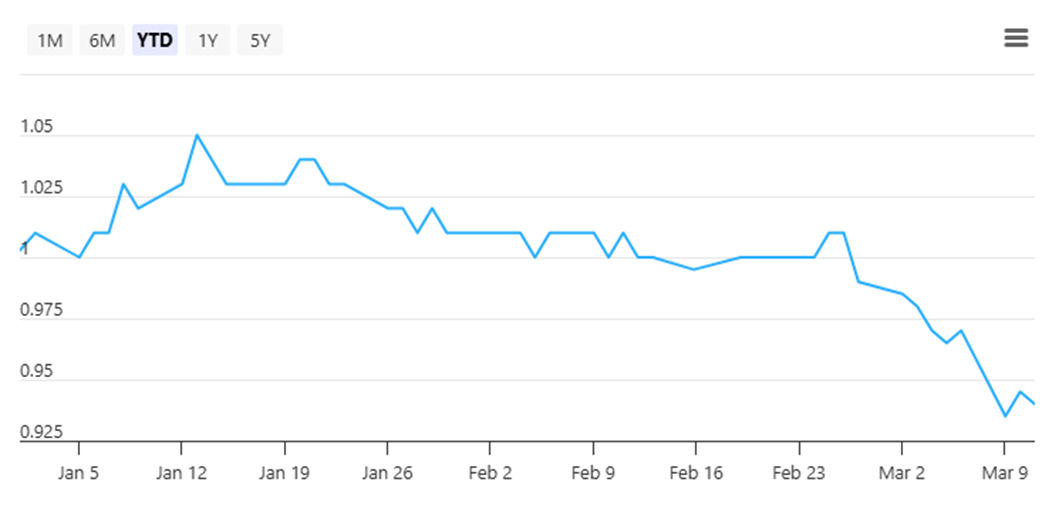
Frasers Logistics & Commercial Trust’s share price fell to S$0.93 as of 12 March 2026, which represents a -7.9% decline year-to-date.
Over the past year, the manager has continued to reshape the portfolio towards logistics and industrial properties, which remain the REIT’s main earnings stabiliser.
For FY2025, Frasers Logistics & Commercial Trust reported revenue of S$471.5 million and adjusted net property income of S$326.1 million, up 5.6% and 1.9% respectively from FY2024.
The increase was supported by leasing momentum and full-year contributions from four German logistics properties acquired in March 2024.
However, distributable income fell to S$224.7 million from S$255.5 million because of higher finance costs and higher tax expense.
Operationally, Frasers Logistics & Commercial Trust's portfolio remained fairly resilient, supported primarily by the strength of the logistics and industrial segment.
For FY2025, about 18.1% of the portfolio was committed, while portfolio average rental reversion came in at 5.0% on an incoming rent versus outgoing rent basis and 29.5% on an average rent versus average rent basis.
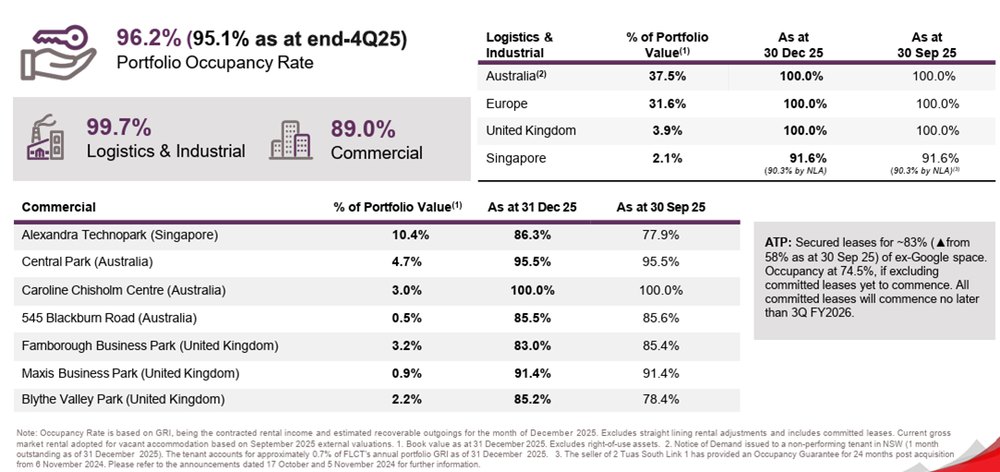
As at 30 September 2025, portfolio occupancy stood at 95.1%, with the logistics and industrial portfolio at 99.7% and the commercial portfolio at 86.1%.
The more recent 1Q FY2026 business update showed some further improvement, with overall occupancy rising to 96.2% and WALE at 4.9 years as at 31 December 2025.
In 1Q FY2026, logistics and industrial (L&I) rental reversions were strong at 13.4% on an incoming versus outgoing rent basis and 36.4% on an average versus average basis, with occupancy remaining near full at 99.7%.
This suggests Frasers Logistics & Commercial Trust's core L&I assets are still benefiting from healthy leasing conditions and are helping to anchor portfolio earnings.
By contrast, the commercial portfolio remains the weaker part of the story.
Commercial occupancy improved to 89.0%, but rental reversions were still negative at -3.3% on an incoming versus outgoing basis and -1.6% on an average versus average basis.
This was largely due to Alexandra Technopark (ATP) in Singapore, even though leases renewed in the UK and Australia recorded positive reversions.
A key near-term issue to watch is whether commercial reversions in Singapore have bottomed, and how quickly remaining vacant space can be backfilled.
That said, there are some encouraging signs.
The backfilling of the former Google space has picked up pace, with committed occupancy now at around 83%, representing an improvement of about 25 percentage points quarter-on-quarter.
These committed leases are expected to commence over the coming two quarters, which could help support occupancy and reduce drag from the commercial segment.
On the balance sheet, FLCT reported aggregate leverage of 34.8%, interest coverage of 4.1 times, and cost of borrowings of 3.1% as at 31 December 2025.
While leverage was up 90 basis points quarter-on-quarter, it remains healthy and leaves FLCT with room to pursue acquisitions if opportunities arise.
The REIT also retained meaningful financial flexibility, with about S$592 million of debt headroom to a 40% leverage ceiling.
Frasers Logistics & Commercial Trust had S$251 million of undrawn committed facilities available to meet upcoming debt obligations of S$60 million due in 2Q FY2026.
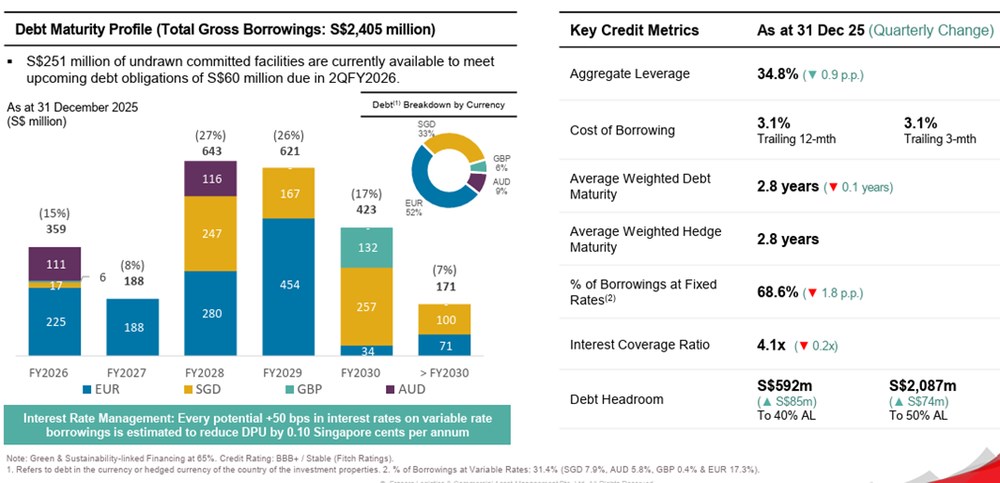
At the same time, refinancing is worth watching.
Management disclosed that every 50 basis point increase in interest rates on variable-rate borrowings would reduce DPU by around 0.10 Singapore cents per annum.
With about 15% of its loan book due for refinancing in FY2026, investors are likely to watch refinancing efforts closely, especially following the recent 25 basis point benchmark rate increase by the Reserve Bank of Australia.
Strategically, FLCT has continued to tilt further towards logistics and industrial assets.
In FY2025, it completed the acquisition of 2 Tuas South Link 1 in Singapore and divested 357 Collins Street in Melbourne.
Management said these moves should strengthen income contribution from Singapore assets, reduce foreign exchange exposure, and improve financial flexibility to pursue higher-quality logistics and industrial opportunities.
The DPU for 2H FY2025 was 2.95 cents. Together with the 1H FY2025 DPU of 3.00 cents, FLCT’s full-year FY2025 DPU came in at 5.95 cents.
Based on its share price of S$0.94 as of 12 March 2026 and consensus DPU of S$0.058 for FY26, FLCT offers a forward dividend yield of 6.2%.
Find out how much dividends you would have received as a shareholder of Frasers Logistics & Commercial Trust in the past 12 months with the calculator below.
Related links:
- Frasers Logistics & Commercial Trust share price history and share price target
- Frasers Logistics & Commercial Trust dividend history and dividend forecast
#3 - CapitaLand India Trust (SGX: CY6U)
CapitaLand India Trust, or CLINT, provides exposure to India’s commercial real estate through a portfolio of business parks, logistics and industrial assets, and a growing data centre platform.
As at 31 December 2025, it had assets under management of S$3.8 billion, including eight IT business parks, three industrial facilities, one logistics park and four data centre developments in India.
This makes it structurally different from Singapore-centric REITs as its returns are shaped not only by rental demand, but also by development completion cycles, capital recycling and currency movements between the Indian rupee and the Singapore dollar.
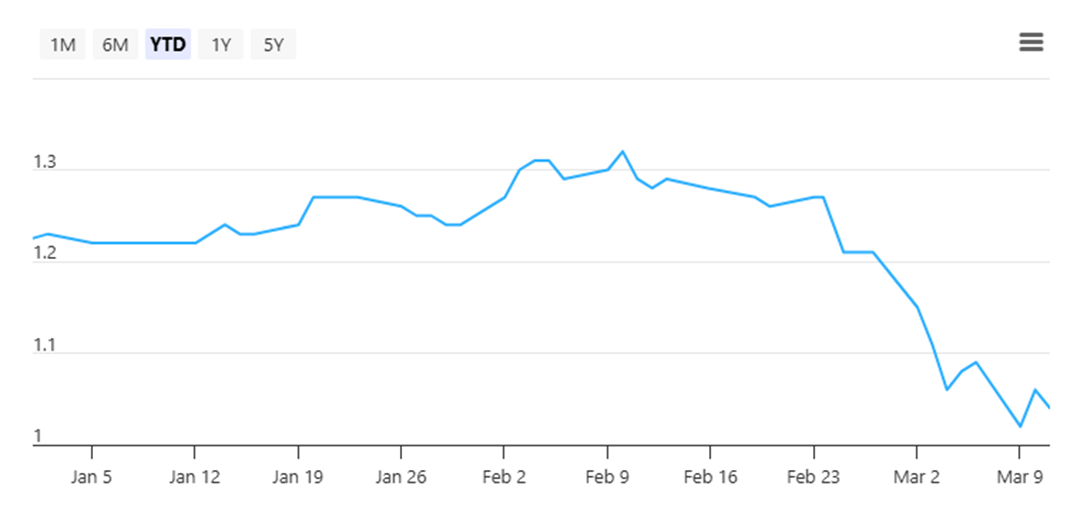
CapitaLand India Trust suffered a sharp sell-down to S$1.02 as of 12 March 2026, representing a decline of 17.0% year-to-date.
In 2H 2025, CapitaLand India Trust reported total property income rising 2% year-on-year to S$145.1 million, and net property income rising 9% to S$111.3 million.
Income available for distribution increased 25% to S$59.3 million, while DPU for the half year rose 22% year-on-year to 3.90 cents.
For the full year of FY2025, CapitaLand India Trust reported total property income of S$294.4 million and net property income of S$224.9 million.
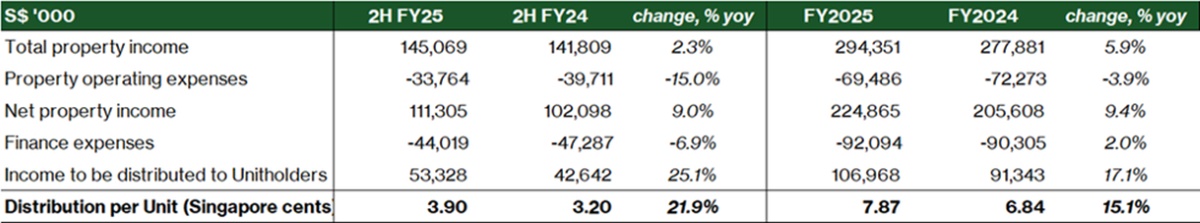
Full-year DPU grew 15% year-on-year to 7.87 cents.
The improvement was supported by higher rental income from existing properties, contributions from newly completed properties, including MTB 6 in Bangalore, CyberVale Free Trade Warehousing Zone and Navi Mumbai data centre Tower 1, as well as full-year contributions from assets acquired earlier such as aVance II, Pune and Building Q2.
CapitaLand India Trust's forward purchase strategy also continues to be an important growth engine.
As at end-2025, it had six forward purchase assets under development, while interest-bearing long-term receivables rose to S$381.6 million, providing a meaningful contribution to interest income during the development phase.
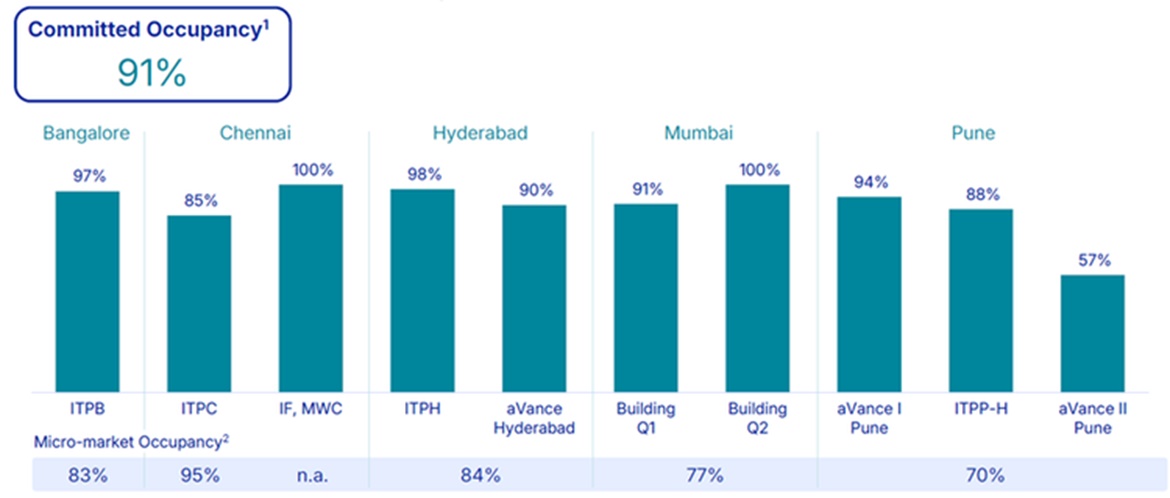
On portfolio operations, CapitaLand India Trust reported committed occupancy of 91.0% as at 31 December 2025 and strong rental reversion of 21.0% over the last 12 months, led by assets in Hyderabad and Bangalore.
The weighted average lease term stood at 6.6 years, while weighted average lease expiry was 3.4 years.
CapitaLand India Trust reported gearing of 39.6% and an interest coverage ratio of 2.7 times as at 31 December 2025.
Management also highlighted that 72.6% of borrowings were on fixed interest rates, 53% were hedged into INR, and debt headroom stood at S$967 million.
During the year, CapitaLand India Trust diversified its funding sources through perpetual securities and onshore borrowing in India, with management saying this should help tap lower interest rates in India and improve long-term savings on interest and tax costs.
Portfolio valuation also increased 6.5% year-on-year to S$3.8 billion, reflecting in part the progress of its data centre developments.
A key strategic growth pillar remains its data centre platform.
CapitaLand India Trust completed Tower 1 of its Navi Mumbai data centre in August 2025 and began progressive handover to a hyperscaler tenant, while Tower 2 has been fully leased to the same tenant and is expected to be completed by December 2026.
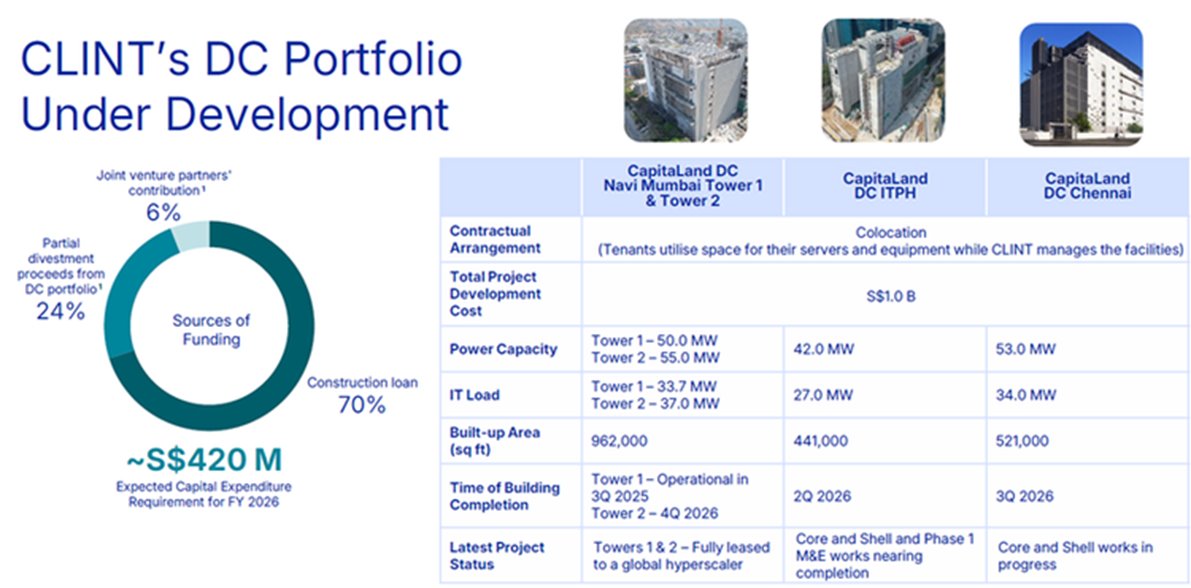
To support funding flexibility, it also announced the divestment of a 20.2% stake in three data centres under development for about S$99.7 million, with the transaction expected to complete by end February 2026..
Following this, the data centre portfolio is now fully funded through construction loans, partial divestment and contributions from joint venture partners.
To fund future growth, CapitaLand India Trust completed a private placement in February 2026, raising about S$150.0 million through the issuance of 124.17 million new units at S$1.208 each. The placement closed on 25 February 2026, and the new units were issued on 5 March 2026.
The proceeds will mainly be used to fund the development of Building 1, Ebisu in Bengaluru and The Beacon at Nagawara in Bangalore, both under its forward purchase structure.
These projects offer an interest coupon of at least 11.5% during the development period, and are expected to be acquired by CapitaLand India Trust once completed and stabilised, at estimated rental yields of 9% to 10%.
On a pro forma basis, management said the placement would have been distribution accretive for FY2025, while also reducing gearing to 36.8%.
CapitaLand India Trust reported 22% year-on-year DPU growth in 2H FY2025 to 3.90 cents.
For the full year of FY2025, DPU grew 15% year-on-year to 7.87 cents. In addition, CLINT announced an advanced distribution of 1.44 cents per unit following its private placement of 124.17 million new units at S$1.208 each.
Including this advanced distribution, CapitaLand India Trust's total distributions over the past 12 months amount to 9.31 cents per unit.
The advanced distribution covers the period from 1 January 2026 to 4 March 2026, before the new units issued under the private placement start to rank for distributions.
Consensus is expecting a DPU of S$0.083 for FY26, which translates to a forward dividend yield of 8.1%. Based on the advanced distribution, the consensus DPU for FY26 remains on track.
Find out how much dividends you would have received as a shareholder of CapitaLand India Trust in the past 12 months with the calculator below.
Related links:
- CapitaLand India Trust - Higher DPU from improved operating performance
- CapitaLand India Trust share price and share price target
- CapitaLand India Trust dividend history and forecast
What Would Beansprout Do?
With the recent market volatility, I have been looking at ways to bolster my income portfolio with stocks and REITs that offer a dividend yield of above 5%.
After the March 2026 pullback in Singapore REITs, Mapletree Industrial Trust, Frasers Logistics & Commercial Trust, and CapitaLand India Trust are all offering dividend yields above 6%.
This would be above the dividend yield of the STI, and significantly higher than the 6-month Singapore T-bill yield.
Even though the headline yields look attractive, the reasons behind those yields are quite different. To better understand the quality of the income, it helps to look at factors such as recent DPU trends, gearing levels, refinancing risk, and what is actually driving the distributions. I'd also be looking out for whether the recent spike in oil prices will lead to higher interest rates once again.
Mapletree Industrial Trust offers a forward yield of around 6.5%, but the recent decline in DPU highlights that its North America portfolio continues to weigh on performance. A clearer recovery in leasing and occupancy there would strengthen the income outlook.
Frasers Logistics & Commercial Trust offers a forward dividend yield of 6.2% through its exposure to a more diversified developed-markets portfolio across logistics and commercial assets. While the REIT has a steadier balance sheet, DPU growth has been softer and the performance of the commercial segment remains an area to monitor.
Amongst the three REITs, CapitaLand India Trust stands out with the highest forward dividend yield of 8.1% and is the only REIT which saw growth in distribution per unit in the latest fiscal year. This is supported by stronger operating performance and contributions from development projects. However, I would need to be comfortable with its exposure to India office demand and currency movements to invest in CapitaLand India Trust.
| Stock | The good | Key risks |
| Mapletree Industrial Trust | • Forward dividend yield of about 6.5% • Large and diversified industrial portfolio with Singapore, Japan and North America exposure • Singapore occupancy and rental reversions remained positive | • 3Q FY25/26 DPU fell 7.0% YoY to 3.17 cents • North America leasing remains a key swing factor • Borrowing costs may rise as interest rate hedges roll off |
| Frasers Logistics & Commercial Trust | • Forward dividend yield of about 6.2% • Better balance sheet metrics with gearing at 34.8% and interest coverage at 4.1x • Portfolio occupancy improved to 96.2% in 1Q FY2026 | • FY2025 dividend per unit was down about 12% YoY to 5.95 cents • Commercial assets still add some earnings uncertainty • Variable-rate debt remains sensitive to higher rates • Watch for refinancing risk with part of the loan book due in FY2026 |
| CapitaLand India Trust | • Highest forward dividend yield of the three at about 8.1% • FY2025 DPU rose 15% YoY to 7.87 cents, with an additional advanced distribution of 1.44 cents per unit • Growth supported by stronger operating performance and contributions from new assets and data centres | • Gearing of 39.6% and interest coverage of 2.7x are not low • More exposed to India office demand, development execution and INR-SGD currency movements • Recent private placement increases unit count, which may weigh on sentiment near-term |
To screen for Singapore REITs with lowest price-to-book valuation or highest dividend yield, check out our best Singapore REIT screener.
If you are new to investing in Singapore REITs, you can start to learn more about Singapore REITs here.
If you prefer diversification without picking individual REITs, you can also gain exposure through Singapore REIT ETFs.
[Beansprout Exclusive Longbridge Promotion] Get bonus S$50 FairPrice voucher within 5 working days, plus 5% p.a. interest boost coupon (worth ~S$100) when you sign up for a Longbridge account via Beansprout. Plus, stand a chance to win 1g of gold bar. Promo ends on 31 March 2026. T&Cs apply. Learn more about the Longbridge promotion here.
Check out the best stock trading platforms in Singapore with the latest promotions to invest in Singapore REITs.
Enjoyed this insight? Follow Beansprout on Telegram, Youtube, Facebook and Instagram, and add Beansprout as your preferred source on Google so you never miss an update.
Read also
Gain financial insights in minutes
Subscribe to our free weekly newsletter for more insights to grow your wealth
Most Popular

Comments
0 comments