Keppel DC REIT and US-Iran ceasefire in focus: Weekly Review with SIAS
Stocks
Powered by
By Gerald Wong, CFA • 20 Apr 2026
Why trust Beansprout? We’ve been awarded Best Investment Website at the SIAS Investors’ Choice Awards 2025
'%3e%3cpath%20fill-rule='evenodd'%20clip-rule='evenodd'%20d='M17.64%209.20455C17.64%208.56637%2017.5827%207.95273%2017.4764%207.36364H9V10.845H13.8436C13.635%2011.97%2013.0009%2012.9232%2012.0477%2013.5614V15.8195H14.9564C16.6582%2014.2527%2017.64%2011.9455%2017.64%209.20455V9.20455Z'%20fill='%234285F4'/%3e%3cpath%20fill-rule='evenodd'%20clip-rule='evenodd'%20d='M9%2018C11.43%2018%2013.4673%2017.1941%2014.9564%2015.8195L12.0477%2013.5614C11.2418%2014.1014%2010.2109%2014.4205%209%2014.4205C6.65591%2014.4205%204.67182%2012.8373%203.96409%2010.71H0.957275V13.0418C2.43818%2015.9832%205.48182%2018%209%2018V18Z'%20fill='%2334A853'/%3e%3cpath%20fill-rule='evenodd'%20clip-rule='evenodd'%20d='M3.96409%2010.71C3.78409%2010.17%203.68182%209.59318%203.68182%209C3.68182%208.40682%203.78409%207.83%203.96409%207.29V4.95818H0.957273C0.347727%206.17318%200%207.54773%200%209C0%2010.4523%200.347727%2011.8268%200.957273%2013.0418L3.96409%2010.71V10.71Z'%20fill='%23FBBC05'/%3e%3cpath%20fill-rule='evenodd'%20clip-rule='evenodd'%20d='M9%203.57955C10.3214%203.57955%2011.5077%204.03364%2012.4405%204.92545L15.0218%202.34409C13.4632%200.891818%2011.4259%200%209%200C5.48182%200%202.43818%202.01682%200.957275%204.95818L3.96409%207.29C4.67182%205.16273%206.65591%203.57955%209%203.57955V3.57955Z'%20fill='%23EA4335'/%3e%3c/g%3e%3cdefs%3e%3cclipPath%20id='clip0_0_2849'%3e%3crect%20width='18'%20height='18'%20fill='white'/%3e%3c/clipPath%3e%3c/defs%3e%3c/svg%3e)
Make Beansprout your preferred source on Google
Add us on Google to see more of our insights in your search results
We share about more about Keppel DC REIT and how the Middle East conflict is shaping the Singapore stock market in the latest Weekly Market Review.

What happened?
In this week's Weekly Market Review in partnership with Securities Investors Association Singapore (SIAS), we discuss the rebound in global markets, renewed oil price volatility following the latest Middle East developments, and the latest update on Keppel DC REIT
Watch the video to learn more about what we are looking out for this week.
Weekly Market Review
2:09 - Macro Update
- Global markets extended their rebound last week, with the S&P 500 climbing to a fresh all-time high above 7,100, while the NASDAQ surged 6.8% to above 24,000, led by technology and semiconductor stocks.
- The STI also remained resilient, rising 0.2% to near the 5,000 level and coming close to its February record high of 5,041 before giving up some gains later in the week.
- Oil prices were highly volatile, falling from above US$100 per barrel to below US$90 as hopes of a US-Iran ceasefire lifted sentiment, before rebounding again as optimism around the talks faded.
- US 10-year government bond yields eased slightly from recent highs above 4.4% to around 4.25%, while Singapore 10-year government bond yields fell more sharply from about 2.4% to around 2.0%.
- The decline in bond yields supported a rebound in Singapore REITs, with Mapletree Logistics Trust up 5.0% and Frasers Logistics & Commercial Trust up 3.8%.
- Market sentiment remained fragile, with investors continuing to watch developments in the Middle East closely as earnings season picks up in both the US and Singapore.
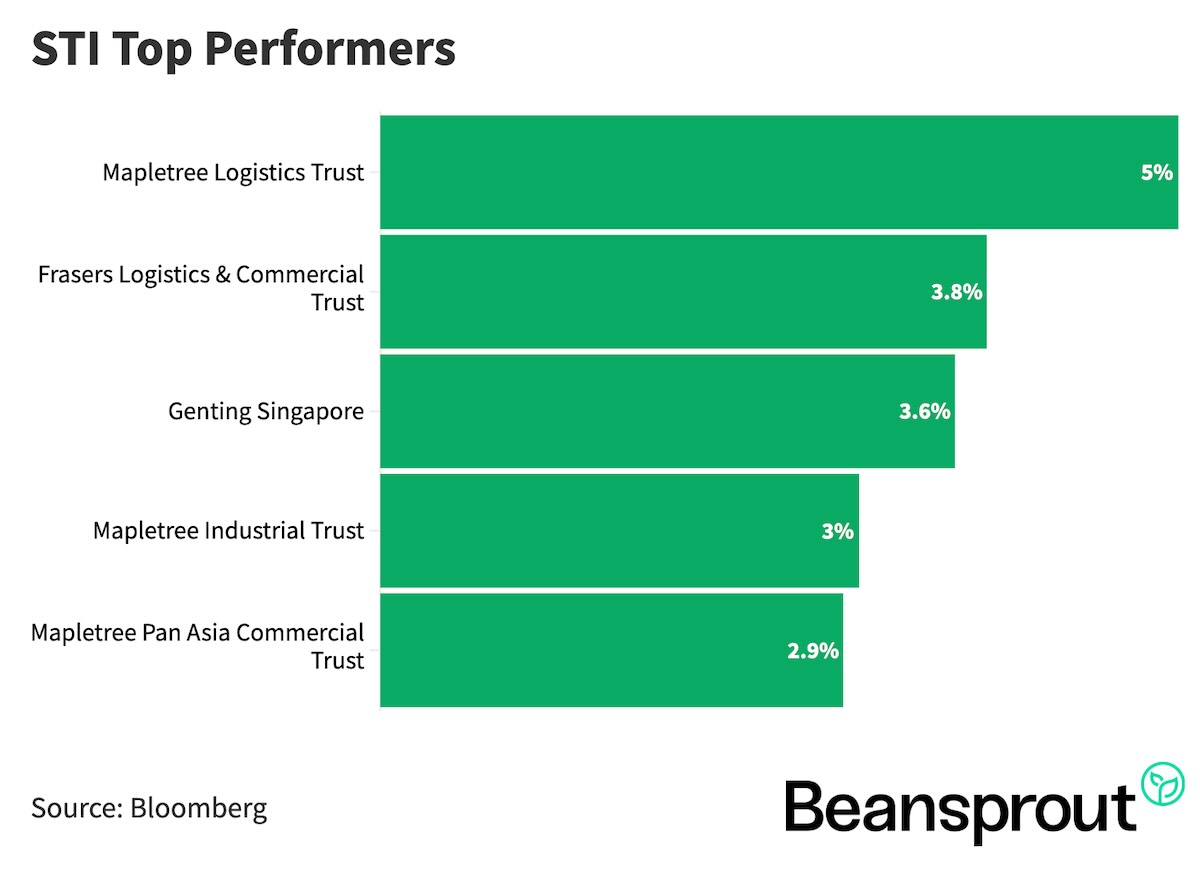
STI Top Performers:
- Mapletree Logistics Trust
- Frasers Logistics and Comms Trust
- Genting Singapore
- Mapletree Industrial Trust
- Mapletree Pan Asia Commercial Trust
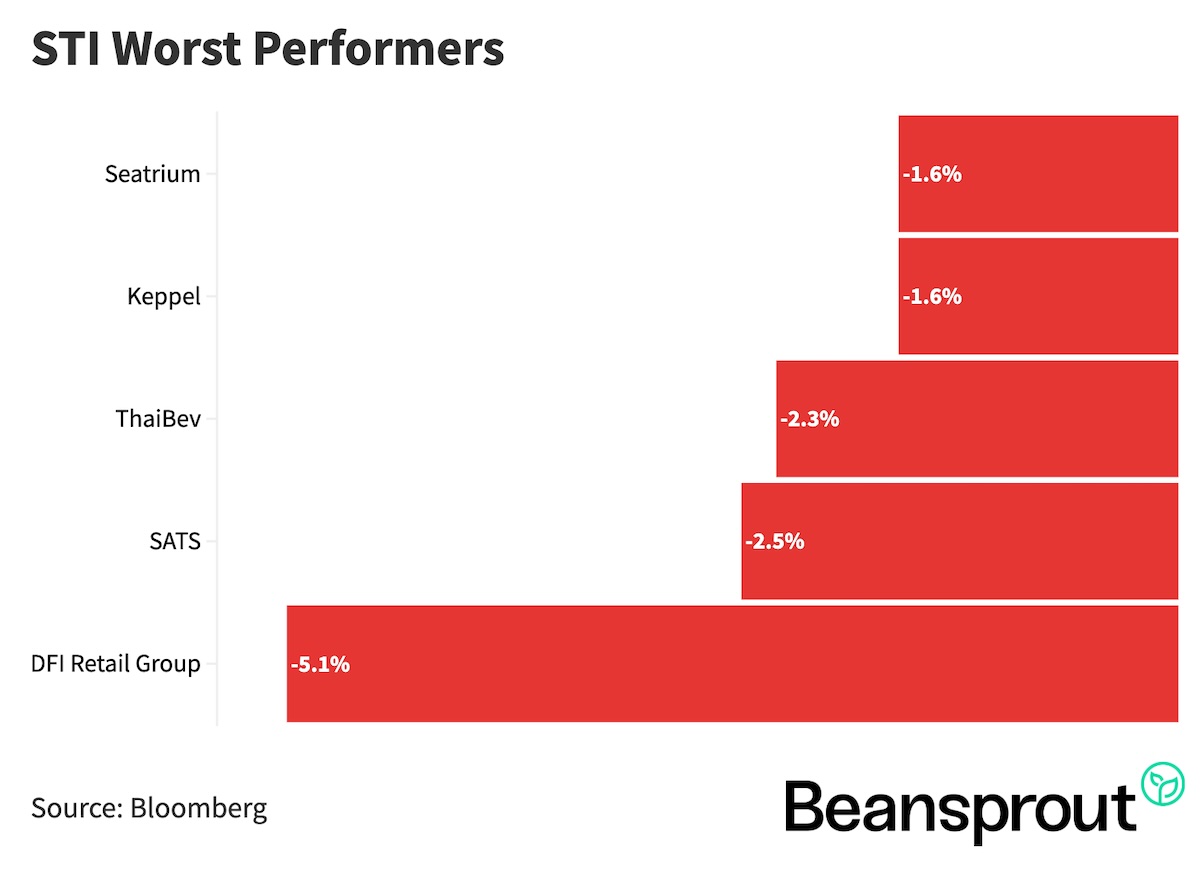
STI Worst Performers:
Company in Focus: Keppel DC REIT (SGX: AJBU)
- Keppel DC REIT’s share price has rebounded alongside the broader REIT sector, recovering to about S$2.35 after dipping below S$2.20 in March, helped by the easing in Singapore government bond yields.
- The key development was its first quarter 2026 business update, which showed strong growth across gross revenue, net property income, distributable income and distribution per unit.
- Distribution per unit rose 13.2% year on year to 2.83 cents, making Keppel DC REIT one of the stronger performers among the REITs that have reported so far this earnings season.
- The growth was driven by contributions from the acquisition of Tokyo Data Centre 3, as well as higher rental income from contract renewals and escalations, reflecting continued structural demand for data centre assets.
- Operationally, portfolio occupancy remained healthy at 95.6% in the first quarter of 2026, compared with 95.8% in the fourth quarter of 2025, while portfolio rental reversion came in at an exceptionally strong 51%.
- On the balance sheet side, aggregate leverage stayed manageable at 35.1%, while the average cost of debt fell further to 2.6%, down 20 basis points from the previous quarter.
- Its debt profile also appears comfortable, with less than 10% of debt due for refinancing in 2026, and about 85% of its borrowings on fixed rates, which helps to reduce the impact of interest rate volatility on distributions.
- Management noted that a 25 basis point change in interest rates would have only about a 0.3% impact on first quarter 2026 DPU on a pro forma basis, suggesting limited near term sensitivity to rate movements.
- At current levels, Keppel DC REIT is trading at about 1.4 times price to book, slightly below its historical average, while offering a dividend yield of around 4.3%.
- Overall, the latest results reinforce the view that Keppel DC REIT continues to benefit from structural tailwinds from AI workloads and demand for data centre capacity, supported by healthy portfolio metrics and a solid balance sheet.
Technical Analysis
Straits Times Index
- The STI briefly climbed above the 5,000 mark last week, reaching as high as 5,039, just 2 points shy of its February all-time high of 5,041, before easing back as market sentiment turned more cautious again.
- Immediate resistance is around 5,050, with 5,100 as the next psychological level if there is a positive surprise from developments in the Middle East.
- Support is around 4,920, which is the key near-term pivot level, while stronger support is seen around 4,800, referencing the late January low.
- The Singapore market has remained relatively resilient, supported by REITs and income names as Singapore government bond yields have fallen, although sentiment is likely to stay fragile with the ceasefire deadline and broader geopolitical uncertainty still in focus.
- RSI has eased to around 55, while MACD has started to converge towards the signal line, suggesting upside momentum is moderating and the STI may move into a more range-bound pattern in the near term.
- For now, the STI may continue to trade between about 4,800 and 5,000, with a move towards 4,800 potentially offering support unless there is a sharper deterioration in sentiment.
Learn more about the Straits Times Index (STI) here.
Dow Jones Industrial Average
- The Dow Jones rebounded strongly last week and came close to retesting its January high, ending near 49,447 after sentiment improved on hopes that US-Iran talks were making progress.
- Immediate resistance is around 49,621, which marks the January high, while 50,000 is the next psychological level and 50,512 would be the all-time high to watch if momentum continues.
- Support is seen in the 48,800 to 48,400 zone, which could attract buying interest if the index pulls back on renewed geopolitical concerns.
- RSI is close to the 70 level, suggesting the Dow may be nearing overbought territory and could see some near-term mean reversion after its recent run-up.
- At the same time, MACD has crossed above the zero line, pointing to a more constructive medium-term trend if the current pullback remains contained.
- In the near term, the Dow may see some consolidation or profit-taking, but if support around 48,400 to 48,800 holds, it could still remain on track to retest the 50,000 level.
S&P 500
- The S&P 500 broke to a fresh all-time high last week, rising to about 7,147 as easing tensions in the Middle East and encouraging early earnings results supported risk appetite.
- Immediate resistance is around 7,150, while 7,200 is the next psychological level if sentiment continues to improve.
- On the downside, 7,000 is now the key support level, having previously acted as resistance and likely to attract buyers if the market retraces.
- RSI has already moved above 70, suggesting the index is in overbought territory and may be vulnerable to some short-term profit-taking after the recent surge.
- However, MACD remains firmly positive, with both the MACD and signal lines above the zero baseline, indicating that the broader trend still looks constructive.
- For now, the S&P 500 may stay elevated and trade in a 7,000 to 7,150 range, with the next leg likely to depend on whether earnings continue to come in strongly and whether geopolitical tensions ease further.
Learn more about the S&P 500 index here.
Nasdaq Composite Index
- The Nasdaq was the strongest-performing major US index and climbed to a new all-time high of about 24,519, supported by optimism around big tech, AI-related names and the start of earnings season.
- Immediate resistance is around 25,000, which is the next major psychological level after last week’s breakout.
- Support is around 24,000, while a deeper pullback could bring the index back towards 23,169, which was the high seen before the Iran conflict began.
- RSI is close to 75, suggesting the Nasdaq is firmly in overbought territory and may be due for some cooling after its sharp advance.
- MACD remains positive, which suggests momentum is still favourable heading into the rest of the earnings season, especially if large tech companies continue to meet expectations.
- In the near term, the Nasdaq may see some profit-taking after its recent breakout, but if support around 24,000 holds, the broader uptrend could remain intact with room to test 25,000.
What to look out for this week
- Tuesday. 21 April: Keppel REIT, OUE REIT earnings
- Wednesday. 22 April: Tesla earnings, Digital Core REIT earnings
- Thursday, 23 April: Keppel, Suntec REIT, Ifast, CapitaLand China Trust, Intel earnings, 6-month Singapore T-bill auction
- Friday, 24 April: CapitaLand Integrated Commercial Trust (CICT), CapitaLand India Trust, Frasers Centrepoint Trust (FCT), Elite UK REIT earnings
Check out the full list of Singapore stocks, REITs and ETFs with upcoming dividend payments with our dividend calendar.
Follow us on Telegram, Youtube, Facebook and Instagram to get the latest financial insights.
Read also
Gain financial insights in minutes
Subscribe to our free weekly newsletter for more insights to grow your wealth
Most Popular

Comments
0 comments