
3 Singapore blue-chip stocks reporting results in August. What we are watching
Stocks
By Ng Hui Min • 02 Aug 2026
Why trust Beansprout? We’ve been awarded Best Investment Website at the SIAS Investors’ Choice Awards 2025
'%3e%3cpath%20fill-rule='evenodd'%20clip-rule='evenodd'%20d='M17.64%209.20455C17.64%208.56637%2017.5827%207.95273%2017.4764%207.36364H9V10.845H13.8436C13.635%2011.97%2013.0009%2012.9232%2012.0477%2013.5614V15.8195H14.9564C16.6582%2014.2527%2017.64%2011.9455%2017.64%209.20455V9.20455Z'%20fill='%234285F4'/%3e%3cpath%20fill-rule='evenodd'%20clip-rule='evenodd'%20d='M9%2018C11.43%2018%2013.4673%2017.1941%2014.9564%2015.8195L12.0477%2013.5614C11.2418%2014.1014%2010.2109%2014.4205%209%2014.4205C6.65591%2014.4205%204.67182%2012.8373%203.96409%2010.71H0.957275V13.0418C2.43818%2015.9832%205.48182%2018%209%2018V18Z'%20fill='%2334A853'/%3e%3cpath%20fill-rule='evenodd'%20clip-rule='evenodd'%20d='M3.96409%2010.71C3.78409%2010.17%203.68182%209.59318%203.68182%209C3.68182%208.40682%203.78409%207.83%203.96409%207.29V4.95818H0.957273C0.347727%206.17318%200%207.54773%200%209C0%2010.4523%200.347727%2011.8268%200.957273%2013.0418L3.96409%2010.71V10.71Z'%20fill='%23FBBC05'/%3e%3cpath%20fill-rule='evenodd'%20clip-rule='evenodd'%20d='M9%203.57955C10.3214%203.57955%2011.5077%204.03364%2012.4405%204.92545L15.0218%202.34409C13.4632%200.891818%2011.4259%200%209%200C5.48182%200%202.43818%202.01682%200.957275%204.95818L3.96409%207.29C4.67182%205.16273%206.65591%203.57955%209%203.57955V3.57955Z'%20fill='%23EA4335'/%3e%3c/g%3e%3cdefs%3e%3cclipPath%20id='clip0_0_2849'%3e%3crect%20width='18'%20height='18'%20fill='white'/%3e%3c/clipPath%3e%3c/defs%3e%3c/svg%3e)
Make Beansprout your preferred source on Google
Add us on Google to see more of our insights in your search results
3 Singapore blue-chip stocks will be reporting results in August 2026. Here are the earnings, dividends and key trends that we are watching.
What happened?
Many Singapore blue-chip companies will be reporting their results soon.
Singapore blue chips had a strong first half of 2026, with the Straits Times Index continuously reaching new highs as resilient earnings, improving market sentiment and Singapore’s perceived safe-haven status supported the market.
Earlier, we saw that SGX was the best-performing Singapore blue-chip stocks in the first half of 2026.
Meanwhile, DBS, OCBC and UOB reached record highs in July which made us take a closer look at whether Singapore bank shares can continue climbing.
With valuations having risen for several blue chips, their upcoming results will be important in assessing whether their earnings and dividend outlooks remain strong enough to support further gains.
In this article, I look at what we will be watching when DBS, SGX and CapitaLand Investment announce their results in August 2026.
| Company | Reporting date | Reporting period | Key areas to watch |
| DBS Group Holdings (SGX: D05) | 6-Aug-26 | 2Q and 1H 2026 | Net interest margin, wealth-management fees, asset quality and dividends |
| Singapore Exchange (SGX: S68) | 6-Aug-26 | FY2026 | Trading activity, expense growth and dividends |
| CapitaLand Investment (SGX: 9CI) | 13-Aug-26 | 1H 2026 | Fee-related revenue, capital recycling and China valuations |
#1 – DBS Group Holdings (SGX: D05)
DBS will announce its second-quarter and first-half 2026 results on 6 August 2026.
The bank entered the second quarter with resilient earnings despite the decline in interest rates.
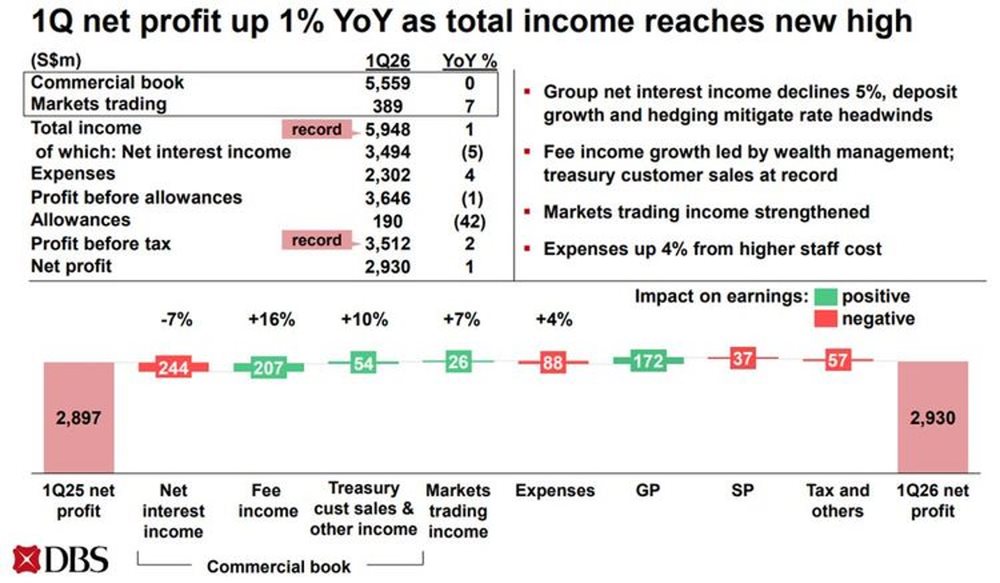
In the first quarter of 2026, DBS’s net profit rose 1% year-on-year to S$2.93 billion, while total income reached a new high of S$5.95 billion. Its return on equity remained healthy at 17.0%.
However, the impact of lower rates was increasingly visible in its core banking income.
DBS’s group net interest margin declined from 2.12% in the first quarter of 2025 to 1.89% in the first quarter of 2026.
Group net interest income fell 5% year-on-year to S$3.49 billion, although it was broadly stable from the previous quarter after adjusting for the number of days.
When DBS reports its upcoming results, I would first look at whether its net interest margin has continued to narrow.
Lower benchmark rates generally reduce the difference between what banks earn from loans and pay on deposits. DBS has sought to cushion this impact through balance-sheet hedges and growth in its loans and deposits.
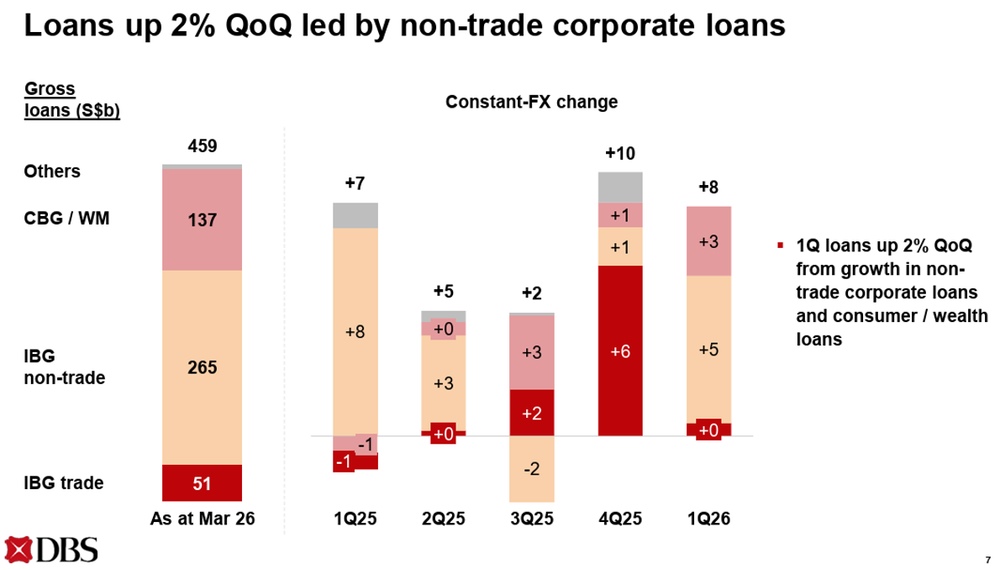
Gross loans increased by 2% quarter-on-quarter in constant-currency terms during the first quarter, led by corporate and consumer lending. Deposits rose by 3%, with the proportion of lower-cost current and savings account deposits improving slightly to 55%.
The second-quarter results should show whether this balance-sheet growth remains sufficient to offset further pressure on margins.
I would also watch whether DBS can sustain the strong momentum in its fee-generating businesses.
Gross fee income reached a record S$1.71 billion in the first quarter, up 14% year-on-year. Wealth-management fees rose by 25% to a record S$907 million, while transaction-services fees also reached a new high.
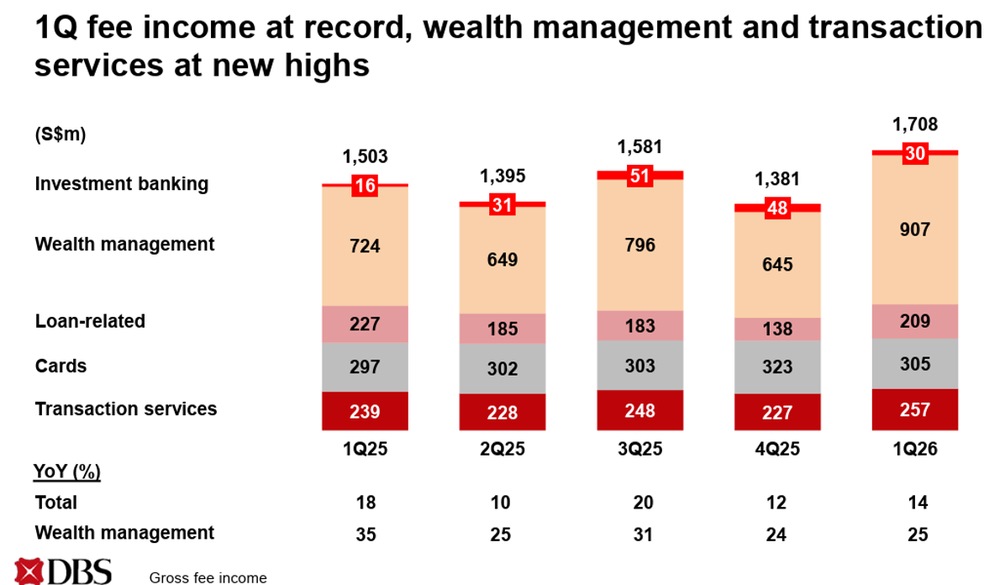
Continued growth in wealth management, transaction services and treasury customer sales would reduce DBS’s dependence on net interest income.
DBS has recently announced its target of more than S$1 trillion in retail and wealth assets under management by 2030, up from S$632 billion at end-2025.
DBS is also pushing into new growth areas.
In July, it signed an MOU with Samsung Securities to explore cross-border wealth management collaboration between Singapore and South Korea.
It also announced plans to offer tokenised physical gold to retail customers through DBS digibank from the second half of 2026, backed one-for-one by physical gold held in a Singapore vault.
I would watch if these income streams may fluctuate with financial market activity and investor sentiment.
Beyond revenue growth, I would monitor whether DBS’s asset quality remains resilient.
Its non-performing loan ratio stayed at 1.0% in the first quarter, while specific allowances were equivalent to 14 basis points of loans. New non-performing asset formation remained low and was more than offset by repayments and write-offs.
A stable non-performing loan ratio and credit costs would suggest that the bank’s balance sheet remains healthy despite uncertainty surrounding global economic growth.
For income investors, attention will also be on whether DBS maintains its latest dividend.
The bank declared an ordinary dividend of 66 cents per share and a capital return dividend of 15 cents per share for the first quarter. This brought its total quarterly dividend to 81 cents per share.
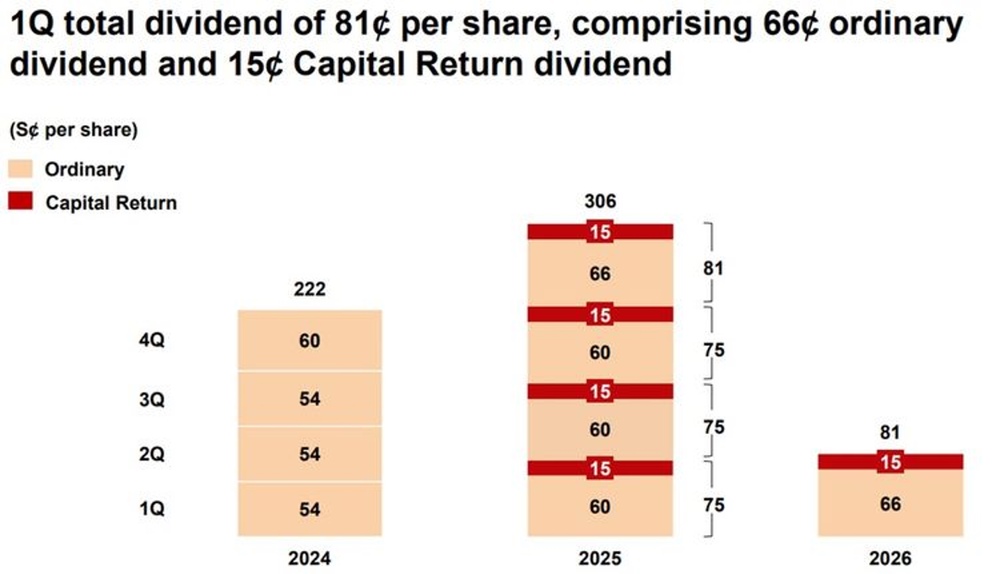
DBS has indicated that it plans to continue paying capital return dividends of 15 cents per share per quarter in 2026 and 2027, barring unforeseen circumstances.
However, I would distinguish between the two components.
The ordinary dividend provides a better indication of DBS’s recurring dividend capacity. The capital return dividend reflects the distribution of surplus capital and may not continue beyond the current programme.
DBS is expected to pay total dividends of S$3.24 per share in 2026. This represents a forward dividend yield of about 4.4%, below its historical average dividend yield of 5.4%.
Valuation will also be important following the strong rise in DBS’s share price.
As of 28 July 2026, DBS was trading at a price-to-earnings ratio of about 18.6 times, above its historical average of 11.78 times.
Its price-to-book ratio of 3.05 times was also more than double its historical average of 1.51 times.
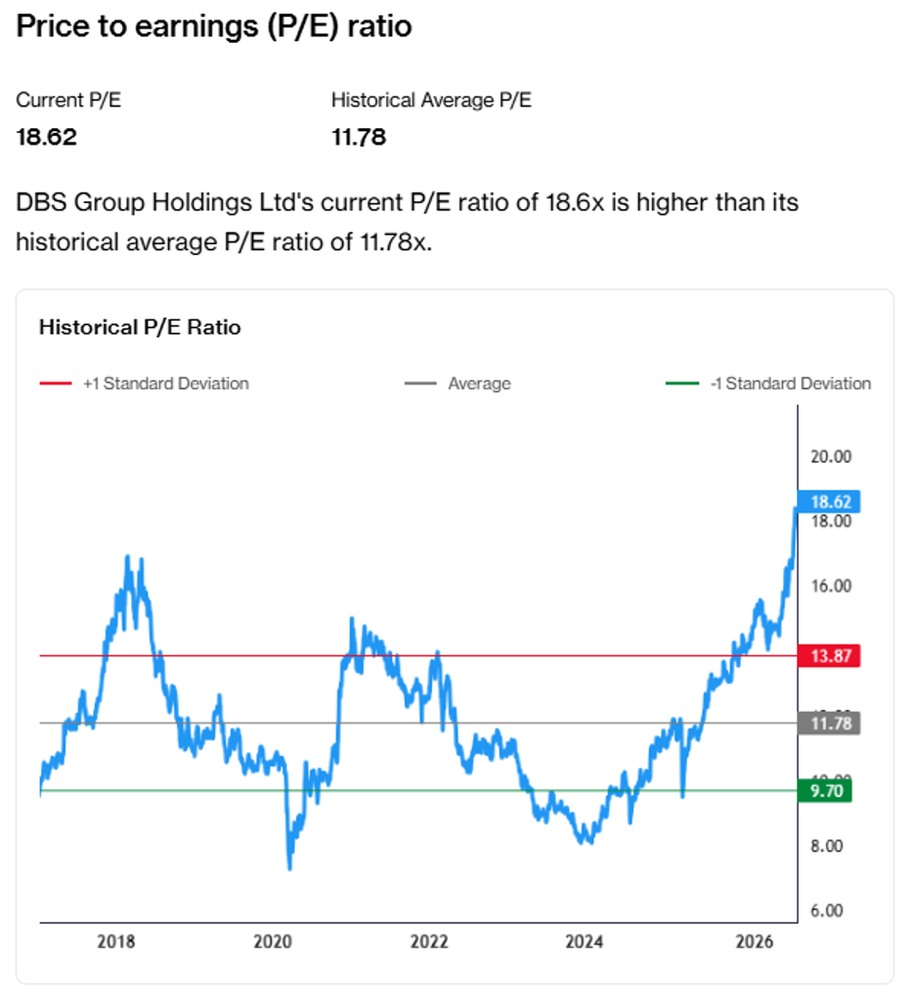
The higher valuation suggests that investors have already priced in expectations of resilient profitability, wealth-management growth and continued capital returns.
DBS may therefore need to deliver strong results to support its current valuation.
Estimate a potential entry or exit price for DBS based on its historical price-to-earnings ratio using the P/E price target estimator below.
Related links:
- What DBS’s S$1 trillion AUM target means for my Singapore bank allocation
- Can Singapore bank shares keep climbing? What US bank results and global valuations tell us
- DBS latest valuation, share price and analysis
- DBS dividend history and dividend forecast
#2 – Singapore Exchange (SGX: S68)
SGX will report its FY2026 results after the market closes on 6 August 2026.
The exchange recorded net revenue of S$695.4 million in the first half of FY2026, an increase of 7.6% year-on-year. Excluding treasury income, net revenue rose 10.1%, while adjusted net profit grew 11.6% to S$357.1 million.
SGX’s adjusted net profit grew faster than its revenue because its adjusted expenses increased at a slower pace of 3.8%.
The improvement was led by stronger contributions from cash equities and the fixed income, currencies and commodities business.
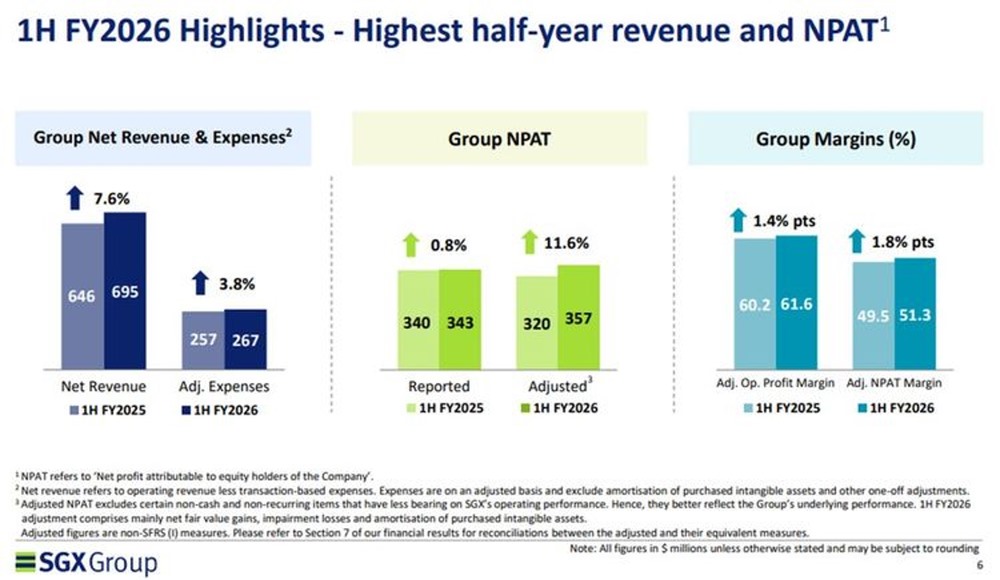
Cash equities net revenue rose 16.2% year-on-year to S$223.9 million. Securities daily average traded value increased by 19.5% to S$1.51 billion, supported by stronger market sentiment and investor participation.
When SGX reports its full-year results, I would first look at whether the higher level of securities trading activity continued into the second half.
An increase in trading across Singapore stocks, REITs and exchange-traded funds would support SGX’s trading, clearing and securities settlement revenue.
However, trading activity can be cyclical. Revenue may decline if market volatility and investor participation eventually normalise.
I would therefore assess whether SGX’s growth is broad-based rather than dependent on a temporary increase in Singapore stock-market turnover.
The performance of its fixed income, currencies and commodities business will be another important area to monitor. Net revenue from the segment rose 12.5% in the first half. SGX’s foreign-exchange average daily volume reached a record US$180 billion, while commodity derivatives benefited from record iron ore volumes.
This business helps SGX diversify its earnings beyond Singapore equities and provides access to global institutional investors trading Asian currencies and commodities.
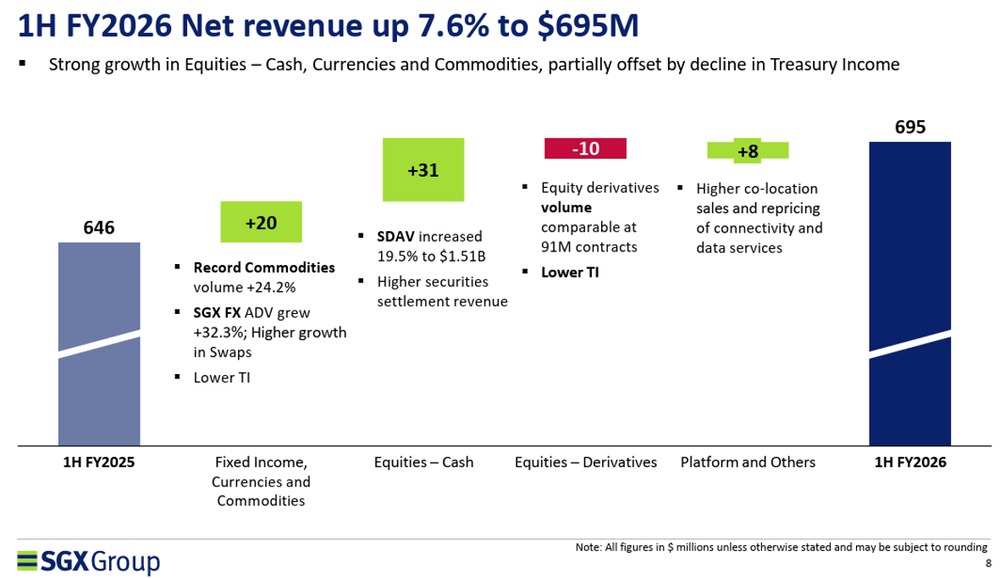
In contrast, equity derivatives revenue declined during the first half, even though the number of contracts traded was broadly stable. Investors may therefore want to see whether activity in SGX’s China, India and regional equity contracts improved in the second half.
I would also watch whether SGX continues to control its costs as revenue grows.
Adjusted expenses increased by 3.8% in the first half, partly because of higher staff, professional and technology-related costs. Management maintained its guidance for adjusted expenses to grow by between 4% and 6% for FY2026.
Revenue growing faster than expenses would allow SGX to maintain positive operating leverage and support further profit growth.
For income investors, the final quarterly dividend will be a key focus.
SGX paid total interim dividends of 21.75 cents per share for the first half of FY2026, an increase of 20.8% from the previous year.
The company has stated that it intends to increase its quarterly dividend by 0.25 cent each quarter until FY2028. Its published dividend path indicates a total dividend of 44.5 cents per share for FY2026, including a fourth-quarter dividend of 11.5 cents.
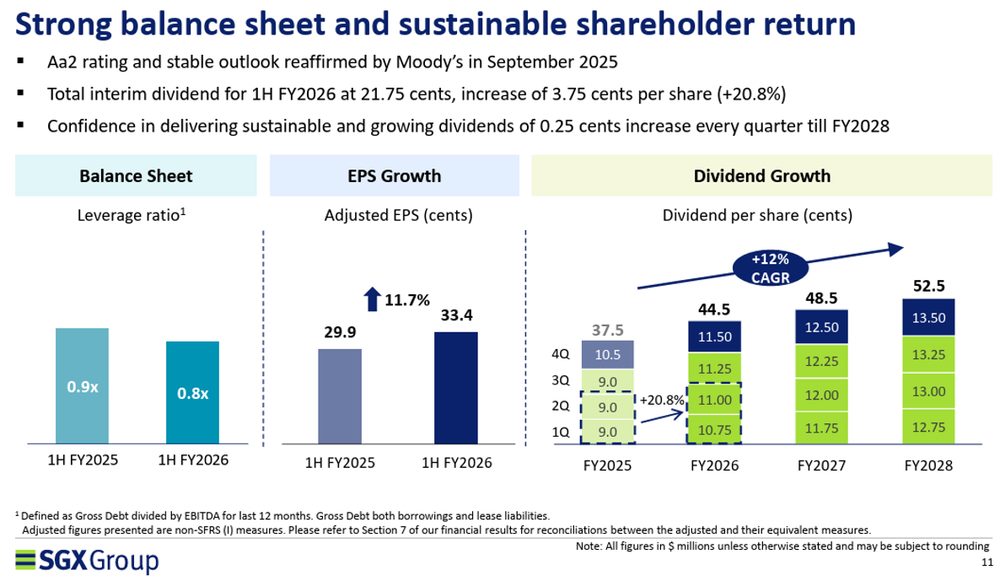
Investors will therefore be watching whether SGX delivers the dividend increase it previously outlined.
SGX offered a forward dividend yield of about 1.9% as of 28 July 2026. This was below its historical average dividend yield of about 3.3%.
A higher dividend would be positive, but investors may also want to consider whether much of the expected earnings and dividend growth is already reflected in SGX’s valuation.
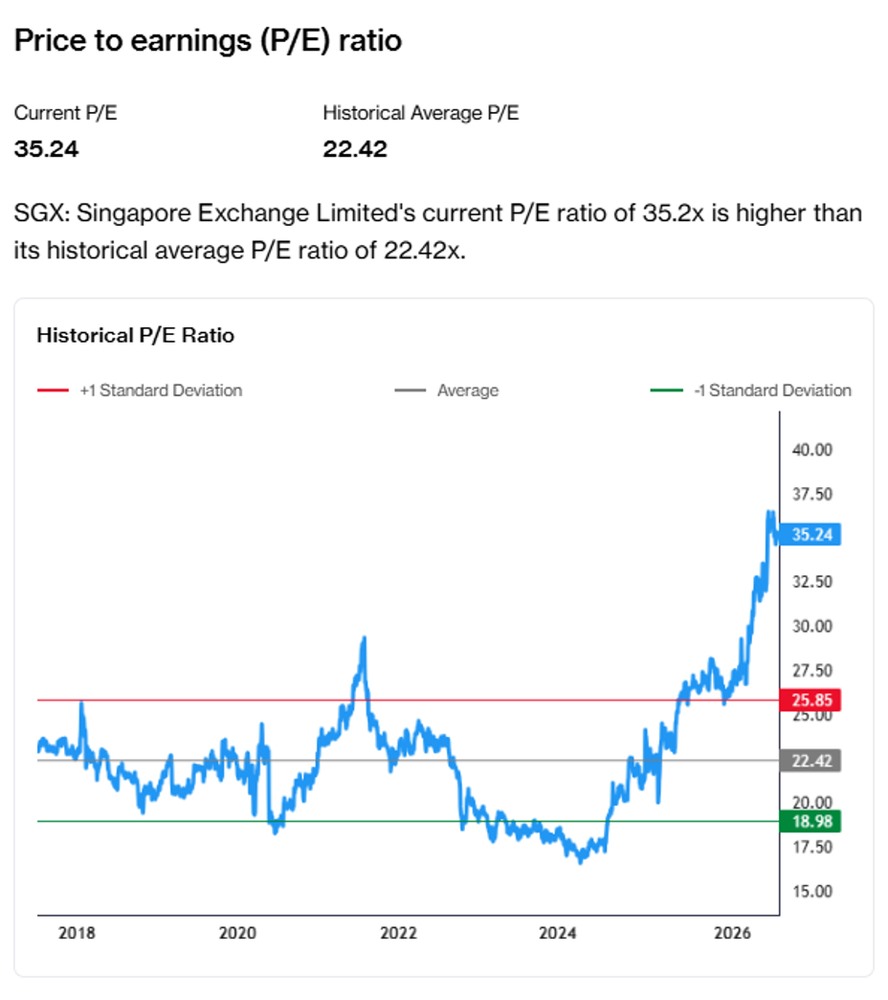
However, SGX’s stronger earnings and trading momentum have also been accompanied by a rise in its valuation.
As of 28 July 2026, SGX was trading at a price-to-earnings ratio of about 34.9 times, compared with its historical average of 22.41 times.
Its price-to-book ratio of 11.08 times was also above its historical average of 7.22 times.
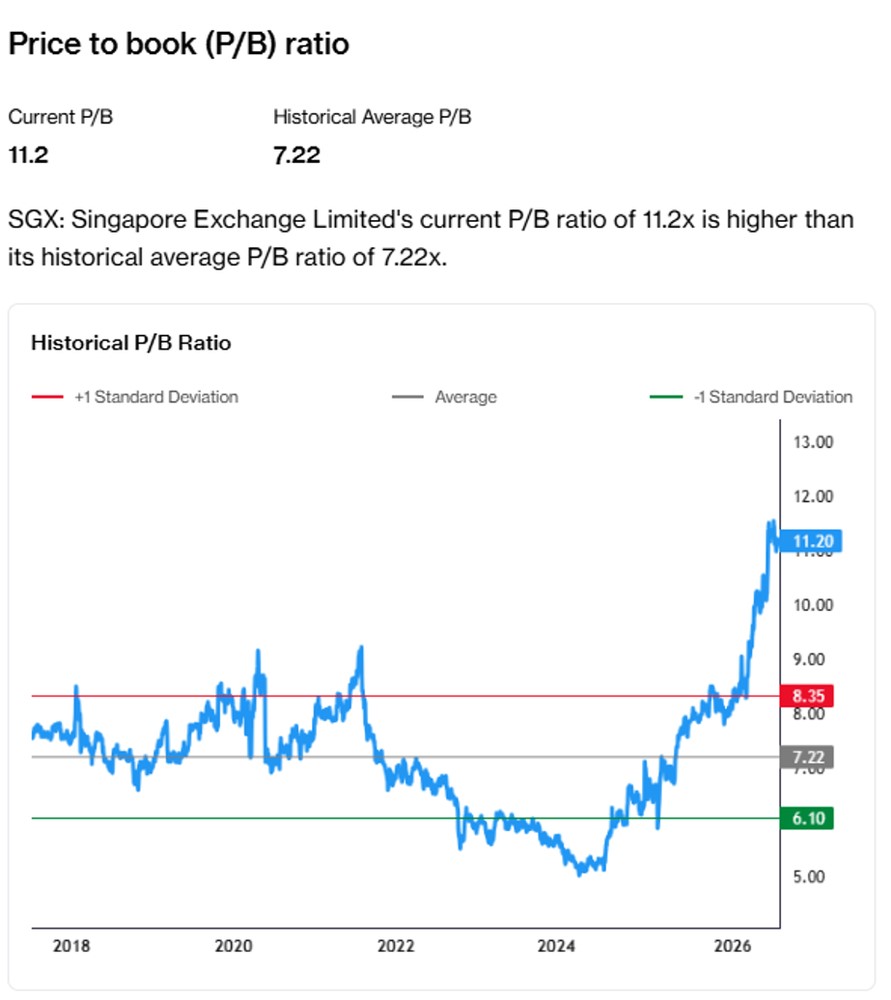
This suggests that investors are paying a premium for SGX’s recurring revenue, strong market position and expected dividend growth.
However, the higher valuation also means that slower trading activity or weaker-than-expected earnings growth could have a greater impact on its share price.
Estimate a potential entry or exit price for SGX based on its historical price-to-earnings ratio using the P/E price target estimator below.
Related links:
SGX latest valuation, share price and analysis
SGX dividend history and dividend forecast
#3 – CapitaLand Investment (SGX: 9CI)
CapitaLand Investment is expected to report its first-half 2026 results on 13 August 2026.
The company entered the reporting season with continued growth in its fee-related business, although revenue from its directly held real estate investments declined.
Fee-related revenue increased by 10% year-on-year to S$310 million in the first quarter of 2026. Listed funds management revenue grew by 14%, while private funds management revenue rose by 58%.
In comparison, revenue from its real estate investment business fell by 14% to S$207 million. This was mainly due to the absence of contributions following the divestments of its Synergy corporate housing platform and Dalian IT Park.
This contrast reflects CapitaLand Investment’s transition towards a more asset-light business model.
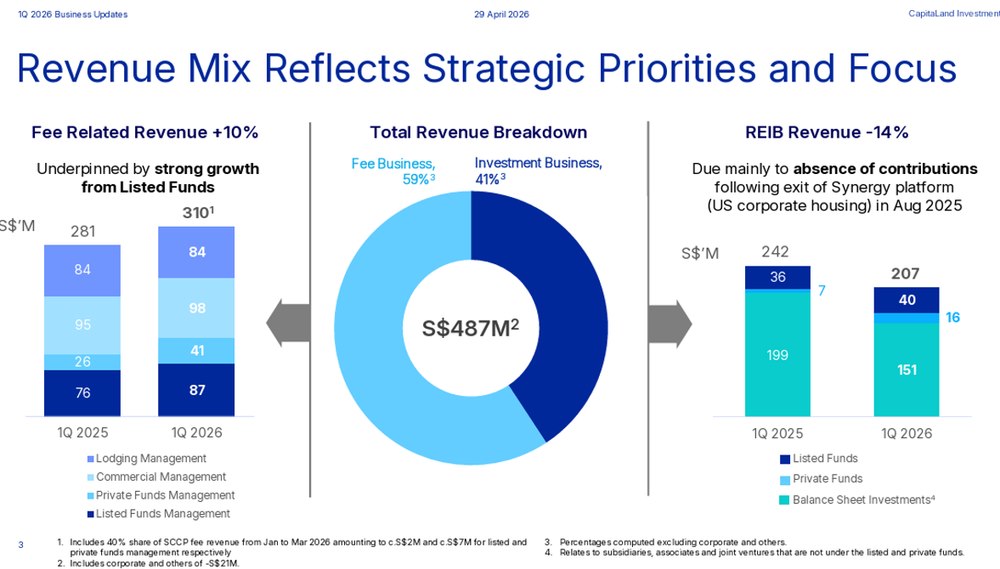
The company is seeking to generate a larger proportion of recurring management fees from listed REITs, private funds, commercial properties and lodging assets, while reducing the capital tied up in directly held properties.
When CapitaLand Investment announces its first-half results, I would first assess whether growth in funds under management is translating into sustained fee-related revenue and earnings growth.
Its funds under management reached S$125 billion at the end of FY2025, compared with S$87 billion in FY2021. The company has set a target of reaching S$200 billion by FY2028.
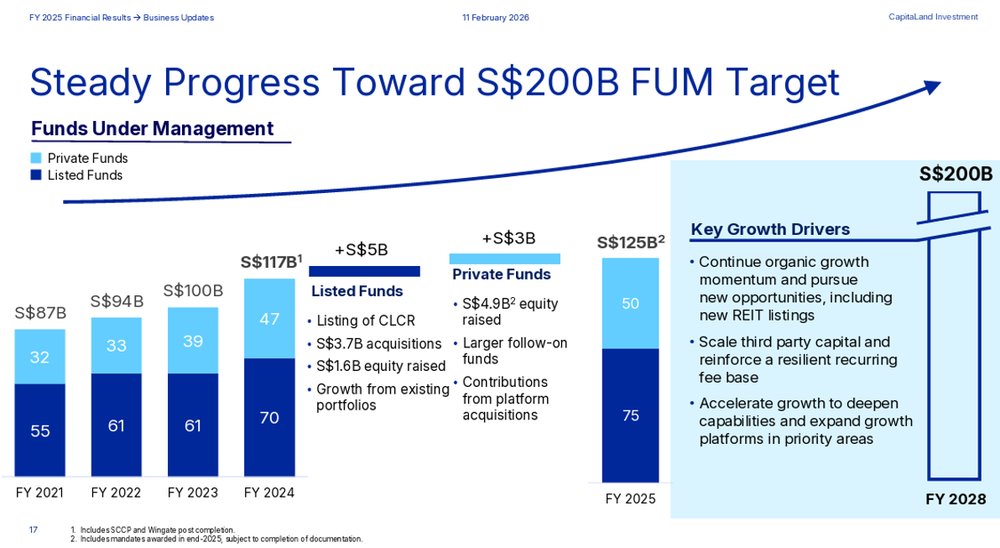
However, growth in funds under management does not necessarily translate directly into a similar increase in profits.
The amount of fee income generated depends on the types of funds raised, whether the capital has been deployed and the fee arrangements for each mandate.
I would therefore look at both fee-related revenue growth and fee margins, rather than focusing only on the headline value of assets under management.
Capital raising and deployment will also be important.
From the beginning of 2026 to 28 April, CapitaLand Investment raised about S$2.5 billion of equity across its listed and private funds. It deployed about S$7.2 billion and completed or announced approximately S$3.4 billion of divestments.
Continued capital recycling could allow the company to reduce its balance-sheet exposure while generating additional recurring management fees.
Investors may therefore want to look for updates on whether recent acquisitions and newly raised funds have begun contributing to fee-related earnings.
The valuation of CapitaLand Investment’s China-related investments will be another key watch point.
The carrying value of its stakes in private funds declined by S$0.2 billion year-on-year in the first quarter, partly because of valuation adjustments in certain China funds. Its balance-sheet investments fell by S$0.4 billion following the completion of several divestments.
Further valuation losses could continue to create volatility in CapitaLand Investment’s reported profit, even if its underlying fee-related business remains resilient.
I would therefore distinguish between recurring operating earnings and non-cash valuation movements when assessing the upcoming results.
CapitaLand Investment’s balance sheet remains another factor to watch as it pursues growth.
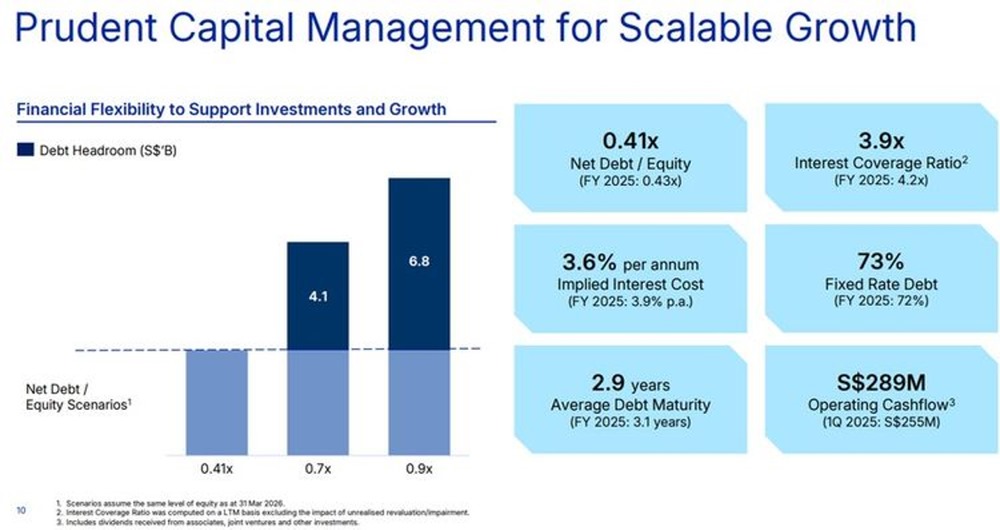
Its net debt-to-equity ratio stood at 0.41 times as of 31 March 2026, while 73% of its debt was on fixed rates. Its implied interest cost declined to 3.6% per year, although its interest coverage ratio fell slightly to 3.9 times.
A healthy balance sheet would give CapitaLand Investment more flexibility to seed new funds, make strategic acquisitions and continue recycling capital.
For income investors, the main question is whether recurring fee-related earnings can support the company’s dividend over time.
CapitaLand Investment has paid a dividend of 12 cents per share for each financial year since FY2023. It is expected to maintain a dividend of 12 cents for 2026, representing a forward dividend yield of about 4.8% as of 28 July 2026, above its historical average dividend yield of 4.3%.
The company has paid its dividend annually in recent years, so the first-half results may be more important as an indicator of dividend sustainability rather than an immediate dividend announcement.
CapitaLand Investment’s valuation presents a different picture from DBS and SGX.
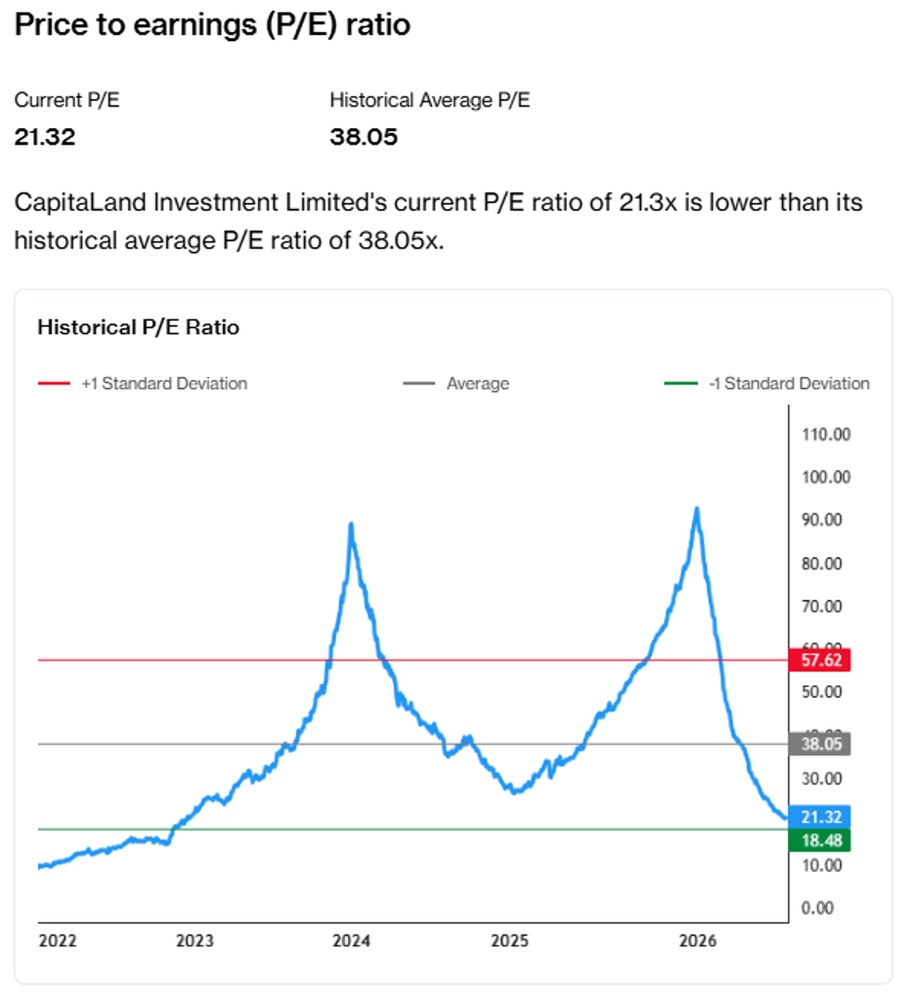
As of 28 July 2026, the stock was trading at a price-to-earnings ratio of about 21.4 times, below its historical average of 38.05 times.
Its price-to-book ratio of 1.03 times was also slightly below its historical average of 1.11 times.
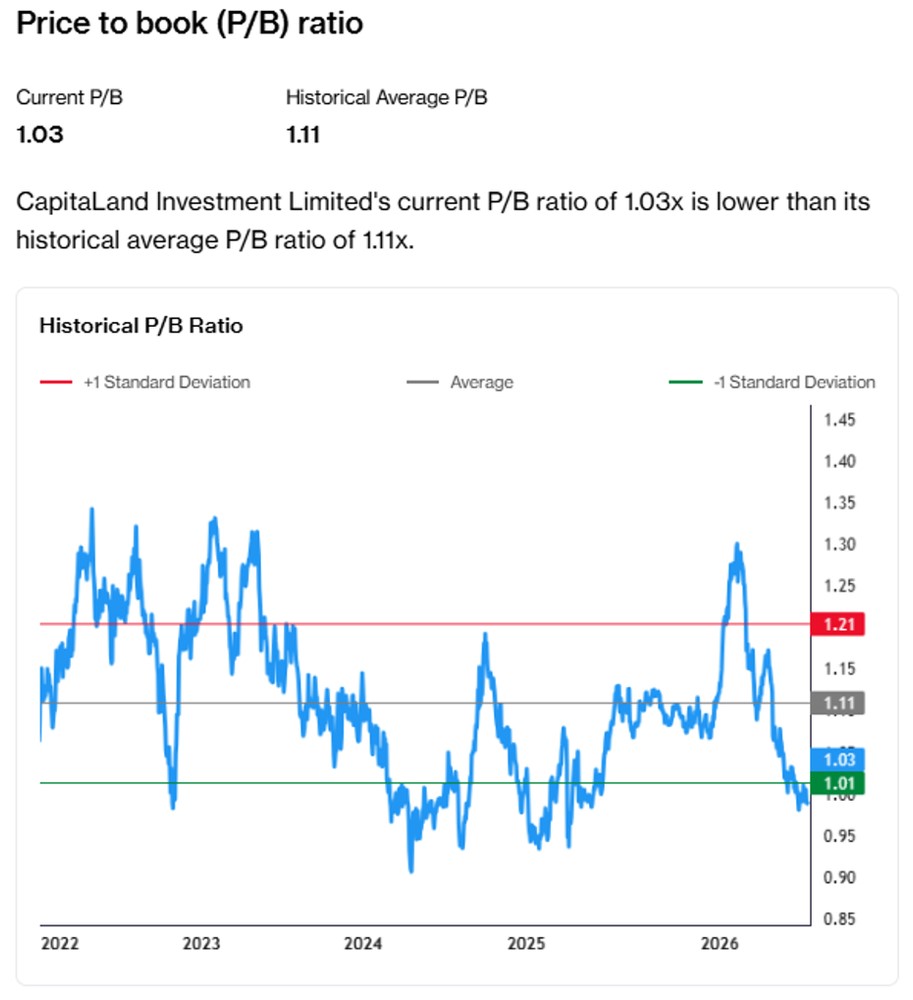
On the surface, this suggests that CapitaLand Investment is trading at a lower valuation than it has historically.
However, its price-to-earnings ratio may be affected by revaluation gains and losses, divestments and other non-recurring items.
I would therefore assess its valuation alongside the growth of recurring fee-related earnings and the value of its underlying investments, rather than relying on the price-to-earnings ratio alone.
Estimate a potential entry or exit price for CapitaLand Investment based on its historical price-to-earnings ratio using the P/E price target estimator below.
Related links:
CapitaLand Investment latest valuation, share price and analysis
CapitaLand Investment dividend history and dividend forecast
What would Beansprout do?
As we enter earnings season, I would assess whether the latest results confirm that the main earnings drivers of these three Singapore blue chips remain intact.
For DBS, I would watch whether stronger wealth management and fee income can offset pressure from declining net interest margins, while asset quality and dividends remain intact. I would also assess whether its earnings outlook is strong enough to support the bank’s current valuation. Learn more about DBS's latest valuation and dividend analysis here.
SGX appears to have strong near-term operating momentum, supported by increased securities trading and growth in its currencies and commodities business. However, I would consider whether trading activity can remain elevated and whether SGX’s current valuation already reflects much of its expected earnings and dividend growth. Learn more about SGX's latest valuation and dividend analysis here.
For CapitaLand Investment, the key indicator will be whether growth in funds under management translates into higher recurring fee-related earnings. I would also monitor whether further China-related valuation adjustments continue to weigh on its reported results. Learn more about CapitaLand Investment's latest valuation and dividend analysis here.
If the latest results point to stronger earnings momentum and meaningful upside, I would assess whether these blue-chip stocks merit further research as higher conviction individual stock ideas within my portfolio. You learn how we screen for growth stocks using three simple checks here.
For investors seeking income, I would instead assess whether the company has sustainable earnings, a healthy balance sheet and sufficient cash flow to maintain or grow its dividend payouts. You can learn more about the three checks I use to screen dividend stocks for the Income Pot here.
To find out which blue chip stocks we would hold in our model portfolio, check out how we would invest $100,000 in Singapore today.
If you are looking for greater clarity on the markets and the investment decisions that matter, explore Beansprout Pro for our latest views, portfolio thinking and the reasoning behind each opportunity.
Investors who prefer broad exposure to Singapore blue chips without selecting individual companies may consider gaining exposure to the Straits Times Index through an STI ETF.
Beyond these three companies, we still believe that Singapore stocks are still worth looking at in 2026.
There are many other avenues to capture structural growth in the Singapore market, including companies linked to infrastructure, data centres, energy and food security as well as Singapore's rise as a wealth hub. Find out more about the 4 growth themes we are watching in Singapore stocks here.
Which of these three Singapore blue-chip results will you be watching most closely? Share your thoughts in the comments below or join the discussion in our Telegram group!
Planning to invest in Singapore stocks? Compare the best Singapore brokers to find the right trading platform, and see the latest promotions and sign-up rewards available.
Follow Beansprout on YouTube, Facebook and Instagram, and add Beansprout as your preferred source on Google so you never miss an update.
Read also
Gain financial insights in minutes
Subscribe to our free weekly newsletter for more insights to grow your wealth
Most Popular

Comments
0 comments