3 best-performing Singapore blue chip stocks that rose over 20% in 1H 2026. What could drive them next
Stocks
By Ng Hui Min • 03 Jul 2026
Why trust Beansprout? We’ve been awarded Best Investment Website at the SIAS Investors’ Choice Awards 2025
'%3e%3cpath%20fill-rule='evenodd'%20clip-rule='evenodd'%20d='M17.64%209.20455C17.64%208.56637%2017.5827%207.95273%2017.4764%207.36364H9V10.845H13.8436C13.635%2011.97%2013.0009%2012.9232%2012.0477%2013.5614V15.8195H14.9564C16.6582%2014.2527%2017.64%2011.9455%2017.64%209.20455V9.20455Z'%20fill='%234285F4'/%3e%3cpath%20fill-rule='evenodd'%20clip-rule='evenodd'%20d='M9%2018C11.43%2018%2013.4673%2017.1941%2014.9564%2015.8195L12.0477%2013.5614C11.2418%2014.1014%2010.2109%2014.4205%209%2014.4205C6.65591%2014.4205%204.67182%2012.8373%203.96409%2010.71H0.957275V13.0418C2.43818%2015.9832%205.48182%2018%209%2018V18Z'%20fill='%2334A853'/%3e%3cpath%20fill-rule='evenodd'%20clip-rule='evenodd'%20d='M3.96409%2010.71C3.78409%2010.17%203.68182%209.59318%203.68182%209C3.68182%208.40682%203.78409%207.83%203.96409%207.29V4.95818H0.957273C0.347727%206.17318%200%207.54773%200%209C0%2010.4523%200.347727%2011.8268%200.957273%2013.0418L3.96409%2010.71V10.71Z'%20fill='%23FBBC05'/%3e%3cpath%20fill-rule='evenodd'%20clip-rule='evenodd'%20d='M9%203.57955C10.3214%203.57955%2011.5077%204.03364%2012.4405%204.92545L15.0218%202.34409C13.4632%200.891818%2011.4259%200%209%200C5.48182%200%202.43818%202.01682%200.957275%204.95818L3.96409%207.29C4.67182%205.16273%206.65591%203.57955%209%203.57955V3.57955Z'%20fill='%23EA4335'/%3e%3c/g%3e%3cdefs%3e%3cclipPath%20id='clip0_0_2849'%3e%3crect%20width='18'%20height='18'%20fill='white'/%3e%3c/clipPath%3e%3c/defs%3e%3c/svg%3e)
Make Beansprout your preferred source on Google
Add us on Google to see more of our insights in your search results
We look at the top three Singapore blue chip stocks in the first half of 2026 which saw total returns of about 20% or more, and what could support or weaken their momentum as we head into the second half of the year.
What happened?
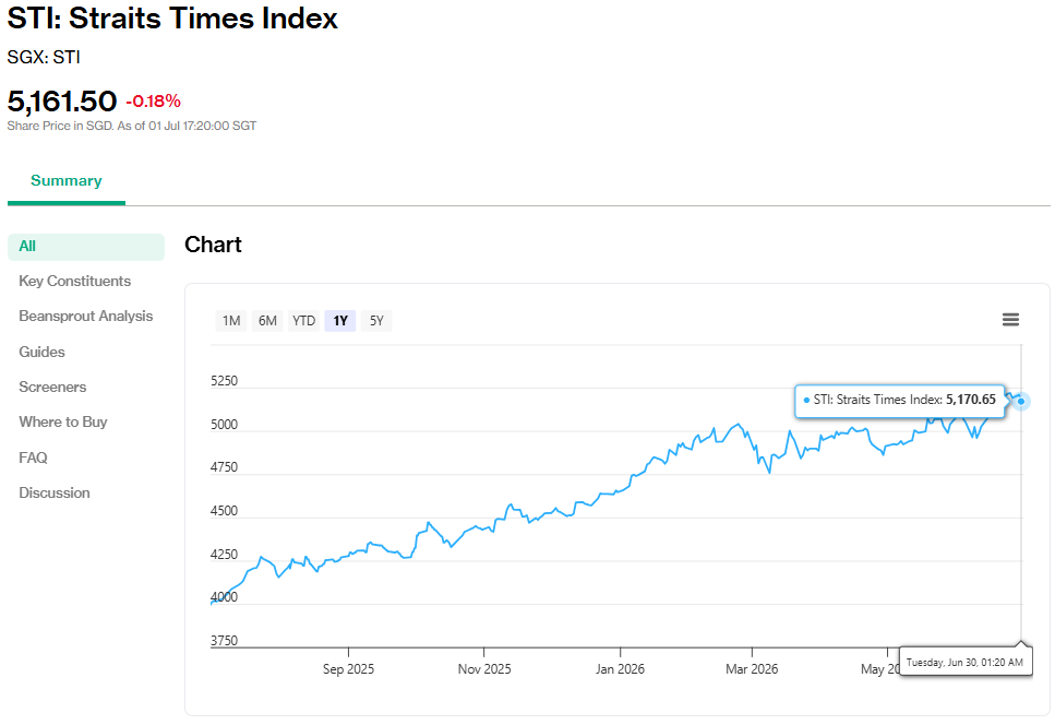
Singapore blue chips had a strong first half.
The Straits Times Index (STI) repeatedly touched fresh all-time highs this year, reaching 5,241 points on 23 June.
The rally was supported by resilient bank earnings, a structural re-rating of SGX, and Singapore’s perceived safe-haven status amid geopolitical uncertainty in the Middle East.
Earlier, we looked at DBS, OCBC and UOB as they hit record highs, and which bank looks strongest for income.
We also highlighted SATS, DBS and Venture as the best-performing blue chips in May.
At the same time, the gains have not been evenly spread across the market. We noted that Seatrium’s share price lagged the STI even as its turnaround progressed.
As we enter 2H 2026, investors may be wondering whether the strongest Singapore blue chip stocks can continue to outperform, or whether some of the good news has already been priced in.
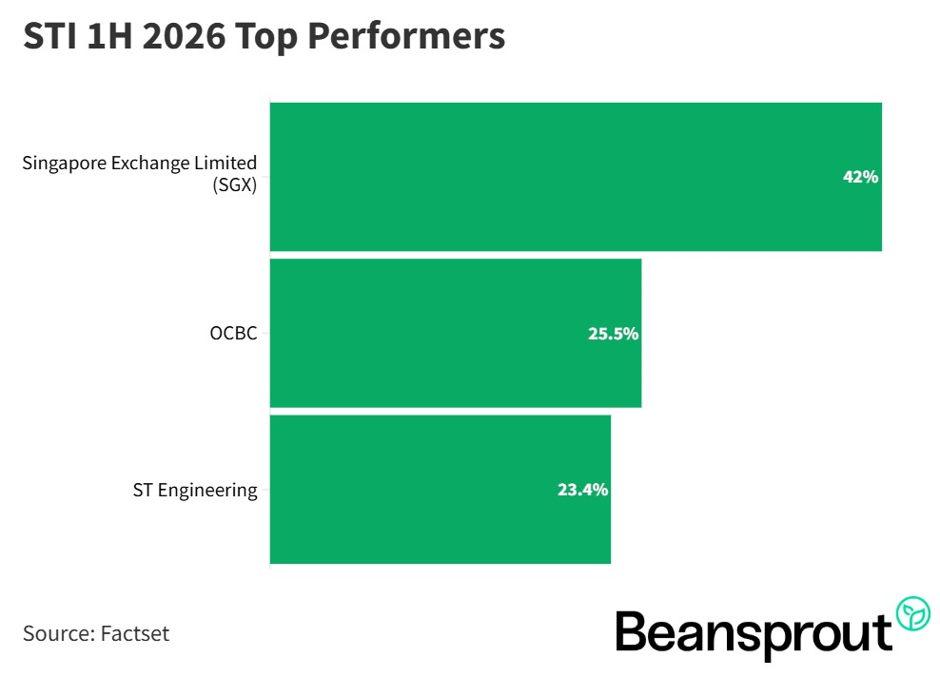
In this article, we take a look at the 3 best-performing Singapore blue chip stocks in 1H 2026, and whether their latest results, business momentum and dividend outlook are strong enough to support further gains.
3 best-performing Singapore blue chip stocks in 1H 2026
#1 - Singapore Exchange Limited (SGX: S68)
Singapore Exchange, or SGX, is Singapore’s sole exchange operator, with businesses across equities, fixed income, currencies and commodities.
SGX's share price rose about 42.0% in 1H 2026 to around S$24.50 as at 30 June 2026, reaching an all-time high, making it the best-performing blue chip stock over the period.
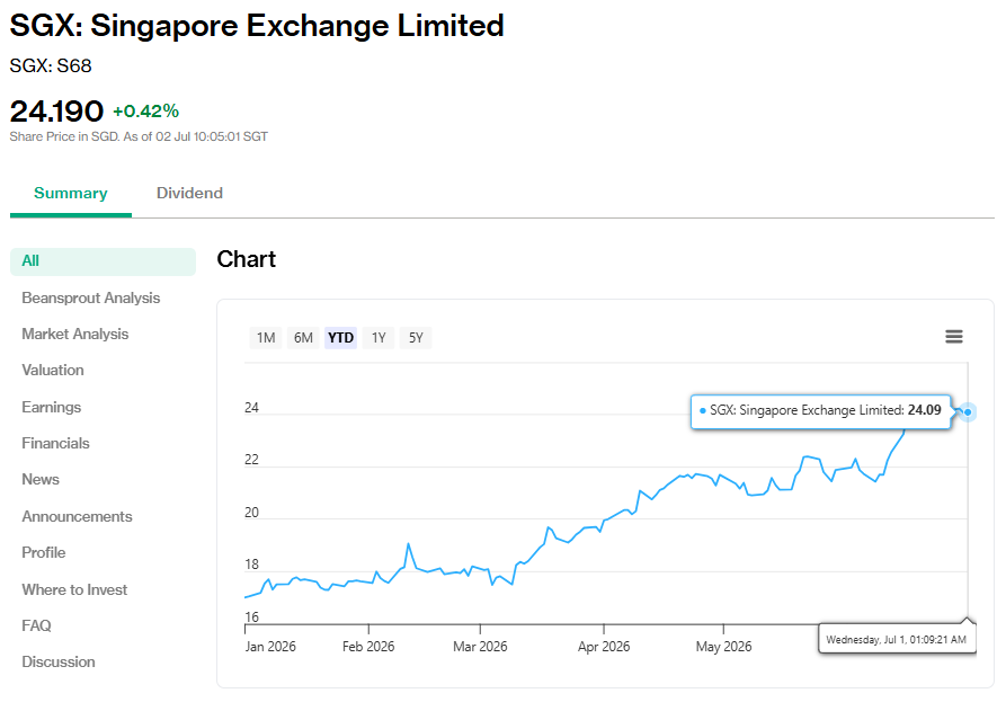
The rally was supported by SGX’s strongest-ever half-year results and growing optimism around efforts to revitalise Singapore’s equity market.
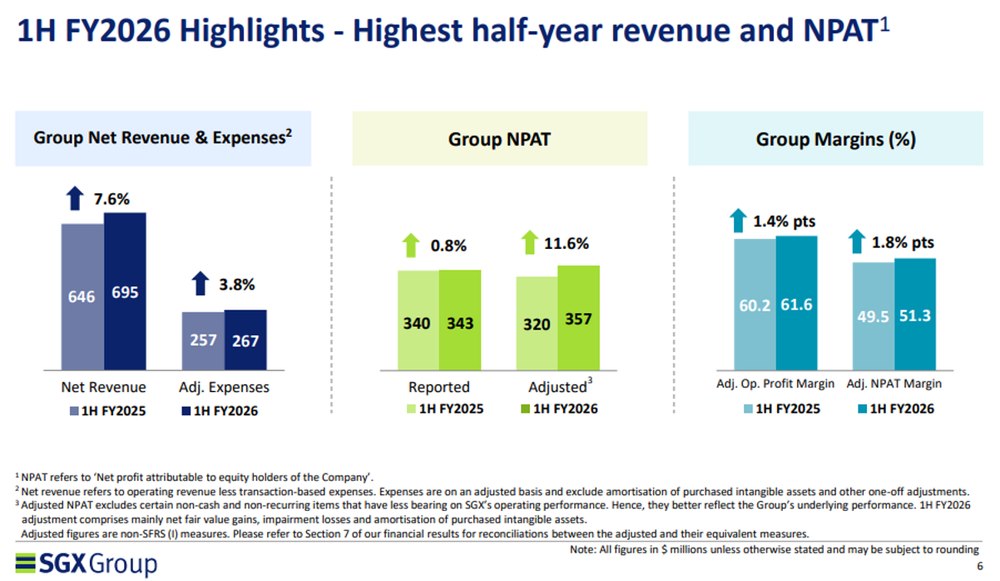
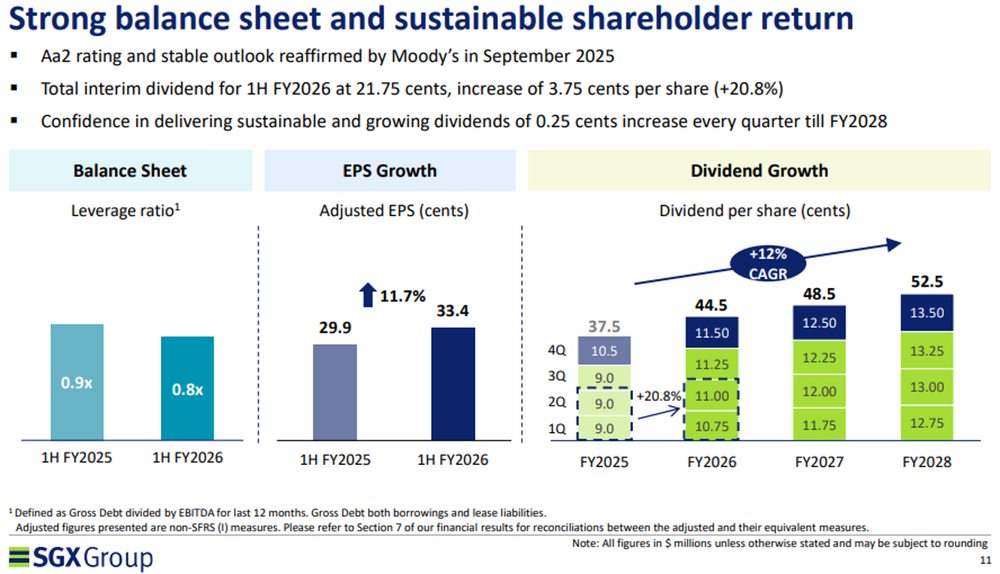
For the first half of financial year 2026 (1H FY2026), SGX reported net revenue of S$695.4 million, up 7.6% year-on-year and its highest half-year revenue on record. Excluding treasury income, net revenue grew 10.1% to S$636.6 million. Adjusted net profit rose 11.6% to S$357.1 million, while adjusted earnings per share increased to 33.4 cents.
Growth was broad-based across SGX’s multi-asset platform. Equities cash revenue rose 16.2% to S$223.9 million, supported by a 19.5% increase in securities daily average value to S$1.51 billion.
Fixed Income, Currencies and Commodities revenue grew 12.5% to S$178.9 million. Commodity derivatives volumes rose 24.2%, helped by record iron ore trading, while SGX FX average daily volume increased 32.3% to a record US$180 billion.
SGX also raised its dividends. It declared interim quarterly dividends of 11.0 cents per share for 2QFY2026, up 2.0 cents year-on-year, bringing total 1H FY2026 dividends to 21.75 cents per share. Management also reiterated its commitment to raising dividends by 0.25 cents per share every quarter through FY2028.
Momentum has continued into the second half. In May 2026, securities daily average value reached S$2.41 billion, up 79% year-on-year and 17% month-on-month. This was the highest level since October 2007, while retail participation reached a 13-year high.
Derivatives daily average volume also rose 27% year-on-year to the third-highest level on record.
A key driver has been the Equity Market Development Programme (EQDP). This is a S$6.5 billion government-backed initiative aimed at improving liquidity in Singapore’s stock market.
Only about one-third of the programme is estimated to have been deployed so far, suggesting that further support could still come through.
SGX is also seeing stronger listing activity, with the exchange on track for close to 30 listings in 2026. This could be supported by the EQDP and the upcoming SGX-Nasdaq dual-listing framework.
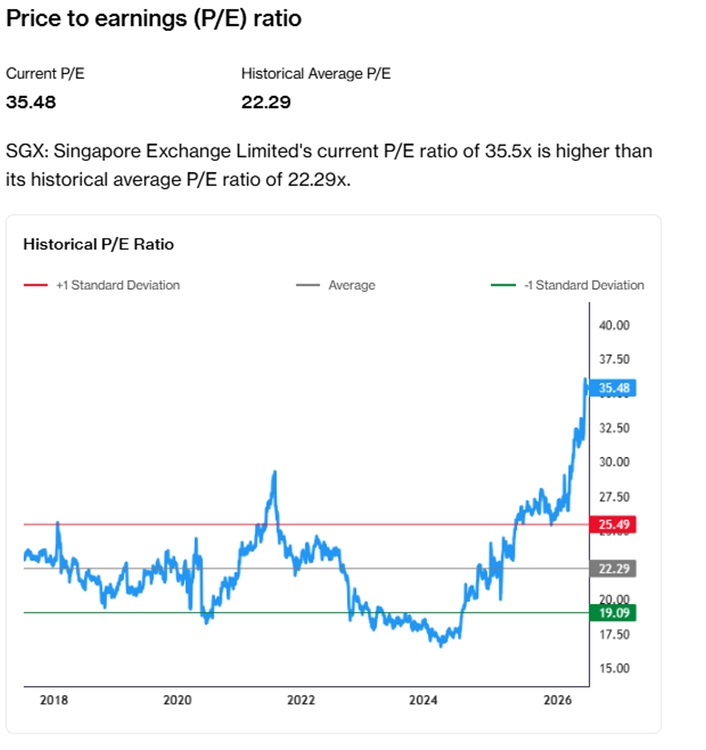
At around 35 times current price-to-earnings (P/E), SGX is no longer cheap. The premium valuation reflects expectations of continued earnings growth, stronger trading activity, SGD safe-haven inflows, EQDP deployment and Singapore’s rising role as a wealth hub.
The key risk is that trading volumes moderate from current elevated levels, or that growth across SGX’s asset classes slows. With the valuation near multi-year highs, a large part of the positive outlook may already be reflected in the share price.
Looking at SGX through Beansprout’s Opportunity framework, the stock still screens strongly across the key factors we track.
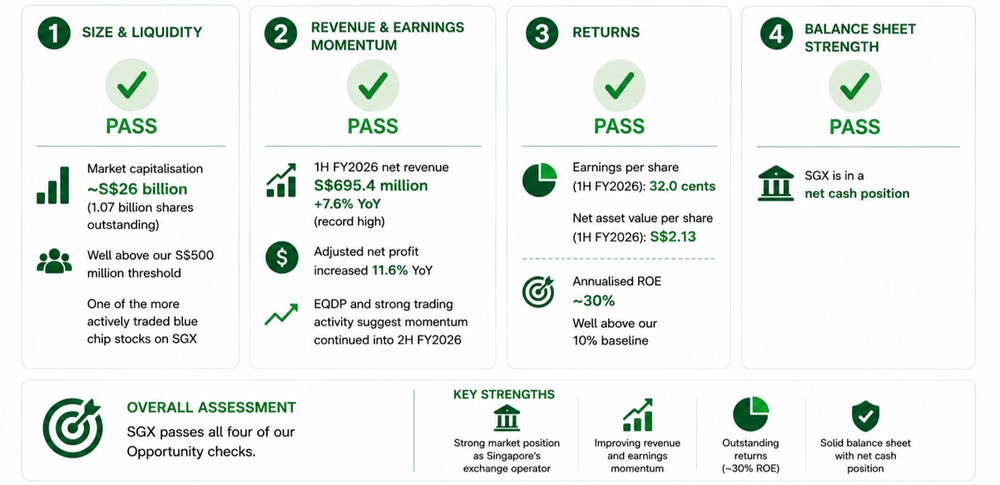
SGX has sufficient size and liquidity, with a market capitalisation of around S$26 billion based on about 1.07 billion shares outstanding. .
As Singapore’s exchange operator, it is also one of the more actively traded blue chip stocks on the Singapore Exchange.
Revenue and earnings momentum have improved. 1H FY2026 net revenue rose 7.6% to a record S$695.4 million, while adjusted net profit grew 11.6%. The EQDP and strong trading activity suggest that momentum has continued into 2H FY2026.
Returns are a standout. Based on 1H FY2026 earnings per share of 32.0 cents and net asset value per share of S$2.13, annualised return on equity works out to about 30%, well above our 10% baseline.
Balance sheet strength remains another positive, with SGX in a net cash position.
Overall, SGX passes all four of our Opportunity checks.
The business has strong earnings momentum, high returns and a resilient balance sheet.
However, after the sharp share price rally, valuation is the main consideration for new investors.
Find out how much dividends you would have received as a shareholder of SGX in the past 12 months with the calculator below.
Related links:
#2 - Oversea-Chinese Banking Corporation (SGX: O39)
OCBC is Singapore’s second-largest bank by assets, with businesses across consumer banking, private banking, wholesale banking, global markets and insurance through Great Eastern Holdings.
Its share price rose about 25.5% in 1H 2026 to around S$24.78 as at 30 June 2026, reaching a new high.
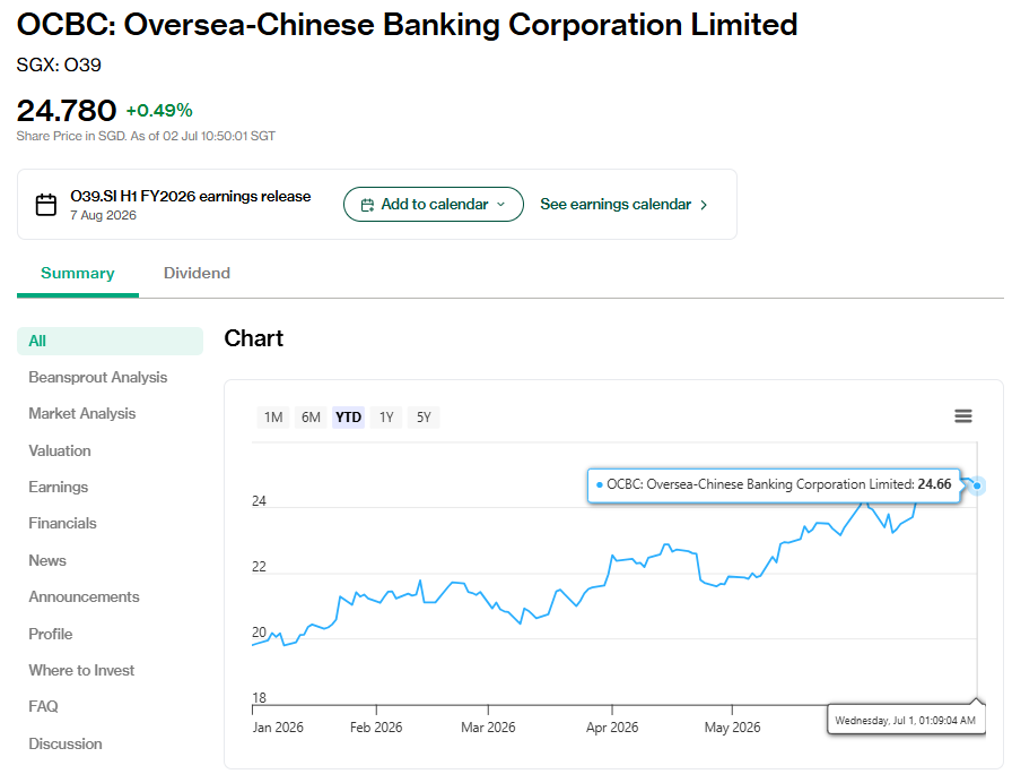
The rally was supported by a resilient 1Q2026 performance, where record non-interest income helped offset pressure from lower interest rates.
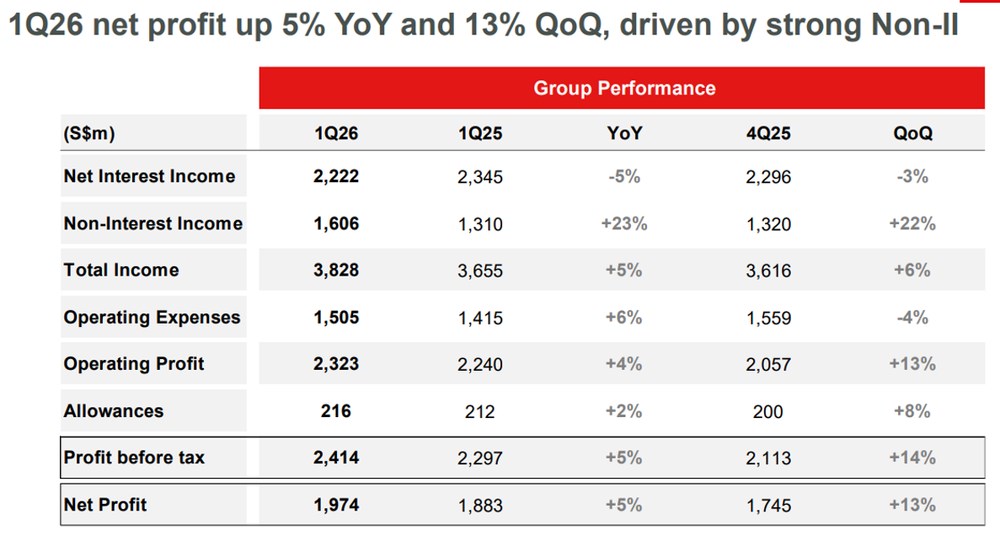
For 1Q2026, OCBC reported net profit of S$1.97 billion, up 5% year-on-year and 13% quarter-on-quarter. Total income rose 5% year-on-year and 6% quarter-on-quarter to a record S$3.83 billion.
Return on equity stood at 13.0% on an annualised basis, while annualised earnings per share was S$1.76.
The main drag came from net interest income, which fell 5% year-on-year to S$2.22 billion. Net interest margin narrowed by 28 basis points to 1.76% as interest rates declined.
However, this was largely offset by stronger non-interest income, which rose 23% year-on-year to a record S$1.61 billion and made up almost 42% of total income.
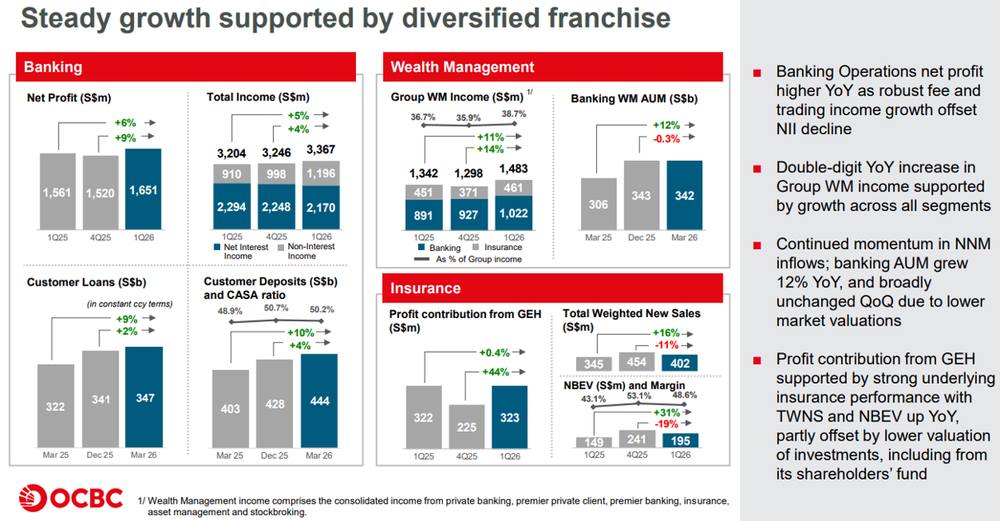
Fee and wealth management income were the standout areas.
Net fee income rose 24% year-on-year to S$675 million, driven by wealth management fees, which grew 34% to S$422 million across all wealth product channels.
Net trading income rose 10% to S$434 million, supported by record customer flow income, while insurance income climbed 34% to S$409 million on stronger performance from Great Eastern Holdings.
OCBC’s group wealth management income rose 11% year-on-year to S$1.48 billion, contributing 39% of group income. Banking wealth management assets under management increased 12% year-on-year to S$342 billion.
Asset quality remained healthy.
OCBC’s non-performing loan ratio stayed at 0.9% for the eighth consecutive quarter, while total allowance coverage for non-performing assets rose to 163%.
The group also set aside S$191 million of allowances for non-impaired assets, reflecting a more cautious stance given macroeconomic uncertainty.
Capital strength remains a key attraction.
OCBC’s Common Equity Tier 1 (CET1) capital adequacy ratio (CAR) stood at 17.0% on a transitional basis and 15.2% on a fully phased-in basis as at 31 March 2026, comfortably above regulatory requirements.
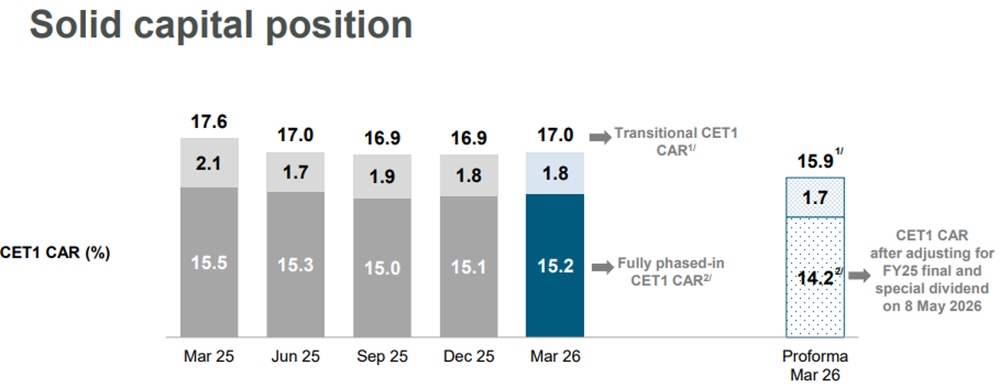
For FY2025, OCBC paid total dividends of 99 cents per share, comprising an interim dividend of 41 cents, a final dividend of 42 cents and a special dividend of 16 cents.
The special dividend forms part of OCBC’s S$2.5 billion capital return plan targeted for completion by FY2026.
Based on the FY2025 dividend and OCBC’s share price of S$24.78 as at 30 June 2026, the historical dividend yield is about 4.0%.
Management remains cautious on the macro outlook, pointing to geopolitical tensions, the Middle East conflict, energy prices and trade tariffs as key risks to watch.
At the same time, OCBC continues to expand its regional wealth franchise, including its announced acquisition of HSBC’s wealth business in Indonesia.
For OCBC, the key question is whether continued growth in wealth management and fee income can offset pressure on net interest margins if interest rates remain lower for longer.
OCBC’s latest numbers also hold up well when viewed through Beansprout’s Opportunity framework.
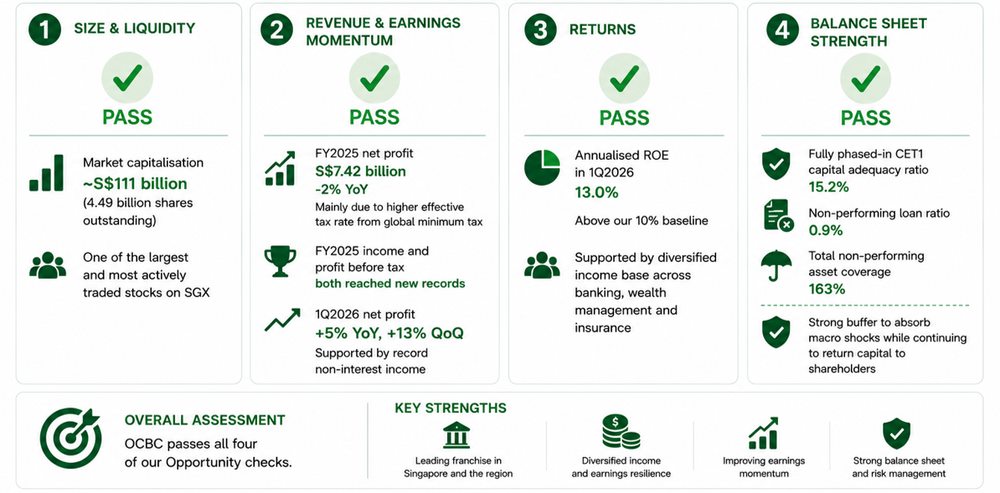
The bank has sufficient size and liquidity, with a market capitalisation of around S$111 billion based on about 4.49 billion shares outstanding. This makes OCBC one of the largest and most actively traded stocks on SGX.
Earnings momentum has improved.
While FY2025 net profit dipped 2% to S$7.42 billion, this was mainly due to a higher effective tax rate from the global minimum tax rather than weaker underlying operations. In fact, FY2025 income and profit before tax both reached new records.
The momentum turned more positive in 1Q2026, with net profit rising 5% year-on-year and 13% quarter-on-quarter, supported by record non-interest income.
Returns remain healthy, with annualised return on equity of 13.0% in 1Q2026, above our 10% baseline.
This was supported by OCBC’s diversified income base across banking, wealth management and insurance.
Balance sheet strength is also a clear positive.
OCBC had a fully phased-in CET1 capital adequacy ratio of 15.2%, a non-performing loan ratio of 0.9%, and total non-performing asset coverage of 163%.
This gives the bank a strong buffer to absorb macro shocks while continuing to return capital to shareholders.
Overall, OCBC passes all four of our Opportunity checks.
The stock is supported by strong capital, resilient asset quality, improving fee income and a growing wealth management franchise.
The main items to watch are net interest margin trends and execution on its regional wealth management expansion, including the pending HSBC Indonesia wealth acquisition.
Find out how much dividends you would have received as a shareholder of OCBC in the past 12 months with the calculator below.
Related links:
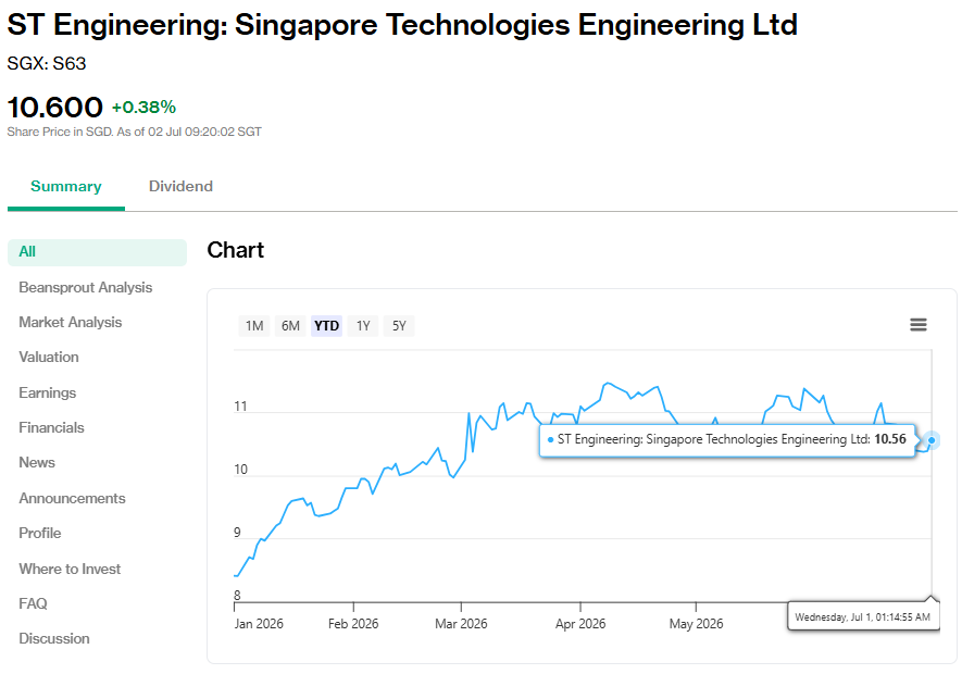
#3 - Singapore Technologies Engineering Ltd (SGX: S63)
ST Engineering is a global technology, defence and engineering group with businesses across Commercial Aerospace, Defence & Public Security, and Urban Solutions & Satcom.
ST Engineering's share price rose about 23.4% in 1H 2026 to around S$10.39 as at 30 June 2026. The performance was supported by a strong 1Q2026 business update, broad-based revenue growth across all three segments, and a record order book.
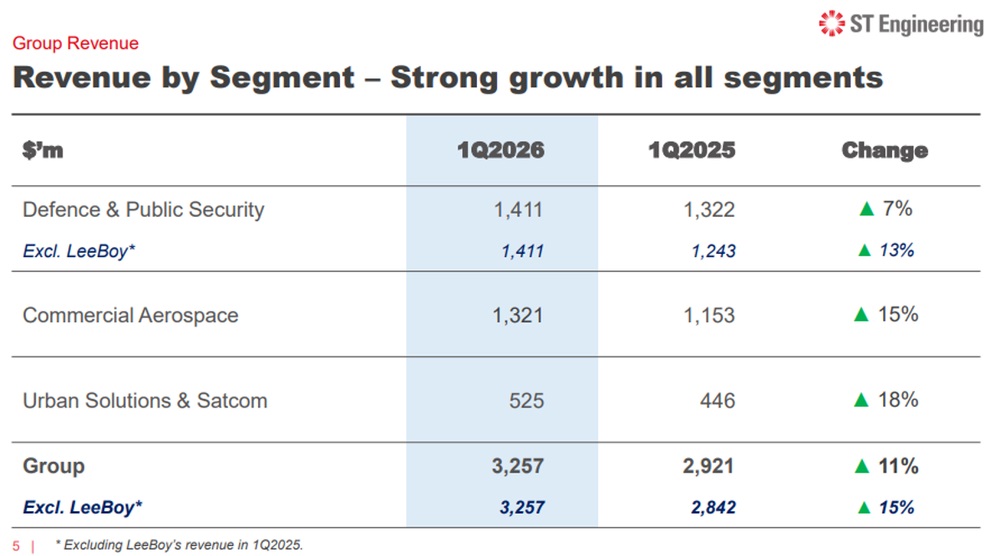
For 1Q2026, group revenue rose 11% year-on-year to S$3.26 billion, or 15% on a rebased basis excluding LeeBoy, which was divested in September 2025. Net profit growth outpaced this rebased revenue growth.
The growth was broad-based.
Defence & Public Security revenue rose 7% year-on-year to S$1.41 billion, or 13% on a rebased basis, supported by growth across all sub-segments and continued international defence contract wins.
Commercial Aerospace revenue increased 15% to S$1.32 billion, driven by engine MRO and nacelle deliveries, while Urban Solutions & Satcom revenue grew 18% to S$525 million.
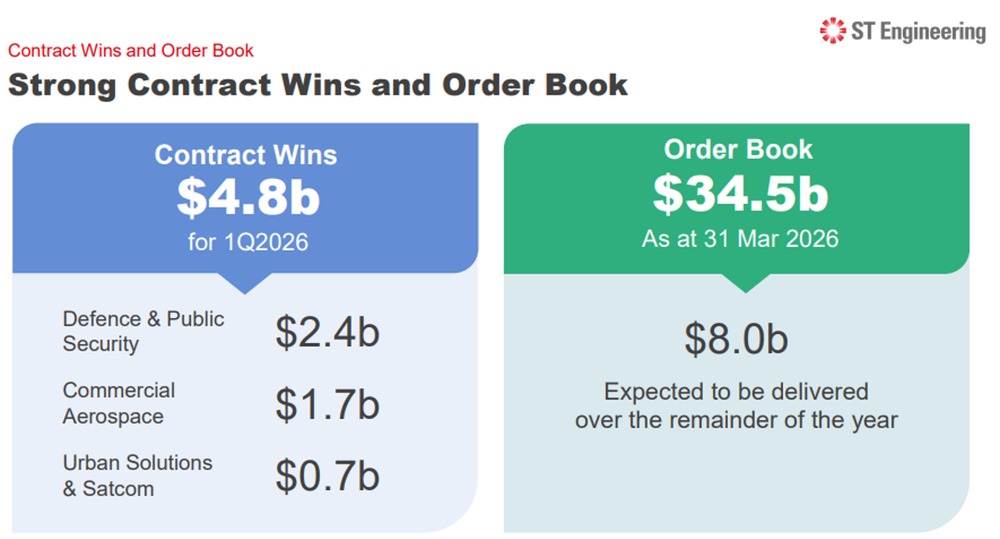
Order momentum remained a key highlight. New contract wins reached S$4.8 billion in 1Q2026, lifting the group’s order book to a record S$34.5 billion as at 31 March 2026. Management expects S$8.0 billion of the order book to be delivered over the rest of 2026.
International defence momentum also remained strong, with contracts including a five-year land platforms MRO agreement for the Qatar Emiri Land Forces worth about S$470 million, and a six-year S$600 million subcontract to supply platform systems for missile gun boats for the Kuwait Naval Force.
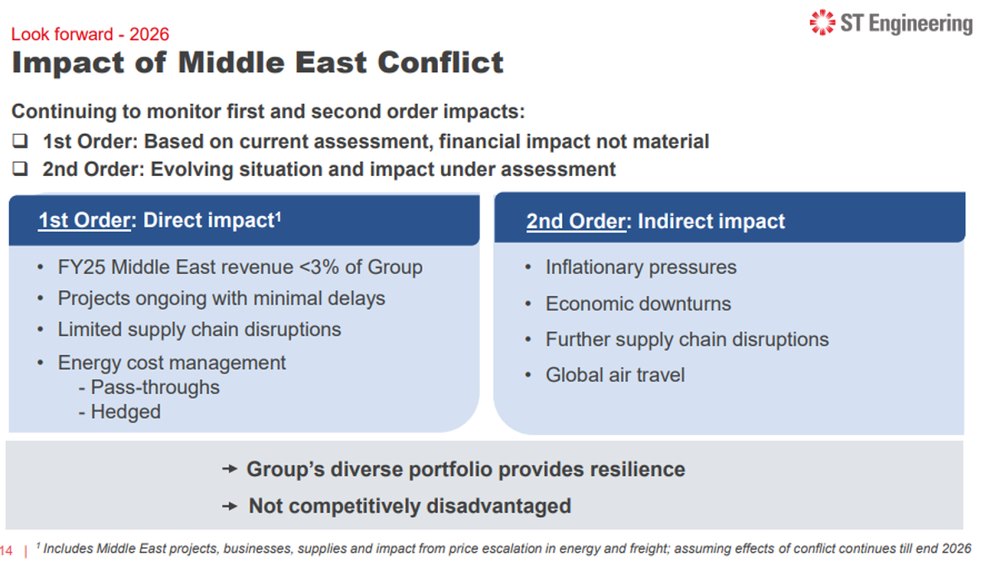
The direct impact from the Middle East conflict appears limited for now. ST Engineering said Middle East revenue exposure was less than 3% of group revenue in FY2025, with minimal project delays and energy cost pressures managed through hedging and cost pass-through arrangements. Management said the current financial impact is not material.
ST Engineering declared a 1Q2026 interim dividend of 4.0 cents per share, continuing the same quarterly cadence as FY2025.
In FY2025, the group paid total dividends of 23 cents per share, comprising three quarterly interim dividends of 4 cents each, a 6-cent final dividend and a 5-cent special dividend. Based on the FY2025 total dividend and share price of S$10.39 as at 30 June 2026, the historical dividend yield is about 2.2%.
Commercial Aerospace remains a key growth driver, supported by tight hangar and engine MRO capacity as airlines continue to secure maintenance slots. Urban Solutions also has strong visibility, with an order book of more than 4.5 times FY2025 revenue, excluding the US$1.7 billion New Jersey E-ZPass contract, which has not yet been recognised.
For ST Engineering, the Opportunity framework points to a company with strong business momentum, but a balance sheet that deserves closer attention.
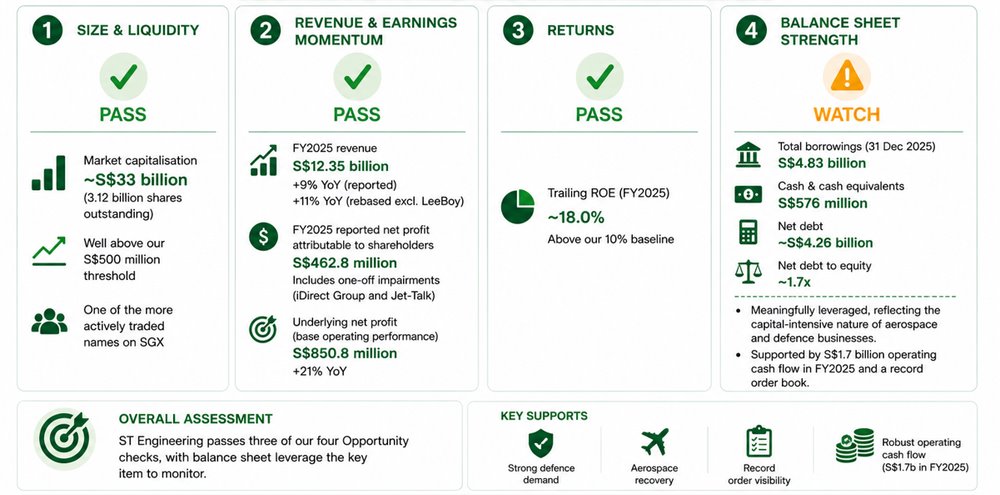
The group has sufficient size and liquidity, with a market capitalisation of around S$33 billion based on 3.12 billion shares outstanding. This is well above our S$500 million threshold and makes it one of the more actively traded names on the Singapore Exchange.
Revenue and earnings momentum also look strong. FY2025 revenue rose 9% year-on-year to S$12.35 billion, or 11% on a rebased basis excluding LeeBoy.
Reported net profit attributable to shareholders was S$462.8 million, but this included one-off impairments relating to iDirect Group and Jet-Talk. On a base operating performance basis, underlying net profit rose 21% to S$850.8 million.
Returns are healthy as well. Based on FY2025 net profit of S$462.8 million and average shareholders’ equity of about S$2.6 billion, trailing return on equity works out to around 18.0%, above our 10% baseline.
The main area to watch is balance sheet strength. As at 31 December 2025, total borrowings stood at S$4.83 billion against cash and cash equivalents of S$576 million, implying net debt of about S$4.26 billion. Net debt to equity is around 1.7x.
This is a meaningfully leveraged balance sheet, although it partly reflects the capital-intensive nature of ST Engineering’s aerospace and defence businesses. It is also supported by S$1.7 billion of operating cash flow generated in FY2025 and a record order book.
Overall, ST Engineering passes three of our four Opportunity checks, with balance sheet leverage the key item to monitor.
The group remains supported by strong defence demand, aerospace recovery and record order visibility, but after a strong share price rally, I would watch whether ST Engineering can sustain margin discipline and manage capex as it scales its Commercial Aerospace and international defence franchises.
Find out how much dividends you would have received as a shareholder of ST Engineering in the past 12 months with the calculator below.
Related links:
- ST Engineering latest valuation, share price and analysis
- ST Engineering dividend history and dividend forecast
What would Beansprout do?
The strong share price performance of SGX, OCBC and ST Engineering in 1H 2026 shows that Singapore blue chips can still offer meaningful gains, but the drivers were different.
SGX looks like the clearest structural growth story, supported by higher trading activity, the S$6.5 billion EQDP and Singapore’s rising role as a financial and wealth hub.
However, with the stock trading near multi-year high valuations, I would want to see continued strength in securities daily average value and listing activity in 2H2026. Learn more about SGX here.
OCBC stands out for its diversified earnings base, with wealth management and insurance helping to offset pressure from lower net interest margins.
Its strong capital position, healthy asset quality and regional wealth expansion remain positives, though margin trends will be important to watch. Learn more about OCBC here.
ST Engineering offers the most defensive earnings visibility of the three, backed by a record order book, broad-based segment growth and limited direct exposure to the Middle East conflict.
However, I would keep an eye on its net debt position and valuation, especially after the strong re-rating in 1H 2026. Learn more about ST Engineering here.
SGX and OCBC screen more strongly across growth, returns and balance sheet strength, while ST Engineering remains attractive for defensive growth but carries more balance sheet and valuation risk.
| Stock | The good | Key risks |
| SGX |
|
|
| OCBC |
|
|
| ST Engineering |
|
|
Overall, these Singapore blue chip stocks is aligned with our view on why Singapore stocks are still worth looking at in 2026.
There may also be other avenues to capture structural growth in the Singapore market, including companies linked to infrastructure, data centres, energy and food security as well as Singapore's rise as a wealth hub. Find out more about the 4 growth themes we are watching in Singapore stocks here.
If you are looking for more Singapore stock ideas linked to long-term growth themes, you can explore our high-conviction curated stock opportunities here.
Learn more about Beansprout's four pots of wealth framework to grow your wealth with clarity here.
If you prefer broad exposure to blue chips without picking individual names, you can also learn more about the Straits Times Index (STI).
Is there a Singapore blue chip stock you are looking out for in 2H2026? Share with us in the comments below or in our Telegram group!
Planning to invest in Singapore blue chip stocks? Compare the best Singapore brokers to find the right trading platform, and see the latest promotions and sign-up rewards available.
Follow Beansprout on YouTube, Facebook and Instagram, and add Beansprout as your preferred source on Google so you never miss an update.
Read also
Gain financial insights in minutes
Subscribe to our free weekly newsletter for more insights to grow your wealth
Most Popular

Comments
0 comments