3 blue-chip REITs with dividend yields above 5%. What we’re watching in June 2026
REITs
By Gerald Wong, CFA • 13 Jun 2026
Why trust Beansprout? We’ve been awarded Best Investment Website at the SIAS Investors’ Choice Awards 2025
'%3e%3cpath%20fill-rule='evenodd'%20clip-rule='evenodd'%20d='M17.64%209.20455C17.64%208.56637%2017.5827%207.95273%2017.4764%207.36364H9V10.845H13.8436C13.635%2011.97%2013.0009%2012.9232%2012.0477%2013.5614V15.8195H14.9564C16.6582%2014.2527%2017.64%2011.9455%2017.64%209.20455V9.20455Z'%20fill='%234285F4'/%3e%3cpath%20fill-rule='evenodd'%20clip-rule='evenodd'%20d='M9%2018C11.43%2018%2013.4673%2017.1941%2014.9564%2015.8195L12.0477%2013.5614C11.2418%2014.1014%2010.2109%2014.4205%209%2014.4205C6.65591%2014.4205%204.67182%2012.8373%203.96409%2010.71H0.957275V13.0418C2.43818%2015.9832%205.48182%2018%209%2018V18Z'%20fill='%2334A853'/%3e%3cpath%20fill-rule='evenodd'%20clip-rule='evenodd'%20d='M3.96409%2010.71C3.78409%2010.17%203.68182%209.59318%203.68182%209C3.68182%208.40682%203.78409%207.83%203.96409%207.29V4.95818H0.957273C0.347727%206.17318%200%207.54773%200%209C0%2010.4523%200.347727%2011.8268%200.957273%2013.0418L3.96409%2010.71V10.71Z'%20fill='%23FBBC05'/%3e%3cpath%20fill-rule='evenodd'%20clip-rule='evenodd'%20d='M9%203.57955C10.3214%203.57955%2011.5077%204.03364%2012.4405%204.92545L15.0218%202.34409C13.4632%200.891818%2011.4259%200%209%200C5.48182%200%202.43818%202.01682%200.957275%204.95818L3.96409%207.29C4.67182%205.16273%206.65591%203.57955%209%203.57955V3.57955Z'%20fill='%23EA4335'/%3e%3c/g%3e%3cdefs%3e%3cclipPath%20id='clip0_0_2849'%3e%3crect%20width='18'%20height='18'%20fill='white'/%3e%3c/clipPath%3e%3c/defs%3e%3c/svg%3e)
Make Beansprout your preferred source on Google
Add us on Google to see more of our insights in your search results
These 3 Singapore blue-chip REITs offer dividend yields above 5%. We look at their latest results, portfolio strengths and whether dividends can hold up.
What happened?
Singapore REITs have started to draw renewed attention.
Last month, we shared why some blue-chip Singapore REITs remain near their five-year lows, even as the Straits Times Index has performed strongly.
Earlier, we also looked at how Singapore REITs have lagged the broader market even as dividend yields climbed, and where investors may still find opportunities.
More recently, we looked at data centre REITs with dividend yields of up to 8%, as investors looked for ways to gain exposure to cloud and AI-related demand through income-generating REITs.
Naturally, this has led to more questions in the Beansprout community on whether there are other blue-chip REITs that may still offer an attractive income opportunity in June 2026.
In this article, I look at three Singapore blue-chip REITs with yields above 5% in June 2026, and whether their dividends can continue to be supported by their latest operating performance.
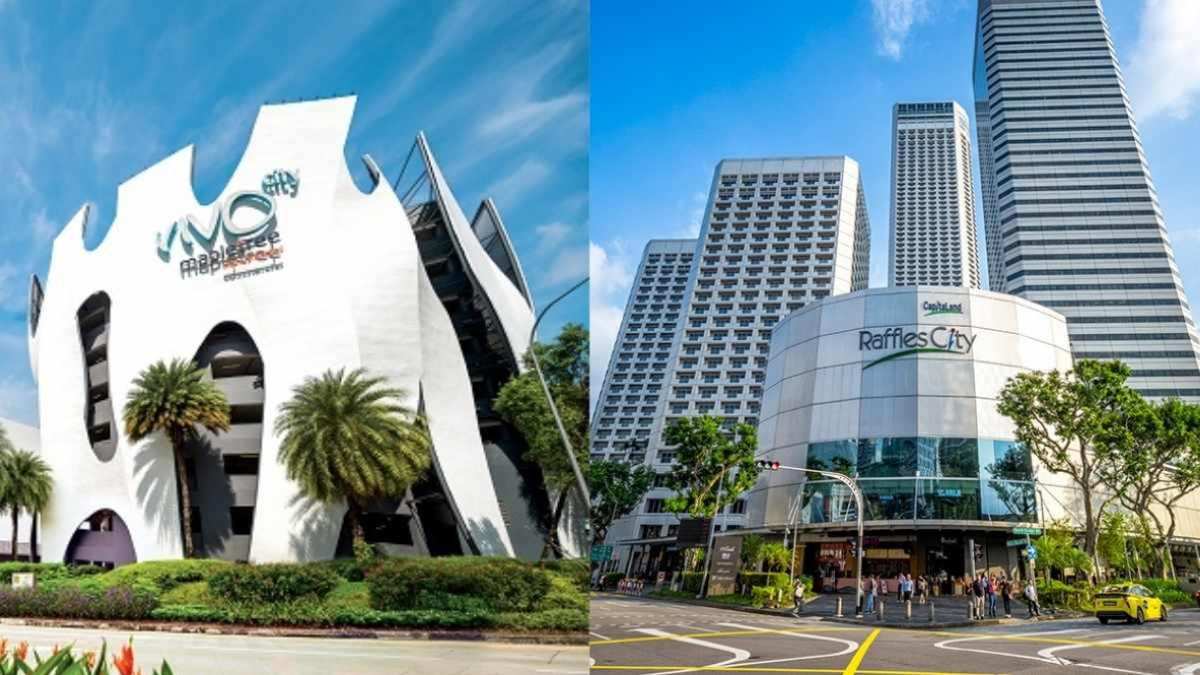
#1 – Mapletree Pan Asia Commercial Trust (SGX: N2IU)
Mapletree Pan Asia Commercial Trust, or MPACT, owns a portfolio of commercial properties across Singapore, Hong Kong, China, Japan and South Korea.
Its Singapore assets include VivoCity and Mapletree Business City, while its overseas assets include Festival Walk in Hong Kong, office assets in China and Japan, and The Pinnacle Gangnam in South Korea.
MPACT’s latest results show why the REIT remains a mixed story.
MPACT’s FY25/26 results show a portfolio that is becoming more Singapore-focused, but still affected by overseas weakness.

For FY25/26, MPACT’s portfolio net property income (NPI) fell year-on-year, weighed down by weaker contributions from overseas assets, divestments and foreign exchange movements.
However, Singapore remained the key support.
On a comparable basis, MPACT’s Singapore gross revenue rose 2.3% year-on-year, while Singapore NPI increased 4.1% year-on-year.
This helped to cushion the impact from weaker overseas contributions.
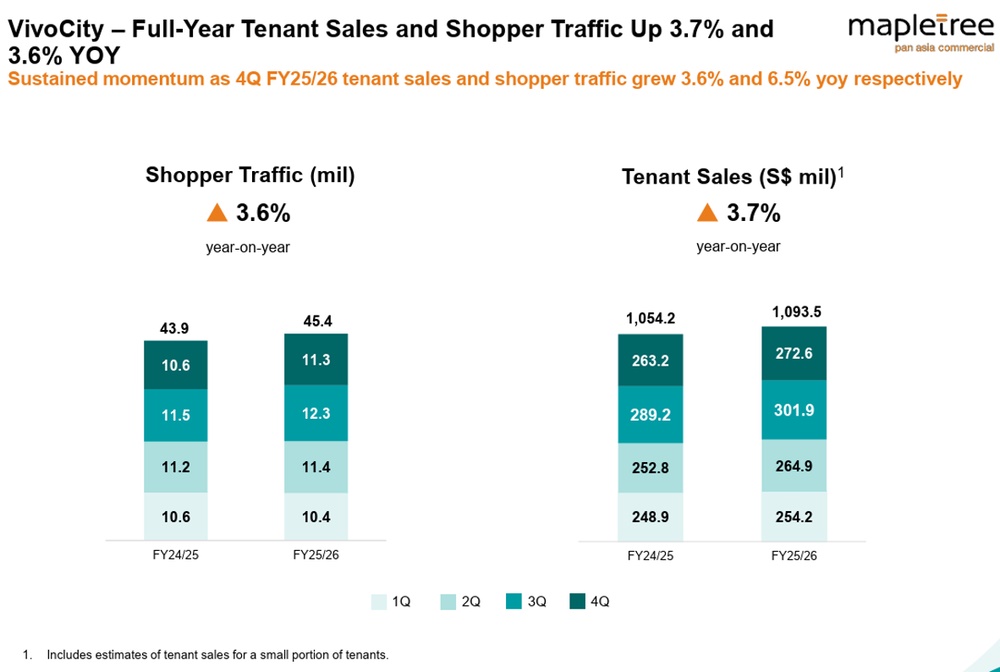
VivoCity remained the most important bright spot.
The mall posted 7.6% growth in full-year NPI despite asset enhancement disruptions.
Full-year tenant sales rose 3.7%, while shopper traffic increased 3.6%.
VivoCity also had near-full committed occupancy throughout the year, which supports its role as one of MPACT’s key income anchors.
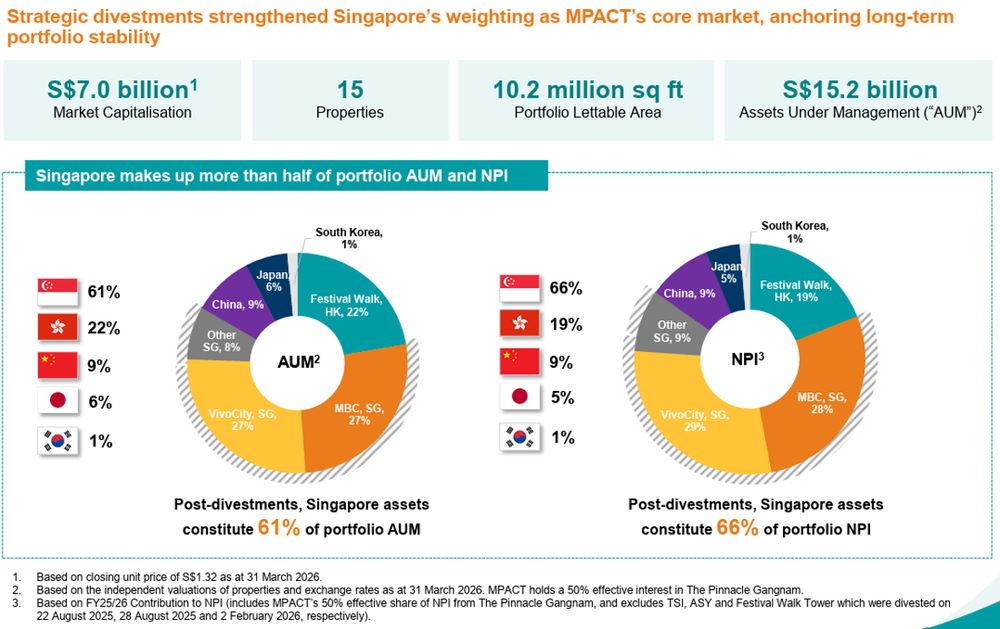
MPACT has also been reshaping its portfolio.
In FY25/26, it completed three divestments, including the divestment of Festival Walk Tower’s office component.
The net proceeds were deployed towards debt reduction.
Following these divestments, Singapore assets accounted for 61% of portfolio assets under management and 66% of portfolio NPI.
This gives MPACT a stronger Singapore income base than before.
However, the overseas portfolio remains the key risk.
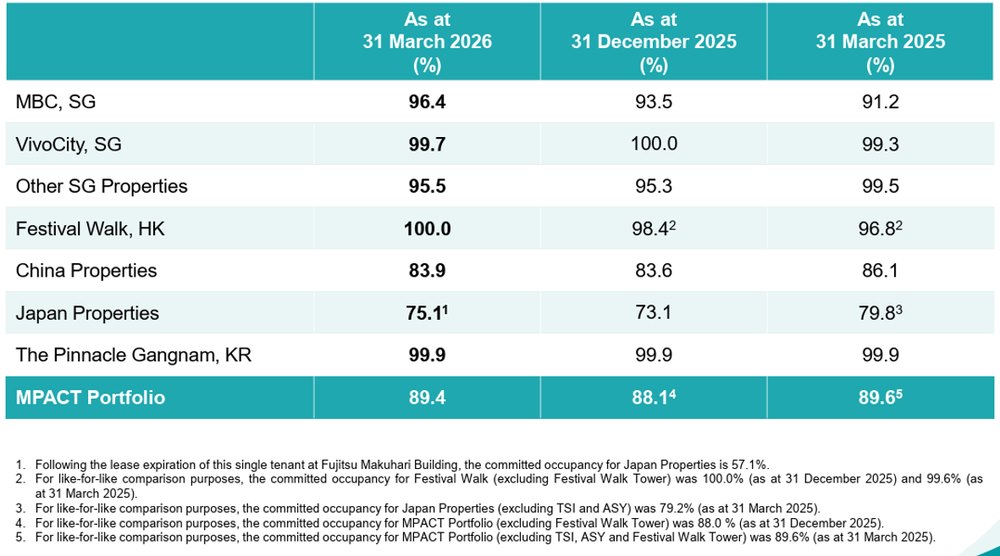
As at 31 March 2026, portfolio committed occupancy stood at 89.4%.
VivoCity and Festival Walk had high committed occupancies of 99.7% and 100.0% respectively.
However, China properties had committed occupancy of 83.9%, while Japan properties had committed occupancy of 75.1%.
This suggests that MPACT’s overall occupancy is still being weighed down by weaker overseas leasing conditions.
Foreign exchange also remains a watch point, as a stronger Singapore dollar can reduce the translated income contribution from overseas assets.
The portfolio’s weighted average lease expiry, or WALE, stood at 2.4 years as at 31 March 2026, giving MPACT a relatively balanced lease expiry profile.
At the same time, MPACT’s balance sheet has improved.
Aggregate leverage fell to 36.5% as at 31 March 2026.
Its weighted average all-in cost of debt declined to 3.16%, while interest coverage improved to 3.2 times. About 75.1% of debt was on fixed rates.
For FY25/26, MPACT reported Distribution Per Unit (DPU) of 7.97 Singapore cents, slightly lower than 8.02 Singapore cents in FY24/25.
However, the headline DPU decline does not tell the full story.
MPACT said that excluding a one-off tax charge from the Festival Walk Tower divestment, FY25/26 DPU would have been 1.1% higher year-on-year.
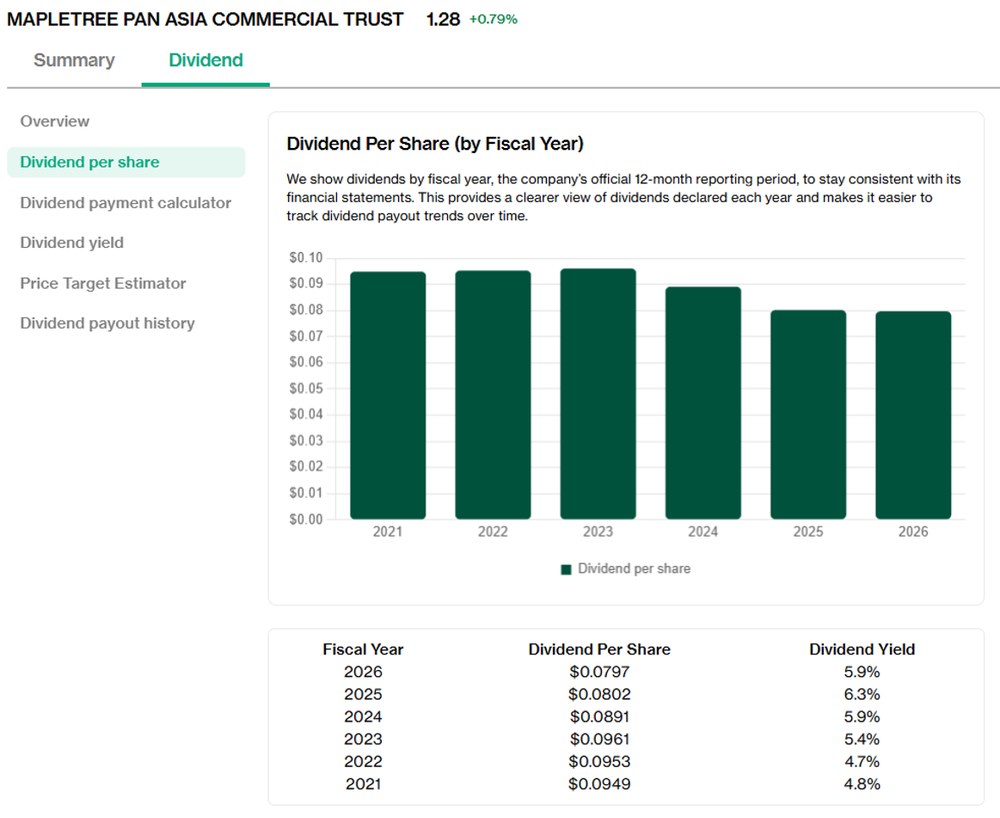
Based on its unit price of S$1.26 as of 11 June 2026, MPACT offers a forward dividend yield of 6.3% and a trailing twelve-month dividend yield of 6.3%.
MPACT’s dividend looks better supported than the headline DPU decline may suggest, as Singapore assets remain resilient and finance costs have improved.
However, for DPU to grow more meaningfully, I would want to see clearer signs that the drag from overseas assets is easing.
Find out how much dividends you would have received as a unitholder of Mapletree Pan Asia Commercial Trust in the past 12 months with the calculator below.
Related links:
- Mapletree Pan Asia Commercial Trust latest valuation, share price and analysis
- Mapletree Pan Asia Commercial Trust dividend history and forecast
#2 – Frasers Logistics & Commercial Trust (SGX: BUOU)
Frasers Logistics & Commercial Trust, or FLCT, owns logistics, industrial and commercial properties across Australia, Germany, Singapore, the United Kingdom and the Netherlands.
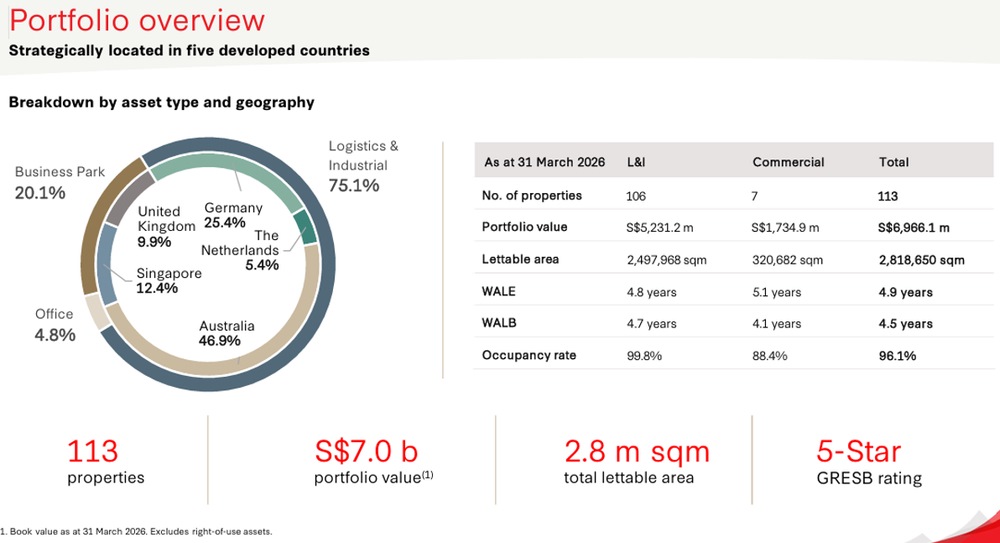
As at 31 March 2026, FLCT had 113 properties with a portfolio value of about S$7.0 billion.
Logistics and industrial assets made up about 75.1% of its portfolio value, while business park and office assets made up the rest.
FLCT’s 1HFY26 results show that its operating portfolio remains steady.
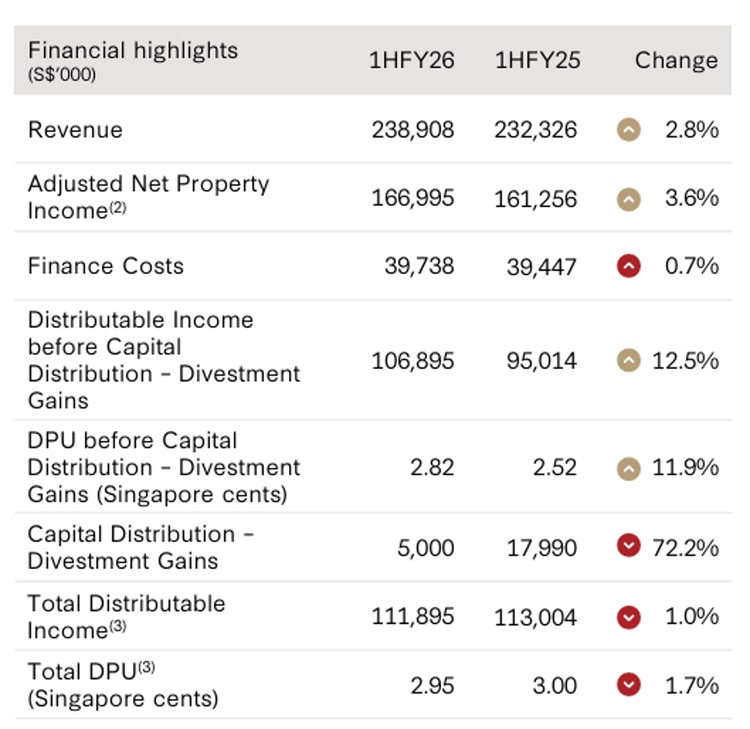
For 1HFY26, FLCT reported revenue of S$238.9 million, up 2.8% year-on-year. Adjusted NPI rose 3.6% year-on-year to S$167.0 million.
This was supported by positive rental reversions, annual rent increments and contribution from 2 Tuas South Link 1, which was acquired in November 2024.
However, higher vacancies at Alexandra Technopark and Farnborough Business Park, as well as higher non-recoverable land taxes in Australia, partly offset the improvement.
Operationally, the logistics and industrial portfolio remained the main strength.
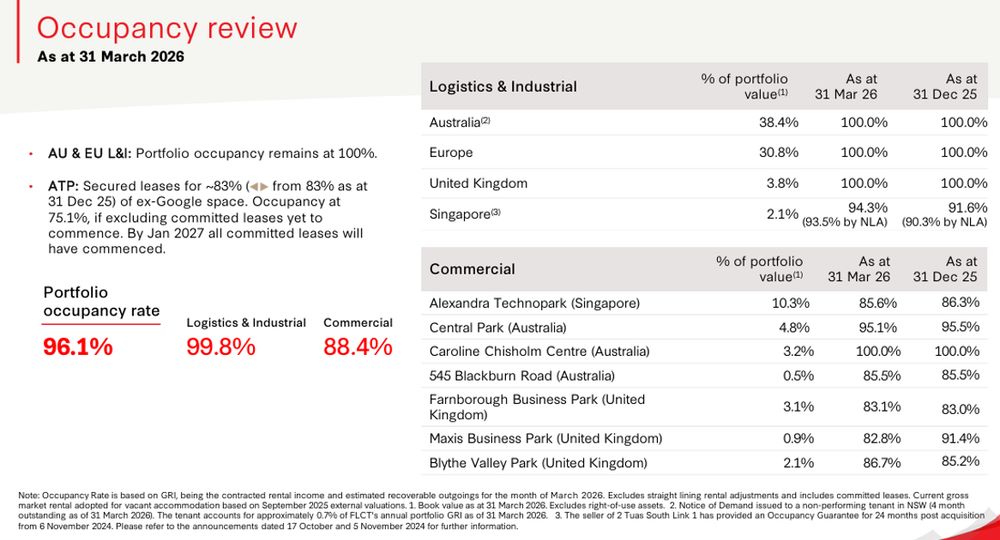
Portfolio occupancy stood at 96.1% as at 31 March 2026.
The logistics and industrial portfolio was almost fully occupied at 99.8%.
Within this segment, FLCT’s Australia and Europe logistics and industrial portfolios remained at 100% occupancy.
The weaker part of the portfolio was the commercial segment, where occupancy was lower at 88.4%.
Alexandra Technopark remained a key area to watch, although FLCT said it had secured leases for about 83% of the former Google space.
FLCT’s portfolio also had a WALE of 4.9 years as at 31 March 2026, which provides some visibility over rental income, especially for its logistics and industrial assets.
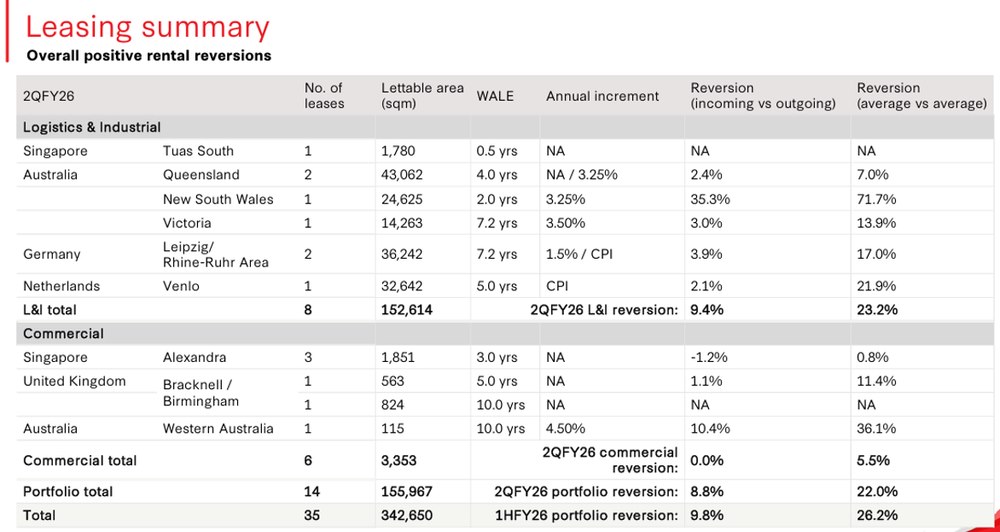
FLCT also reported positive rental reversions.
Face rental reversions were 9.8% on an incoming versus outgoing basis.
On an average versus average basis, rental reversions were 26.2%.
This suggests that leasing demand for FLCT’s assets remains healthy, especially in the logistics and industrial segment.
The balance sheet also remains relatively comfortable.
Aggregate leverage stood at 33.7% as at 31 March 2026.
Its cost of borrowing was 3.2% on a trailing twelve-month basis. About 75% of borrowings were on fixed rates.
This provides some protection if interest rates remain volatile.
For 1HFY26, FLCT reported DPU of 2.95 Singapore cents, down 1.7% from 3.00 Singapore cents in 1HFY25.
At first glance, this looks like a weaker distribution.
However, the decline was mainly due to a smaller capital distribution from divestment gains.
DPU before capital distribution from divestment gains rose to 2.82 Singapore cents in 1HFY26, from 2.52 Singapore cents in 1HFY25.
This is an important distinction for income investors. It suggests that FLCT’s recurring operating income has improved, even though headline DPU was slightly lower.
FLCT has also continued to grow its logistics exposure.
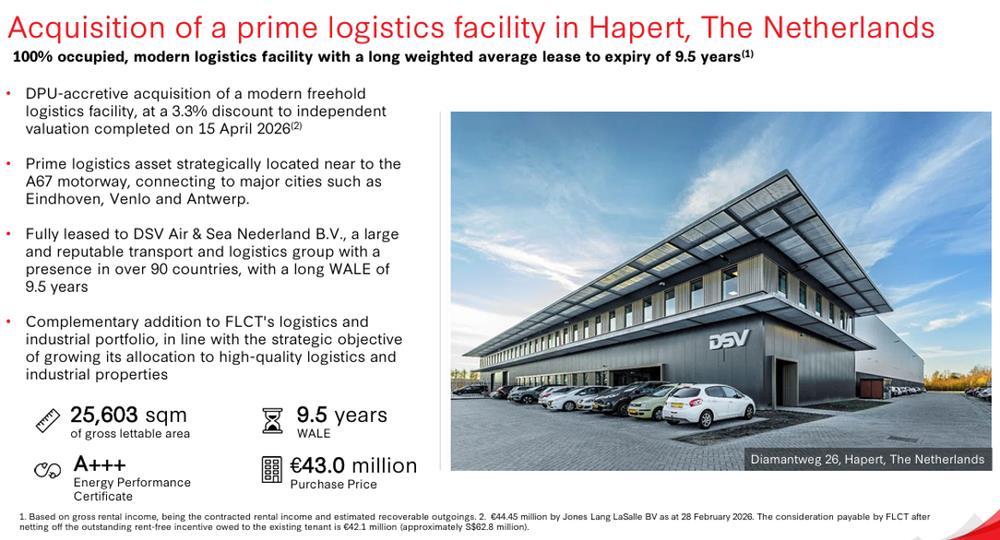
In May 2026, FLCT announced the proposed acquisition of four logistics properties in Germany and the Netherlands from Frasers Property.
The proposed acquisition is expected to be fully funded by external debt.
On a pro forma basis, FLCT said 1HFY26 DPU would have increased from 2.95 Singapore cents to 3.00 Singapore cents.
The acquisition would also lift the proportion of logistics and industrial assets from 75.1% to 76.6% of the portfolio.
Based on its unit price of S$0.975 as of 11 June 2026, FLCT offers a forward dividend yield of 6.2% and a trailing twelve-month dividend yield of 6.1%.
FLCT’s dividend appears better supported when we focus on recurring rental income.
The logistics and industrial portfolio remains well occupied, rental reversions are positive, and leverage is relatively conservative.
However, I would still watch whether commercial occupancy improves, and whether future DPU growth can come mainly from recurring income rather than capital distributions.
Find out how much dividends you would have received as a unitholder of Frasers Logistics & Commercial Trust in the past 12 months with the calculator below.
Related links:
- Frasers Logistics & Commercial Trust latest valuation, share price and analysis
- Frasers Logistics & Commercial Trust dividend history and forecast
#3 – CapitaLand Integrated Commercial Trust (SGX: C38U)
CapitaLand Integrated Commercial Trust, or CICT, is Singapore’s first and largest listed REIT.
It owns a portfolio of retail, office and integrated development assets across Singapore, Germany and Australia.
Its Singapore assets include well-known malls and commercial properties such as Raffles City Singapore, Plaza Singapura, Bugis Junction, Funan, Junction 8, Tampines Mall, Westgate, CapitaSpring and ION Orchard.
CICT’s latest update points to a steady operating performance.
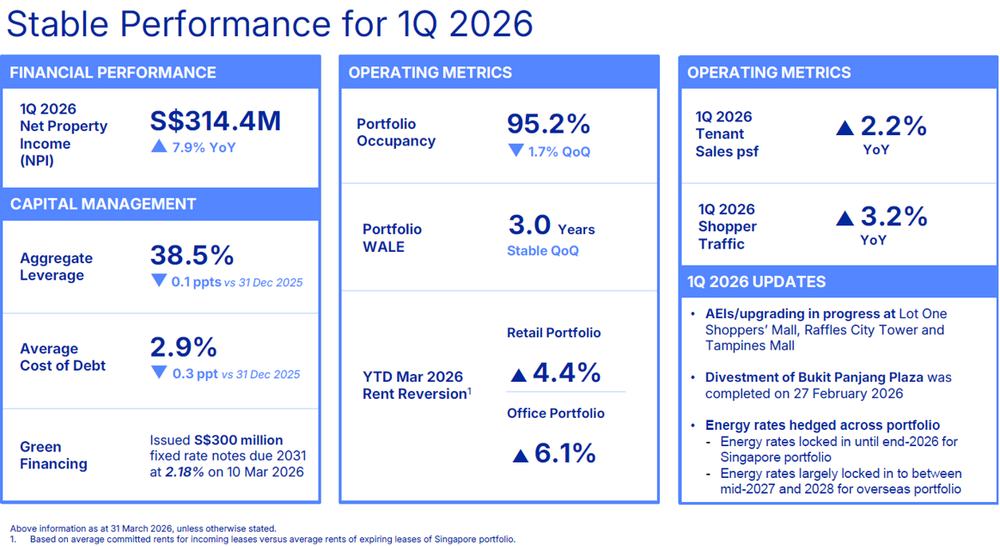
For 1Q 2026, CICT reported gross revenue of S$426.7 million, up 8.0% year-on-year. NPI rose 7.9% year-on-year to S$314.4 million.
This was supported by the full acquisition of a 100% interest in CapitaSpring and the income contribution from Gallileo in Frankfurt, Germany.
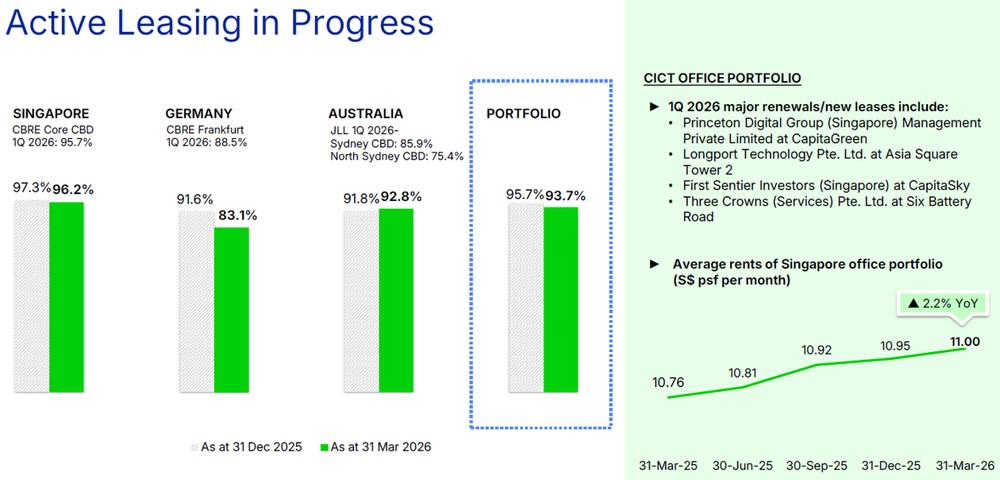
Portfolio occupancy stood at 95.2% as at 31 March 2026, while portfolio WALE was stable at 3.0 years.
CICT also reported positive rent reversions across both its retail and office portfolios.
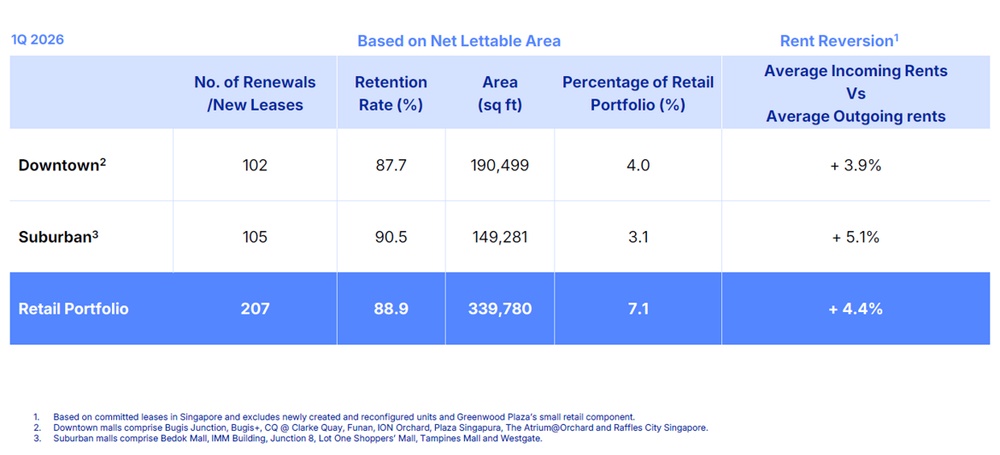
Retail rent reversion was 4.4%, while office rent reversion was 6.1% for 1Q 2026.
The retail portfolio remained resilient.
CICT’s retail portfolio reported committed occupancy of 97.8% as at 31 March 2026.
Tenant sales per square foot rose 2.2% year-on-year in 1Q 2026, while shopper traffic increased 3.2% year-on-year.
This suggests that CICT’s retail assets continue to benefit from resilient domestic spending, tourist arrivals and active leasing.
The office portfolio also showed signs of stability.
Average rents for CICT’s Singapore office portfolio rose 2.2% year-on-year to S$11.00 psf per month as at 31 March 2026.
Singapore office occupancy remained high at 96.2%, although occupancy across the overall office portfolio was lower at 93.7% due partly to overseas assets.
CICT has also been actively recycling capital.
In February 2026, CICT completed the divestment of Bukit Panjang Plaza.
In April 2026, it announced two larger transactions.
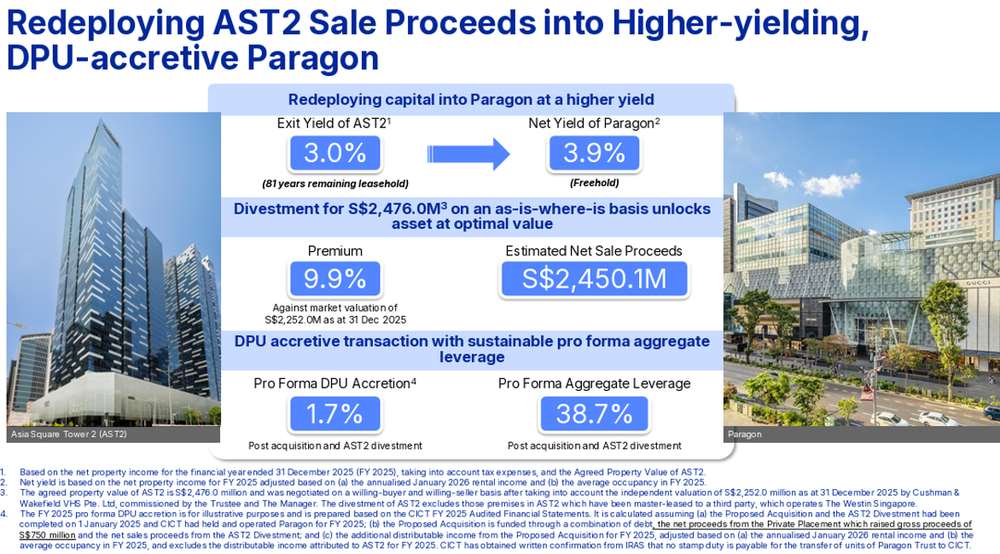
CICT agreed to acquire a 100% interest in Paragon for S$3.9 billion.
It also agreed to divest Asia Square Tower 2 for S$2.476 billion.
Paragon is a freehold integrated development along Orchard Road with retail, office and medical suites.
The transaction would increase CICT’s exposure to prime Singapore retail and medical office space.
The overall net yield for Paragon is 3.9%, compared with the 3.0% exit yield for Asia Square Tower 2. CICT said the proposed acquisition is expected to deliver DPU accretion of 2.1%.
The relatively low net yield may mean investors should watch whether the transaction can contribute meaningfully to DPU growth over time.
For FY2025, CICT reported DPU of 11.58 Singapore cents, 6.4% higher year-on-year.
Based on its unit price of S$2.33 as of 11 June 2026, CICT offers a forward dividend yield of 5.2%.
CICT may appeal to investors who want exposure to Singapore retail and office assets, especially after the recovery in shopper traffic and office leasing demand.
However, I would watch whether positive rent reversions can continue, and whether the Paragon acquisition can support DPU without placing too much pressure on funding costs.
Find out how much dividends you would have received as a unitholder of CapitaLand Integrated Commercial Trust in the past 12 months with the calculator below.
Related links:
- CapitaLand Integrated Commercial Trust latest valuation, share price and analysis
- CapitaLand Integrated Commercial Trust dividend history and forecast
- CapitaLand Integrated Commercial Trust buys Paragon and sells Asia Square Tower 2
What would Beansprout do?
I would not look at these blue-chip REITs based on dividend yield alone.
A dividend yield of above 5% can be attractive for income investors, but the more important question is whether the REIT is able to drive growth in distributions, and has a comfortable balance sheet.
For Mapletree Pan Asia Commercial Trust, the dividend is supported by its stronger Singapore assets, especially VivoCity and Mapletree Business City, as well as a lower cost of debt after recent divestments.
That said, I would want to see clearer signs of stabilisation in its overseas assets, especially in Hong Kong, China and Japan, before expecting stronger DPU growth. Learn more about Mapletree Pan Asia Commercial Trust here.
For Frasers Logistics & Commercial Trust, the dividend looks better supported by its logistics and industrial portfolio, which remains well occupied and continues to deliver positive rental reversions.
The key signpost for me is whether commercial occupancy improves and whether future DPU growth comes mainly from recurring rental income rather than capital distributions. Learn more about Frasers Logistics & Commercial Trust here.
For CICT, the dividend is backed by resilient Singapore retail and office assets, positive rent reversions and active portfolio recycling.
I would keep expectations realistic, as its lower yield relative to the other two REITs reflects the market’s willingness to pay a premium for its portfolio quality and stability. Learn more about CapitaLand Integrated Commercial Trust here.
Overall, for the dividends of these blue-chip REITs to be supported, I would look out for next is whether they can continue growing rental income, maintain healthy occupancy levels and manage financing costs to support future DPU growth.
Also, we will be watchful of further increases in the Singapore bond yields, as they may continue to put pressure on the share prices of Singapore REITs. You can track the latest 10-year Singapore government bond yields here.
For my Income Pot within Beansprout's four pots of wealth, the key is not just to chase the highest yield. It is to build an income portfolio that can hold up across different market conditions.
With this in mind, I will be looking beyond Singapore REITs to blue chip stocks for income. Learn more about the income pot here.
If you’d like to screen for Singapore blue chip stocks, you can explore our best Singapore REITs screener.
Which Singapore blue chip REIT are you looking at with the recent share price pullback? Leave a comment below or share with us in the Beansprout telegram group.
Planning to invest in Singapore REITs? Compare the best Singapore brokers to find the right trading platform, and see the latest promotions and sign-up rewards available.
Follow Beansprout on Youtube, Facebook and Instagram, and add Beansprout as your preferred source on Google so you never miss an update.
Read also
Gain financial insights in minutes
Subscribe to our free weekly newsletter for more insights to grow your wealth
Most Popular

Comments
0 comments