Singapore REITs offer 5.9% dividend yield. Where investors may find income opportunities
REITs
By Gerald Wong, CFA • 07 Jun 2026
Global Wealth Technology Pte. Ltd. is regulated by the Monetary Authority of Singapore (MAS) as a licensed Financial Adviser.
'%3e%3cpath%20fill-rule='evenodd'%20clip-rule='evenodd'%20d='M17.64%209.20455C17.64%208.56637%2017.5827%207.95273%2017.4764%207.36364H9V10.845H13.8436C13.635%2011.97%2013.0009%2012.9232%2012.0477%2013.5614V15.8195H14.9564C16.6582%2014.2527%2017.64%2011.9455%2017.64%209.20455V9.20455Z'%20fill='%234285F4'/%3e%3cpath%20fill-rule='evenodd'%20clip-rule='evenodd'%20d='M9%2018C11.43%2018%2013.4673%2017.1941%2014.9564%2015.8195L12.0477%2013.5614C11.2418%2014.1014%2010.2109%2014.4205%209%2014.4205C6.65591%2014.4205%204.67182%2012.8373%203.96409%2010.71H0.957275V13.0418C2.43818%2015.9832%205.48182%2018%209%2018V18Z'%20fill='%2334A853'/%3e%3cpath%20fill-rule='evenodd'%20clip-rule='evenodd'%20d='M3.96409%2010.71C3.78409%2010.17%203.68182%209.59318%203.68182%209C3.68182%208.40682%203.78409%207.83%203.96409%207.29V4.95818H0.957273C0.347727%206.17318%200%207.54773%200%209C0%2010.4523%200.347727%2011.8268%200.957273%2013.0418L3.96409%2010.71V10.71Z'%20fill='%23FBBC05'/%3e%3cpath%20fill-rule='evenodd'%20clip-rule='evenodd'%20d='M9%203.57955C10.3214%203.57955%2011.5077%204.03364%2012.4405%204.92545L15.0218%202.34409C13.4632%200.891818%2011.4259%200%209%200C5.48182%200%202.43818%202.01682%200.957275%204.95818L3.96409%207.29C4.67182%205.16273%206.65591%203.57955%209%203.57955V3.57955Z'%20fill='%23EA4335'/%3e%3c/g%3e%3cdefs%3e%3cclipPath%20id='clip0_0_2849'%3e%3crect%20width='18'%20height='18'%20fill='white'/%3e%3c/clipPath%3e%3c/defs%3e%3c/svg%3e)
Make Beansprout your preferred source on Google
Add us on Google to see more of our insights in your search results
Singapore REITs now offer a 5.9% dividend yield after lagging the market. Here’s what has changed and where income investors may find opportunities.

What happened?
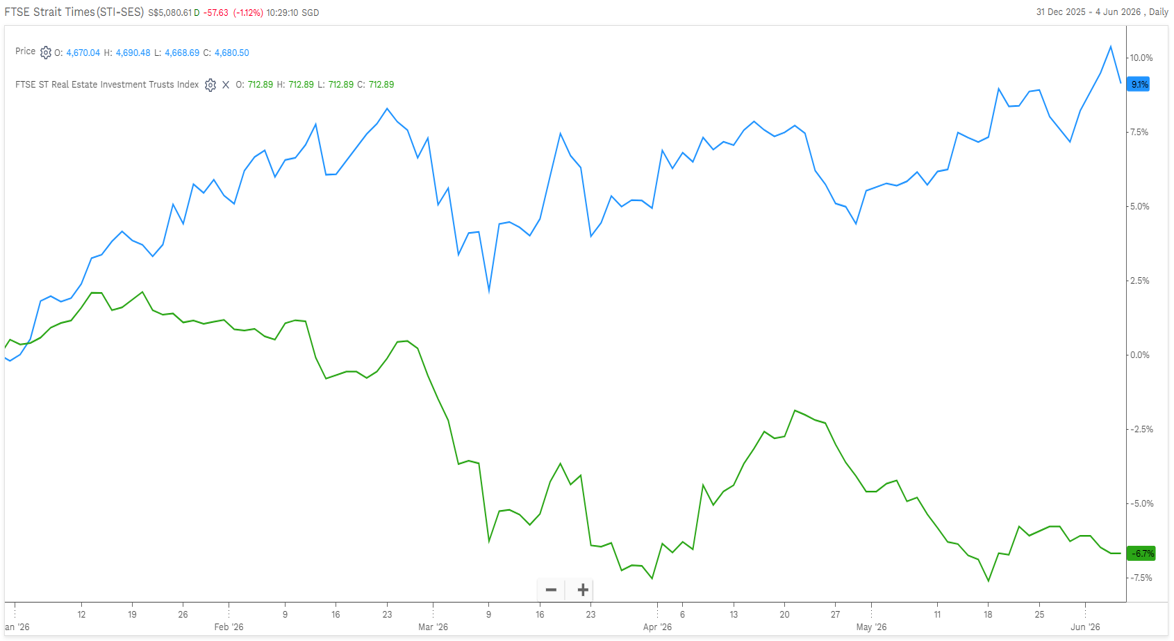
Singapore REITs have seen weakness so far this year.
As of 3 June 2026, the FTSE ST All-Share REIT Index had fallen 6.7% year-to-date, while the FTSE Straits Times Index had risen 9.1%.
The underperformance comes amid rising bond yields, higher oil prices and renewed concerns that interest rates may stay elevated for longer.
I also saw a question in the Beansprout Telegram group asking whether Singapore REITs are worth looking at after the recent decline.
After all, the correction in the share price of Singapore REITs has also led to more attractive valuations, with some blue-chip REITs offering dividend yields around 6%.
In this article, I look at why S-REITs have underperformed, what the latest 1Q 2026 updates show, and which segments and selected REITs may still offer resilient income opportunities.
Why are S-REITs underperforming year-to-date?
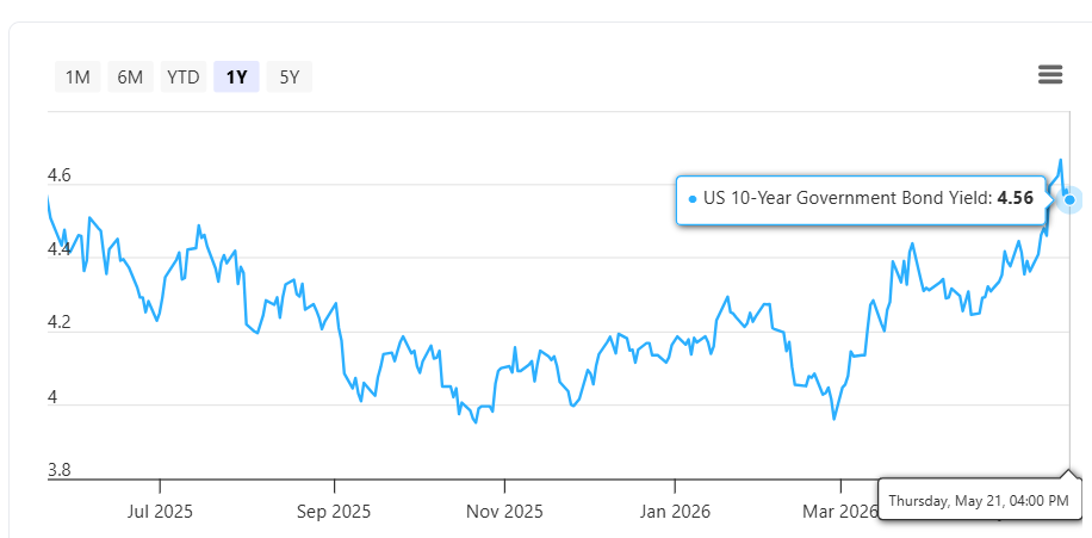
#1 - Rising U.S. 10-year Treasury bond yield reflects higher inflation expectations
One key reason for the weakness in S-REITs is the rise in US bond yields.
While the US Federal Reserve kept Fed Funds Rate unchanged at 3.5 to 3.75% at the April FOMC meeting, the minutes showed growing discussion on whether rates might need to stay higher for longer or even go up if inflation remains sticky.
U.S. inflation continues to climb. April headline inflation rose 3.8% year-on-year, up from 3.3% in March, due to higher energy prices and food prices.
Core CPI, which excludes food and energy, rose 0.4% in April and 2.8% year-on-year, suggesting underlying inflation pressures remain persistent despite some easing in categories like medical care and new vehicles.
The dot plot, which shows the projections of Fed officials, indicates that most officials expect rates in 2026 to be between 3.75% and 4.00%, implying potentially one rate hike in 4Q26.
The hawkish stance pushed the US 10-year treasury yield to near 4.7%. Year-to-date till 28 May 2026, the US 10-year treasury yield has risen 35 basis points to 4.50%.
As benchmark yields increases, the spread over the risk-free rates narrowed. To maintain a constant spread over risk-free interest rates, S-REIT yields have to rise, pushing prices of S-REITs lower.
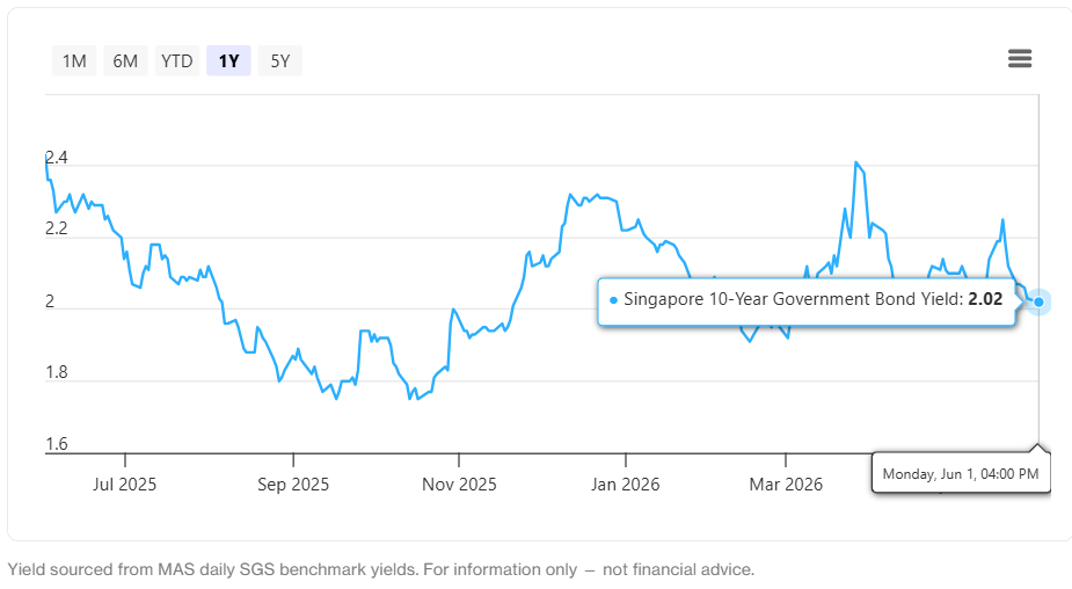
In Singapore, the 10-year government bond yield has settled around 2.1%, reflecting a relatively strong SGD versus the regional currencies.
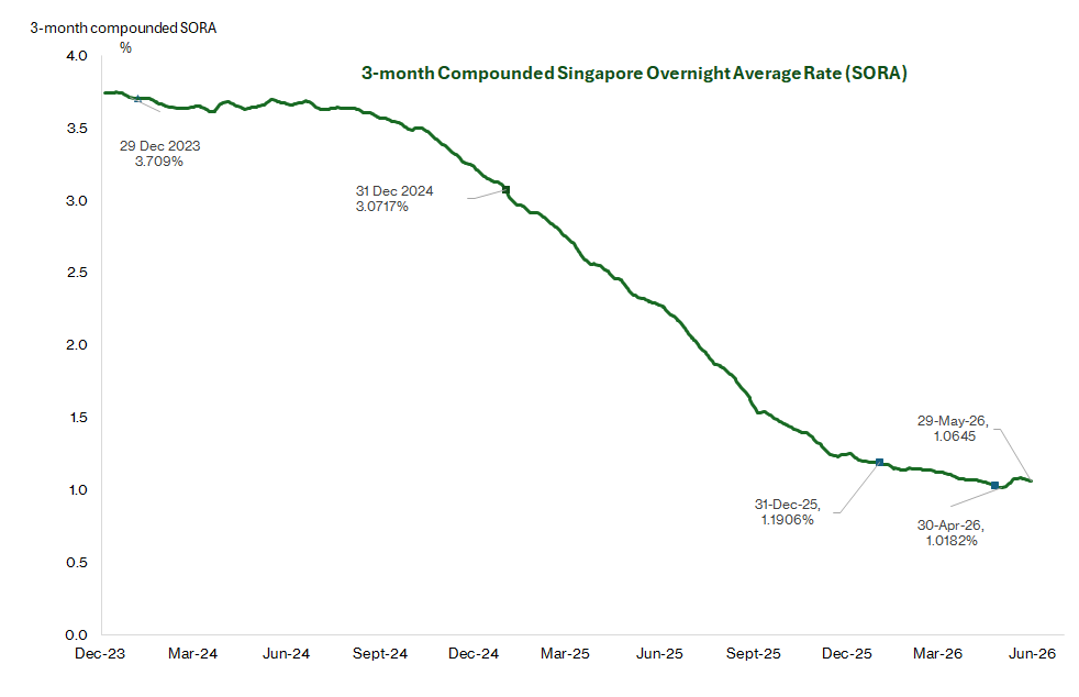
#2 - Funding cost may rise again
In 2025, S-REITs benefited from the steep decline in 3-month SORA, the benchmark interest rate which S-REITs financed their debt.
Looking ahead, the outlook may become less favourable if interest rates move higher again.
As of 29 May 2026, 3-month SORA remains stable, at around the 1.0% level.
Does the underperformance in S-REITs offers an attractive entry point?
With uncertainty around interest rates, the near-term outlook for S-REITs may be more challenging, and a broad recovery across the sector is less likely.
Investors may need to be more selective.
In this environment, REITs with stronger assets and more stable demand may hold up better. This includes those focused on Singapore office, logistics, data centres and purpose-built accommodation.
Investors may also want to look for REITs that can maintain or grow their distributions through actions such as improving existing properties, making acquisitions or achieving higher rents. Some REITs are actively managing the reconstructing the portfolio profile to build higher quality income stream.
We look at the latest updates from the 1Q 2026 business updates to assess the REITs’ operational consistency, income quality and balance sheet strength.
Data centre S-REITs post solid results on AI demand
Data centre segment continues to benefit from structural tailwinds in AI-driven demand.
Data centre S-REITs reported positive reversions in 1Q26, reflecting the structural undersupply across their key markets.
Digital Core REIT led with +44% cash rental reversion, driven by high-demand US markets like Northern Virginia and Silicon Valley where rents have re-rated sharply.
Keppel DC REIT reported a strong ~51% portfolio reversion. NTT DC REIT delivered +8.5% for the full financial year FY25/26.
Keppel DC REIT delivered the strongest year-on-year growth, with distributable income rising 20.7% year-on-year to S$74.6 million. Distributable income per unit (DPU) was up 13.2% to 2.833 cents. Keppel DC REIT reported lower cost-of-debt at 2.6% as at 1Q26, an improvement from 2.8% as at 4Q25. This was due to cheaper JPY and SGD acquisition loans drawn in 4Q25 to fund the Tokyo deal. Interest coverage ratio (ICR) has eased slightly to 7.2x as at 1Q26, as new borrowings kicked in.
Digital Core REIT reported a broadly flat distributable income of US$11.7 million versus a year ago. Digital Core REIT repurchased 7.1 million units in 1Q26 and delivered 0.3% DPU accretion. Aggregate leverage increased to 39.0% as at 31 March 2026, from 37.1% as at 31 December 2025. Average cost of debt at 3.5% is unchanged from the previous quarter. ICR of 3.3x in 1Q26 compared with 3.5x in 4Q25. However, ICR will likely improve when Linton Hall lease starts in December 2026.
NTT DC REIT, reporting its first full-year results, with distributable income of US$57.5 million, up 2.5% year-on-year. FY25/26 DPU of 5.56 US cents was 2.6% above the initial public offering forecast. To recap, NTT DC REIT was listed on the Main Board of the Singapore Exchange on 14 July 2025. DPU of 5.56 US cents represented distribution for the period 14 July 2025 to 31 March 2026. Based on the closing price of US$0.97 (28 May 2026), NTT DC REIT offers an annualised dividend yield of 7.7%.
Industrial REITs’ Singapore assets delivered steady results
Industrial REITs maintained their resilience, particularly their Singapore industrial assets.
Singapore remains the most consistent source of positive rental growth, while overseas markets continue to diverge, particularly the softer US leasing environment for Mapletree Industrial REIT (MINT) and ongoing rental pressure in China for Mapletree Logistics Trust (MLT).
CapitaLand Ascendas REIT (CLAR) posted rental reversion at 10.6% for 1Q26, led by the US portfolio which reported rental reversions of 15.1%, while Singapore also stayed resilient at 10.5%. While CLAR does not report quarterly distributable income, the cost of debt was 3.5% as at 1Q26, unchanged from 4Q25.
Mapletree Industrial REIT reported positive rental reversion of 6.2% for its Singapore portfolio in 4QFY25/26. In North America, MINT achieved weighted average reversion of c.3.0%. Cost of debt was 3.2% in 4QFY25/26, up from 3.1% in 3Q FY25/26. Management flagged that around S$600 million of interest rate hedges expiring in FY26/27 will be replaced at higher prevailing rates, exerting pressures on distribution.
Mapletree Logistics Trust recorded rental reversion of 3.3% in 4QFY25/26, or +4.2% if excluding China. Singapore and Japan remained the strongest contributors at 5.8% and 6.2% respectively. China continued to lag with negative reversions of 2.0%. MLT’s cost of debt at 2.6% in 4QFY25/26, also stable quarter-on-quarter.
Both MINT and MLT reported lower Distribution per unit (DPU).
MINT reported 4Q FY25/26 DPU of 3.09 cents, down 8.0% year-on-year. On a like-for-like basis, excluding divestments, DPU declined 4.9% year-on-year. MLT's 4Q FY25/26 DPU of 1.819 cents was down 7.0% year-on-year. However, stripping out divestment gains, DPU from operations grew just 0.9% year-on-year.
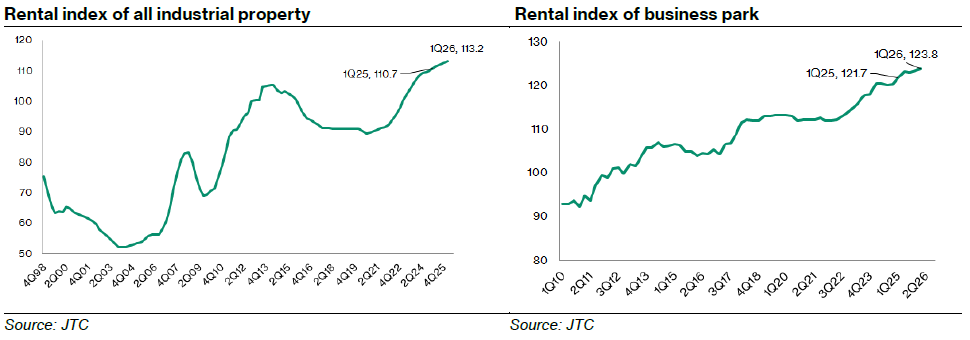
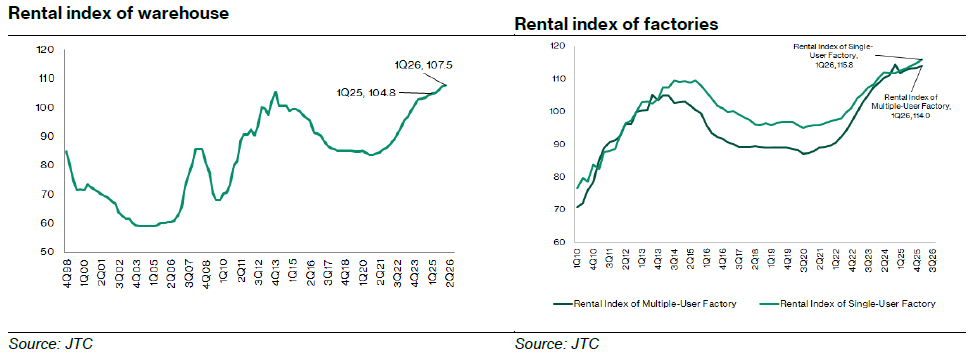
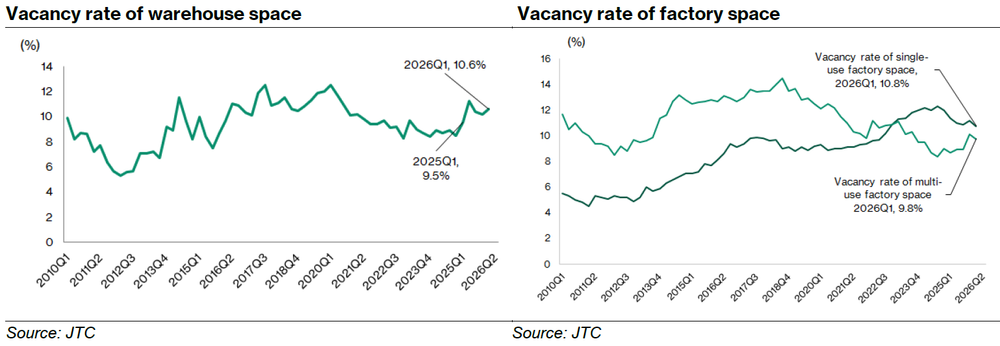
Industrial REITs have delivered resilient operating data in 1Q26.
The JTC All Industrial Rental Index rose 0.4% quarter-on-quarter, matching the pace in 4Q2025 and extending the upcycle to a 22st consecutive quarter of increases.
Retail REITs’ Singapore assets delivered steady results
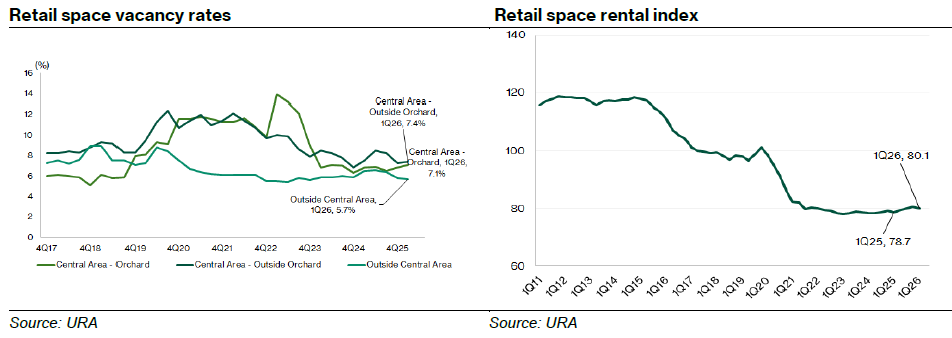
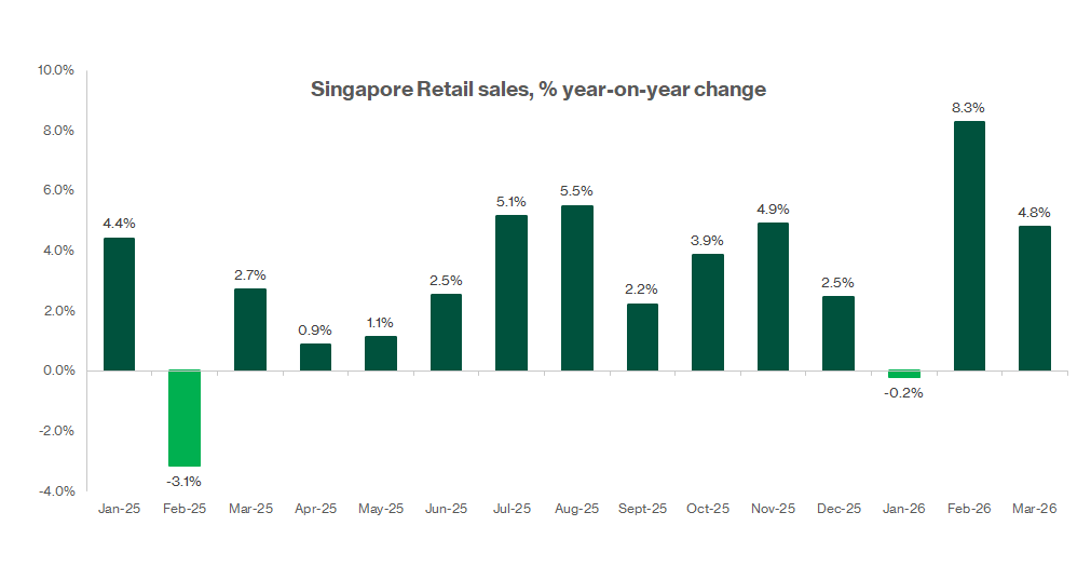
Singapore retail REITs delivered a resilient set of 1Q26 results, supported by healthy shopper traffic, sustained tenant sales, positive rental reversions and limited incoming retail supply.
Prime suburban malls and Orchard Road assets demonstrate resilience, supported by tourism recovery, experiential retail demand and constrained supply
CapitaLand Integrated Commercial Trust (CICT) announced Net Property income (NPI) of S$314.4 million in 1Q 2026, increased by 7.9% year-on-year.
The higher NPI was driven by consolidation of CapitaSpring and progressive contribution from Gallileo. In 1Q26, CICT recorded retail rental reversion of 4.4%, with suburban malls outperforming downtown malls at 5.1% versus 3.9%. Portfolio weighted average lease expiry (WALE) was 3.0 years, with office leases providing longer income visibility than retail leases at 3.1 years versus 1.9 years. CICT’s retail portfolio occupancy stood at 97.8% as at March 2026, continuing to outperform Singapore’s islandwide retail occupancy rate. Downtown occupancy eased slightly but remained healthy, while suburban malls continued to operate near full occupancy.
Frasers Centrepoint Trust’s (FCT)’s net property income grew 20.2% year-on-year to S$160.8 million, attributed to full year contribution of Northpoint City South Wing.
FCT declared distributions to unitholders of S$125.0 million for 1H FY26, up 13.6% year-on-year. DPU was 6.136 cents, a 1.4% increase over 1H FY25's 6.054 cents. Retail portfolio recorded a reversion of +6.5% for the six-month period between 1 Oct 2025 to 31 March 2026 (1H FY26), driven by strong demand in Food & Beverage, Beauty & Healthcare, and Fashion & Accessories. Tenant retention was healthy at 87%.
Lendlease REIT reported an even stronger retail rental reversion of +12.2% as at March 2026 (3Q FY26).
This reflects the more central and prime positioning of its assets — Jem at Jurong Gateway, 313@somerset on Orchard Road, and PLQ Mall in Paya Lebar — where replacement rents are commanding a larger premium over expiring rents. Tenant retention for 3Q FY26 stood at 62.5% by Net Leasable Area (NLA). Portfolio WALE was 3.7 years by gross rental income (GRI), buoyed by the Milan office assets with a WALE of 6.8 years. Portfolio occupancy improved to 95.3% as at March 2026 from 94.9% in the prior quarter. The retail sub-portfolio was near-full at 99.7%, while the Milan office portfolio held at 89.1%, unchanged from prior quarter.
Starhill Global REIT reported 3QFY25/26 NPI of S$37.9 million, flat year-on-year, despite higher operating expenses and divestment-related impact. Excluding divestments, NPI would have increased 1.2% year-on-year. Starhill Global REIT maintained a significantly longer portfolio WALE of 7.3 years, supported by long-dated master and anchor leases at Ngee Ann City and The Starhill. Portfolio occupancy improved to 96.4%, partly due to new lease commencement in its China property.
Office REITs’ Singapore assets delivered steady results
Office properties within Singapore also held up well, with Grade A CBD properties continuing to see healthy leasing demand and modest increase in passing rents.
Core CBD Grade A rents rose to S$12.40 psf per month in 1Q 2026, up 0.8% quarter-on-quarter, with occupancy tightening to 96.7%.
Keppel REIT's net property income (NPI) grew 9.7% year-on-year to S$59.9 million, with share of results from joint ventures rising 37.6% to S$41.7 million, driven by the incremental MBFC Tower 3 stake and lower borrowing costs. Distributable income including the S$5.0 million anniversary distribution reached S$62.9 million, up 17.8% year-on-year, with an estimated DPU of 1.27 cents for 1Q26. Rental reversion for the quarter came in at +17.2% across the Singapore office portfolio — with average signing rents for leases concluded in 1Q 2026 at S$13.26 psf per month.
OUE REIT's office segment, which accounts for 49% of revenue, posted NPI of S$33.3 million, up 3.0% year-on-year. OUE REIT's Singapore office portfolio reported average passing rent of S$11.00 psf per month, edging up 0.2% quarter-on-quarter. Rental reversion was +6.0% in 1Q 2026. A notable tailwind was the 17.8% year-on-year decline in financing costs to S$17.2 million, reflecting active debt management in a lower interest rate environment.
Suntec REIT announced revenue rose 1.9% year-on-year to S$115.6 million and NPI grew 0.3% to S$77.3 million in 1Q26. The modest NPI growth reflecting higher operating expenses partially offsetting revenue gains. JV income rose 9.0% to S$27.8 million, driven by stronger performance from MBFC Properties and One Raffles Quay. Distributable income increased 24.8% year-on-year to S$57.3 million. DPU increased by 23.9% to 1.936 cents, due to favourable base effect. In addition, Suntec REIT’s financing costs fell by S$5.8 million year-on-year.
Hospitality and accommodation REITs
The two listed hospitality REITs delivered broadly resilient operating results in 1Q 2026, with both CapitaLand Ascott Trust (CLAS) and CDL Hospitality Trust (CDLHT) reporting portfolio-level income growth despite navigating the macro uncertainty and geopolitical unrest.
CapitaLand Ascott Trust (CLAS) provided 1Q 2026 business updates. 1Q26 distribution income remained relatively stable year-on-year, despite headwinds from the TCL closure and Madison Hamburg works. This was supported by the top-up from past divestment gains and interest savings from lower rates. Portfolio Revenue per available unit (RevPAU) increased 1% year-on-year to S$137, on a same-store basis. RevPAU was broadly positive — Australia +7% (AUD 188), Singapore +2% (SGD 187), UK +1% (GBP 127 ex-TCL), Japan +3% (JPY basis, ex-acquisitions/divestments), and USA +7% ex-renovation. Average cost of debt improved to 2.8% as at 31 March 2026, from 2.9% as at 31 December 2025.
CDL Hospitality REIT (CDLHT) reported 1Q 2026 Net property income (NPI) of S$33.1 million, up 10.4% year-on-year. CDLHT's Singapore hotels reported 80.4% occupancy, up from 75.0% in 1Q 2025 — a gain of 5.4 percentage points year-on-year — driven by the events calendar and MICE demand. Average Daily Rate (ADR) for Singapore hotels was S$229, marginally softer than S$231 a year ago (-0.6%). Singapore revenue per available room (RevPAR) grew 6.6% year-on-year. The Castings, CDLHT's UK co-living asset, continued its occupancy ramp, reaching 91.8% physical occupancy as at March 2026, up from 59.1% at December 2024, with NPI more than doubling year-on-year. A stabilised NPI profile is expected from 2026 onwards.
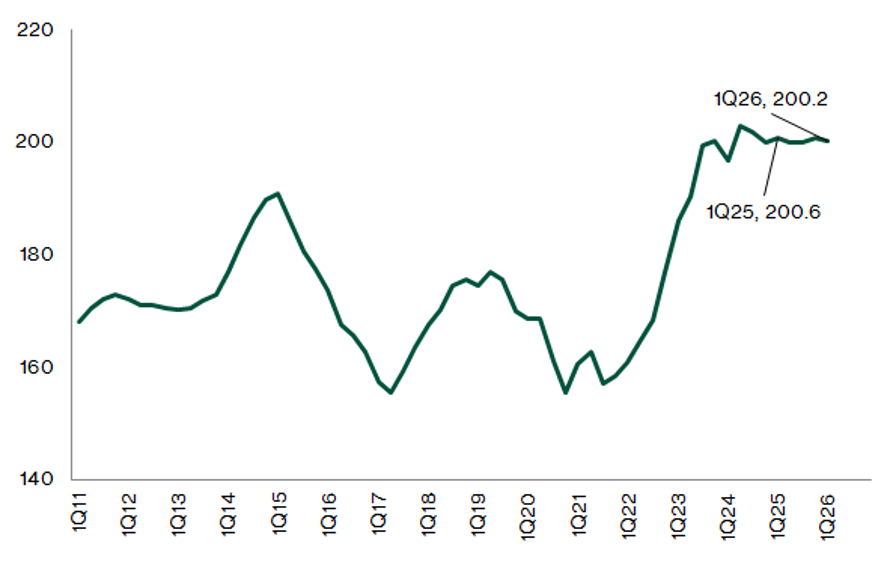
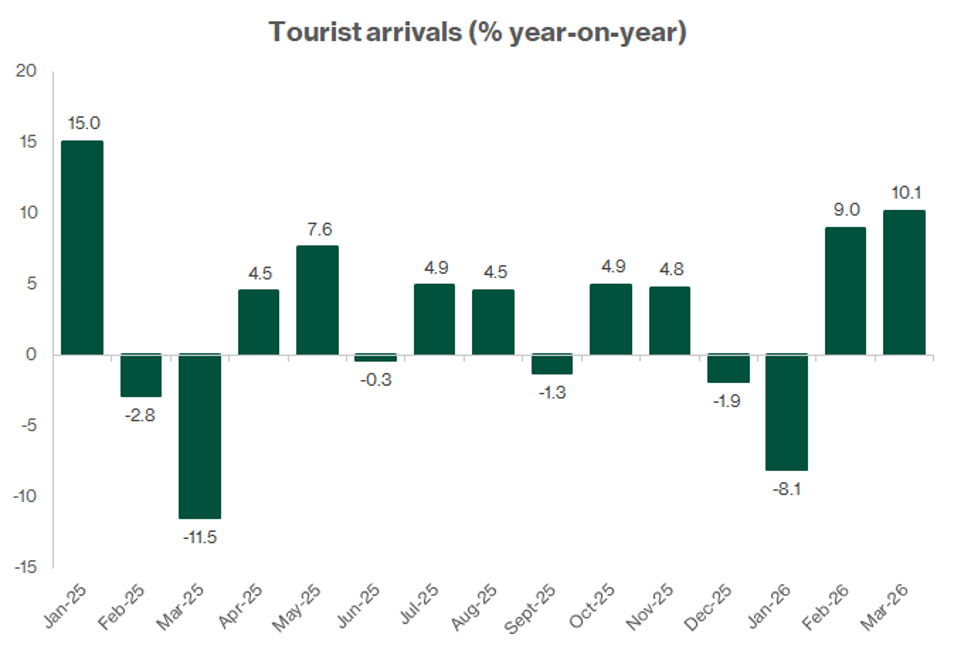
1Q26 tourist arrivals reached 4.43 million, up 2.8% year-over-year. The quarter was helped by a biennial event - the Singapore Airshow returned in February. Singapore Tourism Board estimates international visitor arrivals to grow around 3.3% in 2026.
Centurion Accommodation (CAREIT) delivered a solid start to FY2026, exceeding its IPO Prospectus Forecasts in its first quarterly result since listing in September 2025. 1Q26 revenue of S$52.5m and NPI of S$37.5m exceeded Prospectus Forecasts by 2.7% and 2.4% respectively. Both Purpose-Built Workers Accommodation (PBWA) and Purpose-Built Student Accommodation (PBSA) outperformed. PBWA portfolio in Singapore recorded occupancy of 94.0%, 0.9 percentage points ahead of the Prospectus Forecast of 93.1%. PBSA’s occupancy reached 98.6%, beating the forecast of 97.2% by 1.4 percentage points. Aggregate leverage rose to 31.0% as at 31 March 2026, up from 22.1% at end-December 2025. The increase was driven by debt drawn to finance the acquisition of EPIISOD Macquarie Park. Average financing cost stood at 3.57% as at 31 March 2026, below the Prospectus Forecast of 4.11%.
Overseas-focused S-REITs delivered underlying improvement
Currency volatility and divergent market conditions led to a wide dispersion in performance among S-REITs with overseas assets.
Despite these headwinds, underlying operating fundamentals remained resilient, with many REITs continuing to deliver positive rental reversions, stable occupancies, and disciplined capital management.
This suggests that management teams have largely executed well, maintaining asset performance and operational efficiency across different markets.
CapitaLand China Trust (CLCT) reported 1Q26 net property income (NPI) down 3.5% year-on-year. On a positive note, same-store NPI excluding Yuhuating grew 1.3% year-on-year, supported by a 3.7% year-on-year reduction in operating costs. This reflects improving operating leverage and management's ability to drive efficiency. Retail portfolio, the largest contributor to CLCT’s gross rental income, reported headline retail rental reversion of -2.1% in 1Q FY26. However, excluding two planned anchor adjustments, retail reversion would have been -1.6%, suggesting the broader retail portfolio is near rental stabilisation. Average cost of debt fell to 3.10% in 1Q FY26 from 3.32% at end-2025 and 3.51% in 1Q25 — a 40 basis point decline year-on-year. This was achieved by raising the proportion of lower-cost RMB-denominated debt.
CapitaLand India Trust (CLINT) reported 1Q26 net property income (NPI) grew 8% year-on-year in 1Q FY26, to INR3,775 million . In Singapore dollar terms, NPI was S$53.4 million, down 3% year-on-year. The SGD declines was attributable to INR depreciation against SGD. CLINT achieved a trailing 12-month rental reversion of +17%, led by assets in Hyderabad and Bangalore. Average cost of debt rose slightly to 5.7% from 5.6% at end-2025, due to a higher INR debt ratio as lower-cost SGD loans were repaid and replaced with onshore INR borrowings. CapitaLand India Trust implemented onshore borrowing in order to leverage on the tax efficiency. Interest coverage ratio (ICR) improved to 2.8x (end-2025: 2.7x), and 78.5% of borrowings are on fixed rate (up from 72.6%), providing strong protection against interest rate increases.
Stoneweg Europe Stapled Trust reported 1Q26 indicative distribution per stapled security (DPS) grew by 1.5% year-on-year to 3.423 Euro cents. Net property margin was 62.5% in 1Q 2026, unchanged from 1Q 2025. The operation remains resilient amid the current US-Iran conflict-driven energy price hikes. As the leases are on triple-net basis, the tenants bear the utility costs. As at 31 March 2026, data centre sector accounts for around 7.1% of portfolio value. It has secured early-stage exposure through investing in AiOnX. Upon completion, AiOnX will be one of the largest data centre owners in Europe. This asset will drive the future capital appreciation and income generation.
Elite UK REIT posted 1Q26 distributable income grew 9.8% year-on-year to £5.3 million, supported by FY2025 acquisitions, interest savings from capital management, and lower vacancy costs. Adjusted NPI (normalised for one-off items received in 1Q 2025) grew 4.0% year-on-year. Elite UK REIT continued its deleveraging trajectory, with net gearing falling to 37.4%, from 40.7% as at end-December 2025. Elite UK REIT maintained 92% of its debt at fixed rates, up from 85% at 31 December 2025, anchoring borrowing costs at 4.7%. Cost of debt is expected to remain broadly stable in the near term, supported by the hedging profile.
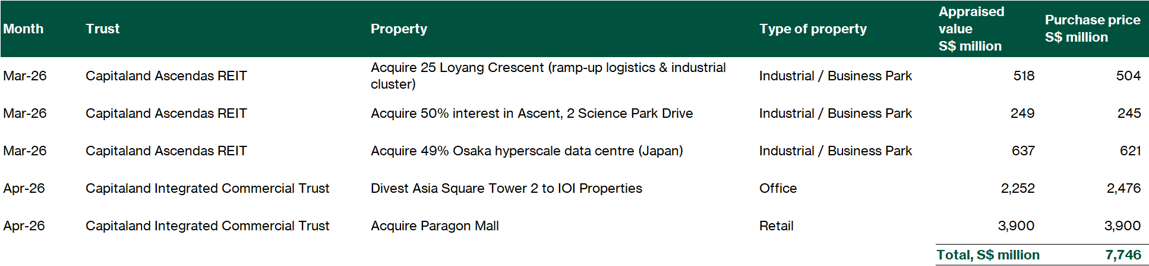
REITs acquisition and divestment activities in 1Q26
Despite the macro uncertainty and rising interest rates, the asset transactions remain fairly active.
These moves underscore a continued emphasis on capital recycling, with managers increasingly willing to exit non-core or mature assets and redeploy proceeds into higher-conviction segments.
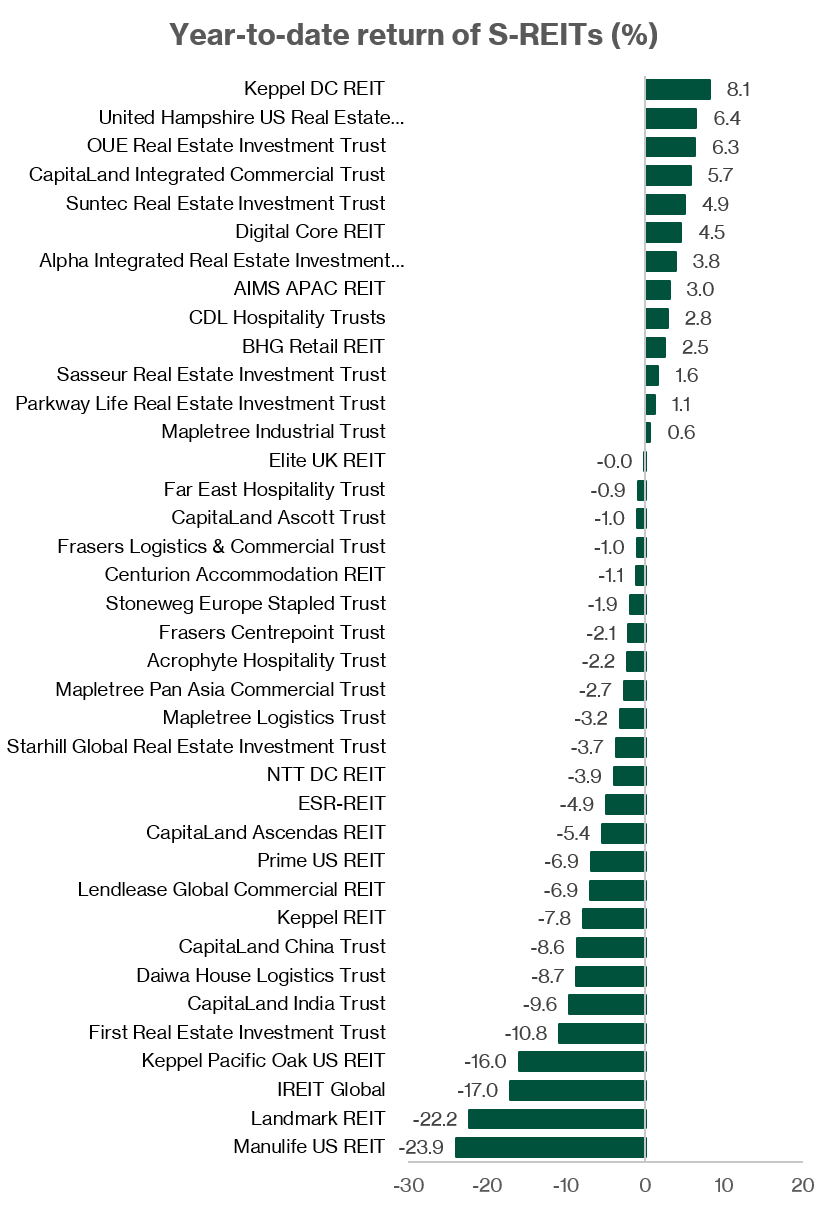
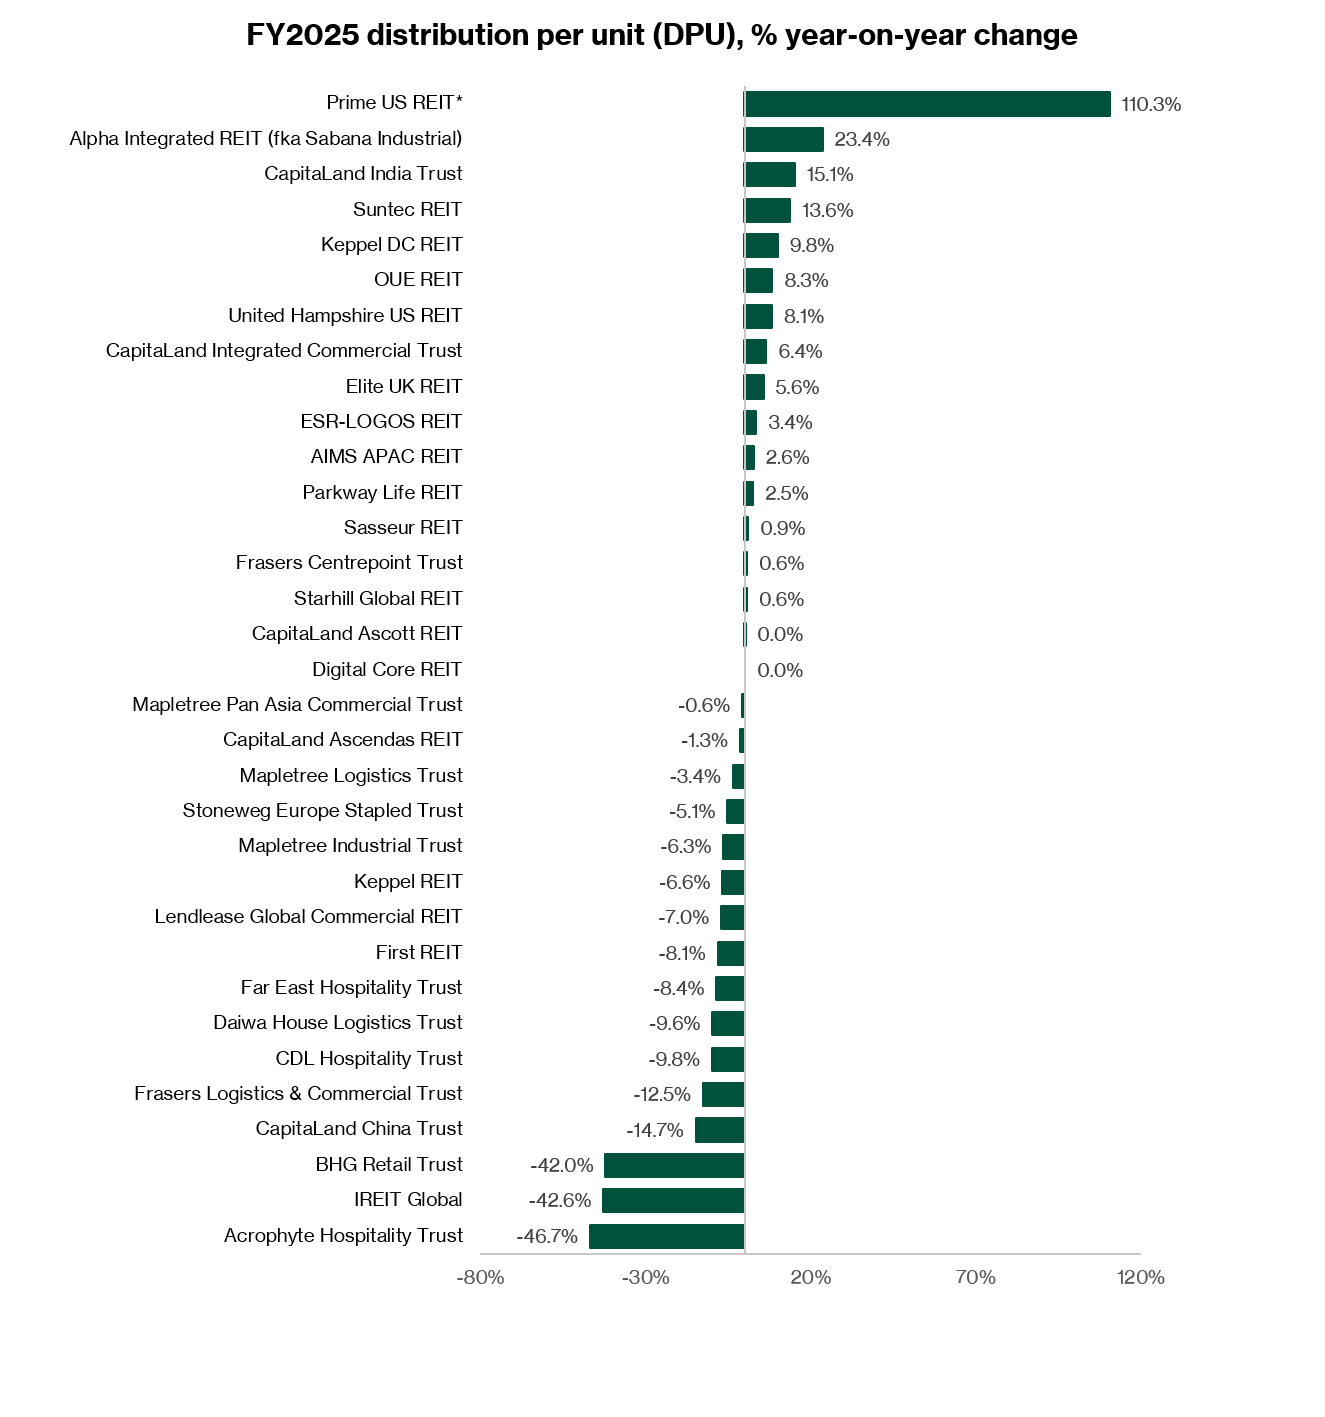
Singapore REITs show divergence in their ability to grow dividends
Based on FY2025 DPU year-on-year % change, data centre and prime office REITs showed DPU growth. Otherwise, majority of Singapore REITs continued to see a decline in their distribution per unit.
We saw decline in DPU of REITs with significant overseas assets and were impacted by currency weakness relative to the Singapore dollar, as well as those with higher borrowing costs.
On the other hand, REITs in the industrial and retail sub-sectors, particularly those with a sizeable portion of their assets in Singapore, had relatively resilient distributions compared to other REITs.
For 1Q26, data centre REITs and prime office REITs continued to record DPU growth, reflecting the strong underlying demand.
On the other hand, REITs with overseas assets are navigating challenging macro environment and sector dynamics.
Overall, the SREITs have executed prudent and active capital management, enhancing their balance sheet resilience through the volatile interest rate cycles.
What would Beansprout do?
The recent uncertainty in Singapore government bond and T-bill yields has started to weigh on S-REITs.
When safer investments like T-bills offer higher returns, REITs become less attractive in comparison, which has led to a pullback in their prices.
In this environment, REITs with stronger underlying assets may hold up better. These include those focused on Singapore office, logistics, data centres and purpose-built accommodation, where demand has been relatively more stable. REITs with overseas assets that actively manage currency risks may also be better positioned.
At the same time, many REITs have taken steps in recent years to manage their debt, such as locking in borrowing costs at attractive level and over a longer tenor. This provides support from higher interest rates if they persist.
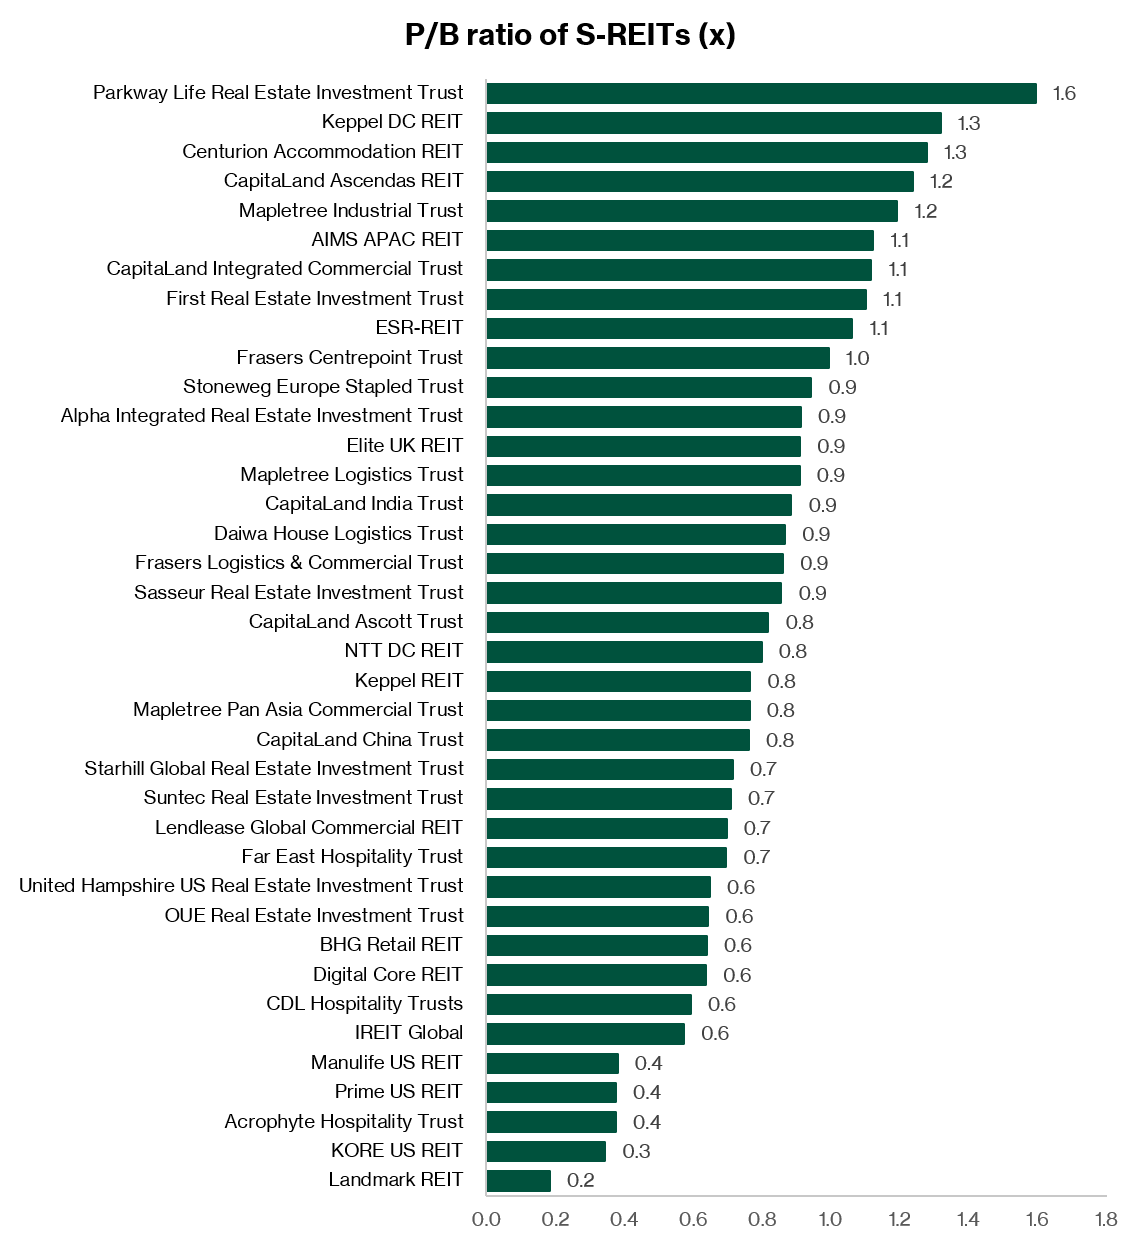
Valuations have also become more reasonable. The CSOP IEdge S-REIT Leaders ETF is trading at P/B 0.99x, higher the historical average of 0.94x.
Forward distribution yield has risen to 5.9%, in line with historical average of 5.9%.
In the current environment, investors may want to focus on REITs that can sustain and grow distributions through active portfolio management, such as asset enhancements, acquisitions and rental growth.
Performance is likely to diverge based on sub-sector exposure, geographic mix, debt structure and execution capability.
Among mid-cap names, CapitaLand India Trust, Digital Core REIT and Stoneweg Europe Stapled Trust offer growth opportunities, while AIMS APAC REIT and Parkway Life REIT have shown resilient distribution.
Singapore REITs can still play a useful role in an income portfolio, especially for investors seeking steady distributions, property exposure or potential upside if interest rates fall, but they also come with risks such as refinancing costs, changes in asset values and potential dilution from capital raising.
Rather than relying too heavily on REITs alone, I would build a broader mix of income sources, including quality Singapore blue-chip stocks with sustainable dividends, resilient earnings and strong balance sheets. Learn more about Why I’m looking beyond Singapore REITs to blue chip stocks for income here.
For my Income Pot, the key is not just to chase the highest yield. It is to build an income portfolio that can hold up across different market conditions. Learn more about how to build passive income streams with our income pot here.
By combining quality dividend stocks with selected REITs, investors may be better placed to grow dividends over time, while improving the resilience of their portfolio.
You can find out some of our investment ideas to capture opportunities in the market here.
To screen for Singapore REITs with lowest price-to-book valuation or highest dividend yield, check out our best Singapore REIT screener.
If you are new to investing in Singapore REITs, you can start to learn more about Singapore REITs here.
If you prefer diversification without picking individual REITs, you can also gain exposure through Singapore REIT ETFs.
Download the full report here.
Are you looking at S-REITs again after the recent pullback, or are you waiting for more clarity on interest rates? Share with us in the comments below or in our Telegram group!
Check out Beansprout guide to the best stock trading platforms in Singapore with the latest promotions to invest in the Singapore REITs Sector.
Enjoyed this insight? Follow Beansprout on Youtube, Facebook and Instagram, and add Beansprout as your preferred source on Google so you never miss an update.
Important Disclosures
Analyst Certification and Disclosures
The analyst(s) named in this report certifies that (i) all views expressed in this report accurately reflect the personal views of the analyst(s) with regard to any and all of the subject securities and companies mentioned in this report and (ii) no part of the compensation of the analyst(s) was, is, or will be, directly or indirectly, related to the specific views expressed by that analyst herein. The analyst(s) named in this report (or their associates) does not have a financial interest in the corporation(s) mentioned in this report.
An associate is defined as (i) the spouse, or any minor child (natural or adopted) or minor step-child, of the analyst; (ii) the trustee of a trust of which the analyst, his spouse, minor child (natural or adopted) or minor step-child, is a beneficiary or discretionary object; or (iii) another person accustomed or obliged to act in accordance with the directions or instructions of the analyst.
Company Disclosure
Global Wealth Technology Pte Ltd (“Beansprout”) does not have any financial interest in the corporation(s) mentioned in this report.
Disclaimer
This report is provided by Beansprout for the use of intended recipients only and may not be reproduced, in whole or in part, or delivered or transmitted to any other person without our prior written consent. By accepting this report, the recipient agrees to be bound by the terms and limitations set out herein.
You acknowledge that this document is provided for general information purposes only. Nothing in this document shall be construed as a recommendation to purchase, sell, or hold any security or other investment, or to pursue any investment style or strategy. Nothing in this document shall be construed as advice that purports to be tailored to your needs or the needs of any person or company receiving the advice. The information in this document is intended for general circulation only and does not constitute investment advice. Nothing in this document is published with regard to the specific investment objectives, financial situation and particular needs of any person who may receive the information.
Nothing in this document shall be construed as, or form part of, any offer for sale or subscription of or solicitation or invitation of any offer to buy or subscribe for any securities. The data and information made available in this document are of a general nature and do not purport, and shall not in any way be deemed, to constitute an offer or provision of any professional or expert advice, including without limitation any financial, investment, legal, accounting or tax advice, and shall not be relied upon by you in that regard. You should at all times consult a qualified expert or professional adviser to obtain advice and independent verification of the information and data contained herein before acting on it. Any financial or investment information in this document are intended to be for your general information only. You should not rely upon such information in making any particular investment or other decision which should only be made after consulting with a fully qualified financial adviser. Such information do not nor are they intended to constitute any form of financial or investment advice, opinion or recommendation about any investment product, or any inducement or invitation relating to any of the products listed or referred to. Any arrangement made between you and a third party named on or linked to from these pages is at your sole risk and responsibility.
You acknowledge that Beansprout is under no obligation to exercise editorial control over, and to review, edit or amend any data, information, materials or contents of any content in this document. You agree that all statements, offers, information, opinions, materials, content in this document should be used, accepted and relied upon only with care and discretion and at your own risk, and Beansprout shall not be responsible for any loss, damage or liability incurred by you arising from such use or reliance.
This document (including all information and materials contained in this document) is provided “as is”. Although the material in this document is based upon information that Beansprout considers reliable and endeavours to keep current, Beansprout does not assure that this material is accurate, current or complete and is not providing any warranties or representations regarding the material contained in this document. All opinions contained herein constitute the views of the analyst(s) named in this report, they are subject to change without notice and are not intended to provide the sole basis of any evaluation of the subject securities and companies mentioned in this report. Any reference to past performance should not be taken as an indication of future performance. To the fullest extent permissible pursuant to applicable law, Beansprout disclaims all warranties and/or representations of any kind with regard to this document, including but not limited to any implied warranties of merchantability, non-infringement of third-party rights, or fitness for a particular purpose.
Beansprout does not warrant, either expressly or impliedly, the accuracy or completeness of the information, text, graphics, links or other items contained in this document. Neither Beansprout nor any of its affiliates, directors, employees or other representatives will be liable for any damages, losses or liabilities of any kind arising out of or in connection with the use of this document. To the best of Beansprout’s knowledge, this document does not contain and is not based on any non-public, material information. The information in this document is not intended for distribution to, or use by, any person or entity in any jurisdiction where such distribution or use would be contrary to law or regulation, or which would subject Beansprout to any registration requirement within such jurisdiction or country. Beansprout is not licensed or regulated by any authority in any jurisdiction or country to provide the information in this document.
As a condition of your use of this document, you agree to indemnify, defend and hold harmless Beansprout and its affiliates, and their respective officers, directors, employees, members, managing members, managers, agents, representatives, successors and assigns from and against any and all actions, causes of action, claims, charges, cost, demands, expenses and damages (including attorneys’ fees and expenses), losses and liabilities or other expenses of any kind that arise directly or indirectly out of or from, arising out of or in connection with violation of these terms, use of this document, violation of the rights of any third party, acts, omissions or negligence of third parties, their directors, employees or agents. To the extent permitted by law, Beansprout shall not be liable to you, any other person, or organization, for any direct, indirect, special, punitive, exemplary, incidental or consequential damages, whether in contract, tort (including negligence), or otherwise, arising in any way from, or in connection with, the use of this document and/or its content. This includes, without limitation, liability for any act or omission in reliance on the information in this document. Beansprout expressly disclaims and excludes all warranties, conditions, representations and terms not expressly set out in this User Agreement, whether express, implied or statutory, with regard to this document and its content, including any implied warranties or representations about the accuracy or completeness of this document and the content, suitability and general availability, or whether it is free from error.
If these terms or any part of them is understood to be illegal, invalid or otherwise unenforceable under the laws of any state or country in which these terms are intended to be effective, then to the extent that they are illegal, invalid or unenforceable, they shall in that state or country be treated as severed and deleted from these terms and the remaining terms shall survive and remain fully intact and in effect and will continue to be binding and enforceable in that state or country.
These terms, as well as any claims arising from or related thereto, are governed by the laws of Singapore without reference to the principles of conflicts of laws thereof. You agree to submit to the personal and exclusive jurisdiction of the courts of Singapore with respect to all disputes arising out of or related to this Agreement. Beansprout and you each hereby irrevocably consent to the jurisdiction of such courts, and each Party hereby waives any claim or defence that such forum is not convenient or proper.
Read also
Gain financial insights in minutes
Subscribe to our free weekly newsletter for more insights to grow your wealth
Most Popular

Comments
0 comments