3 Singapore blue-chip REITs that held up in 1H 2026. Are they still worth looking at for income
REITs
By Gerald Wong, CFA • 08 Jul 2026
Why trust Beansprout? We’ve been awarded Best Investment Website at the SIAS Investors’ Choice Awards 2025
'%3e%3cpath%20fill-rule='evenodd'%20clip-rule='evenodd'%20d='M17.64%209.20455C17.64%208.56637%2017.5827%207.95273%2017.4764%207.36364H9V10.845H13.8436C13.635%2011.97%2013.0009%2012.9232%2012.0477%2013.5614V15.8195H14.9564C16.6582%2014.2527%2017.64%2011.9455%2017.64%209.20455V9.20455Z'%20fill='%234285F4'/%3e%3cpath%20fill-rule='evenodd'%20clip-rule='evenodd'%20d='M9%2018C11.43%2018%2013.4673%2017.1941%2014.9564%2015.8195L12.0477%2013.5614C11.2418%2014.1014%2010.2109%2014.4205%209%2014.4205C6.65591%2014.4205%204.67182%2012.8373%203.96409%2010.71H0.957275V13.0418C2.43818%2015.9832%205.48182%2018%209%2018V18Z'%20fill='%2334A853'/%3e%3cpath%20fill-rule='evenodd'%20clip-rule='evenodd'%20d='M3.96409%2010.71C3.78409%2010.17%203.68182%209.59318%203.68182%209C3.68182%208.40682%203.78409%207.83%203.96409%207.29V4.95818H0.957273C0.347727%206.17318%200%207.54773%200%209C0%2010.4523%200.347727%2011.8268%200.957273%2013.0418L3.96409%2010.71V10.71Z'%20fill='%23FBBC05'/%3e%3cpath%20fill-rule='evenodd'%20clip-rule='evenodd'%20d='M9%203.57955C10.3214%203.57955%2011.5077%204.03364%2012.4405%204.92545L15.0218%202.34409C13.4632%200.891818%2011.4259%200%209%200C5.48182%200%202.43818%202.01682%200.957275%204.95818L3.96409%207.29C4.67182%205.16273%206.65591%203.57955%209%203.57955V3.57955Z'%20fill='%23EA4335'/%3e%3c/g%3e%3cdefs%3e%3cclipPath%20id='clip0_0_2849'%3e%3crect%20width='18'%20height='18'%20fill='white'/%3e%3c/clipPath%3e%3c/defs%3e%3c/svg%3e)
Make Beansprout your preferred source on Google
Add us on Google to see more of our insights in your search results
We look at 3 Singapore blue-chip REITs that held up in the first half of 2026, and whether they remain worth considering for income investors.
What happened?
Singapore REITs have lagged behind the broader market in 2026.
While the Straits Times Index climbed to fresh highs, many Singapore REITs remained under pressure as inflation concerns led investors to expect interest rates to stay higher for longer
This stood in contrast to the broader Singapore market, where several blue-chip stocks gained more than 20% during the same period.
Following the decline in share prices, some REITs were previously near their 5-year lows with dividend yields around 6%.
Despite the general weakness in the sector, some blue chip REITs have been relatively resilient, although their DPU growth and distribution quality vary.
In this article, I look at the three Singapore blue-chip REITs that held up in the first half of 2026, and whether their DPU growth, balance sheet strength and distribution yields remain worth considering for income.
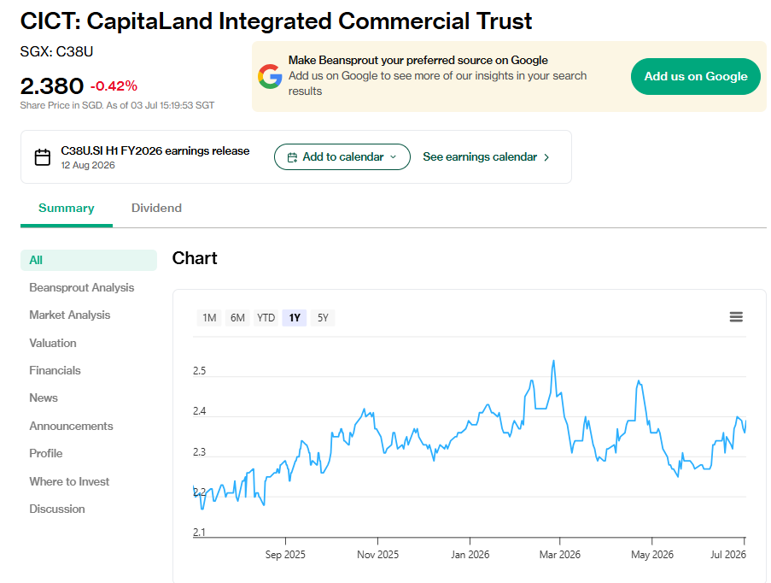
#1 - CapitaLand Integrated Commercial Trust (SGX: C38U)
CICT is Singapore's largest listed REIT, with a diversified portfolio of prime retail and office assets predominantly located in Singapore.
Its scale, high-quality assets and diversified income base provide resilient cash flows and stable distributions.
CICT's share price rose about 2.7% in 1H 2026 to around S$2.37 as at 30 June 2026.
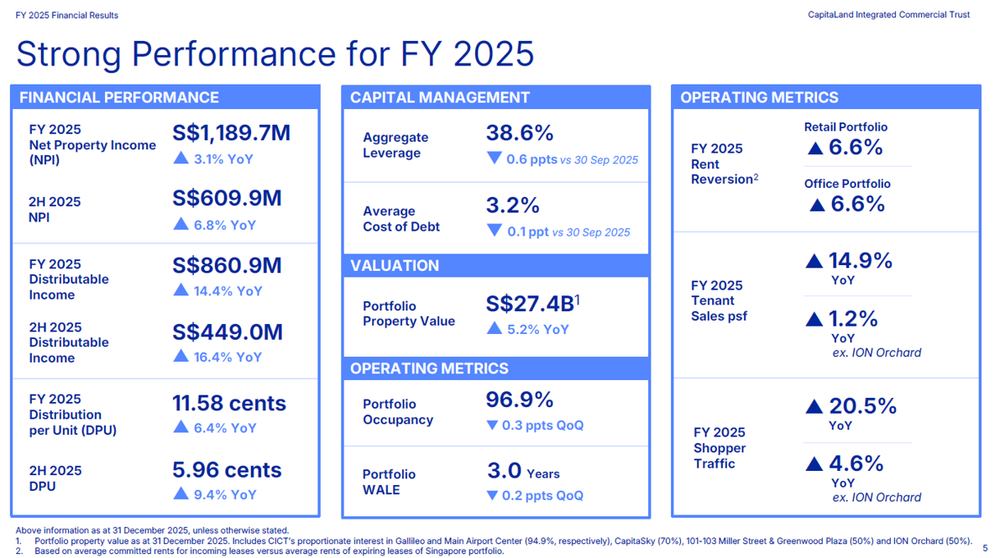
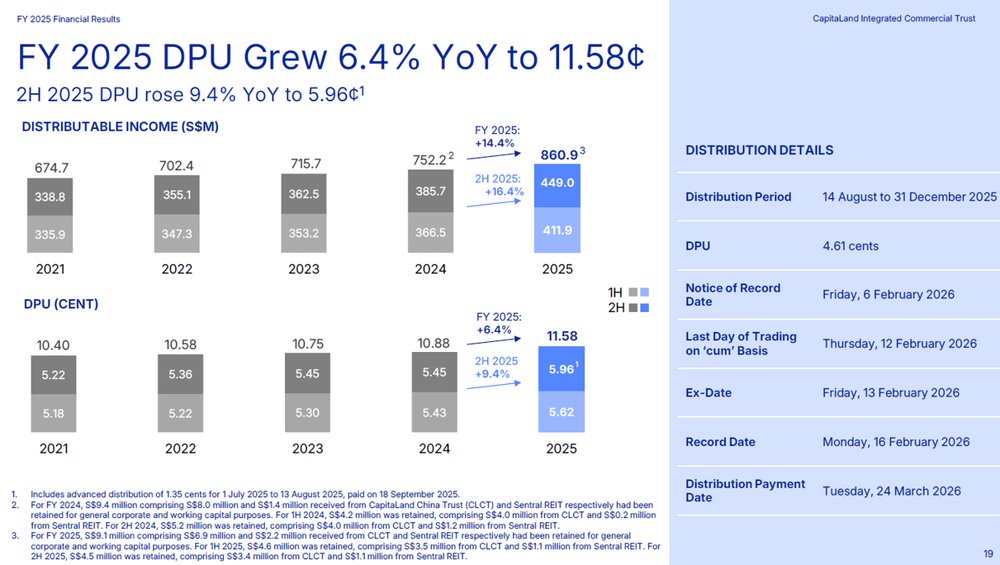
In FY25, CICT delivered its sixth consecutive year of DPU growth since the pandemic, with FY25 DPU up 6.4% year-on-year to 11.58 cents (2H25: 5.96 cents, +9.4% year-on-year).
Distributable income grew a faster 14.4% year-on-year to S$860.9 million, outpacing the 3.1% year-on-year rise in net property income — the gap reflects lower financing costs and the consolidation of CapitaSpring following the buy-out of the remaining 55% stake in August 2025.
Gross revenue rose a more modest 2.1% year-on-year to S$1,619.2 million, underlining that most of the DPU growth this year came from capital management and portfolio reshaping rather than organic rental growth alone.
CICT reported DPU Singapore cents 11.58 in FY25, up 6.4% year-on-year.
This is despite a private placement of 284.36 million in new units in August 2025. The proceeds from the placement was to partly fund the purchase of 55% interest in CapitaSpring. Despite the dilution from new units issued, around 3.9%, CICT reported a higher DPU for FY25.
CICT's aggregate leverage remained stable at 38.6% as at end-2025 (vs. 38.5% a year ago), comfortably below the MAS regulatory limit.
The prudent leverage level provides financial flexibility for acquisitions and asset enhancement initiatives while keeping interest costs manageable, helping to preserve distributable income.
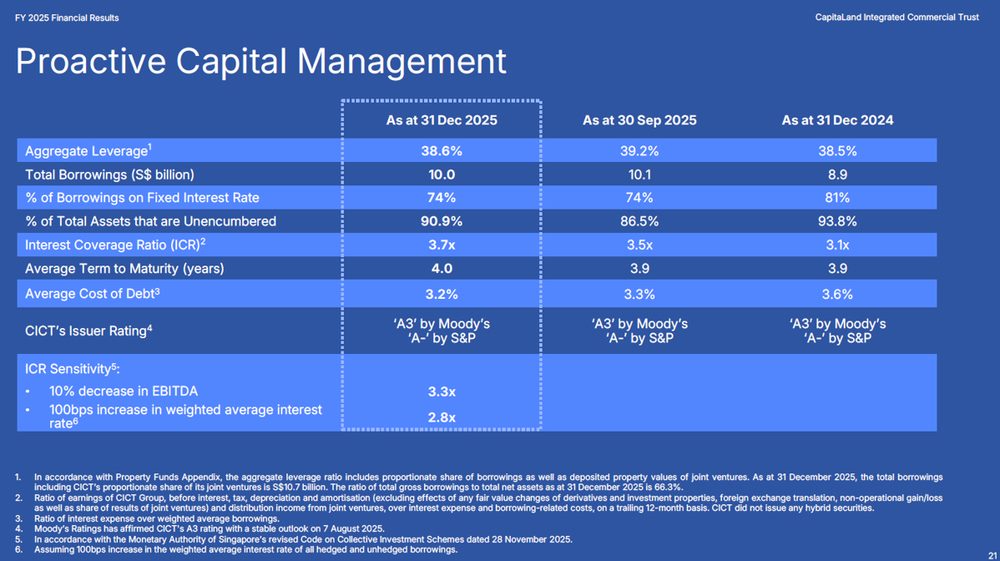
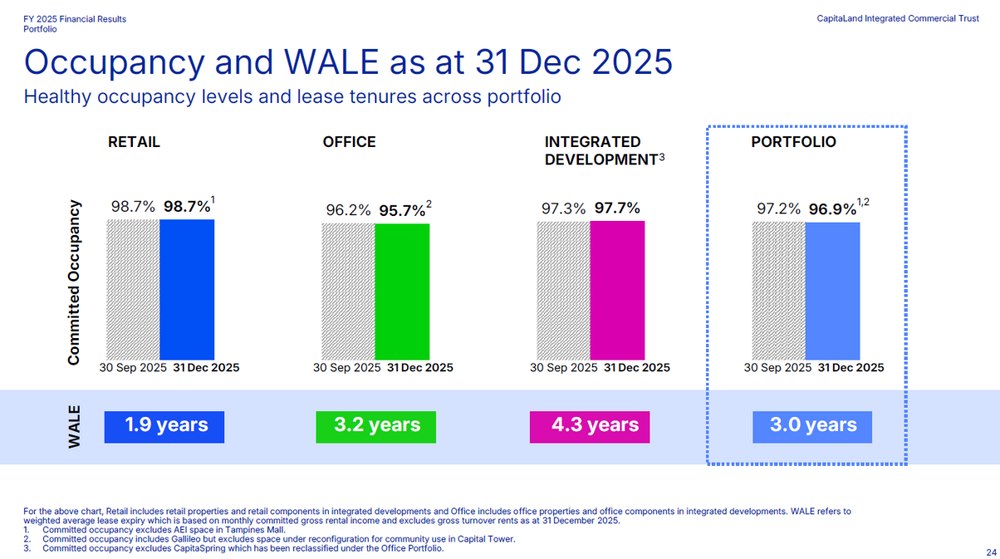
Portfolio committed occupancy stood at 96.9% as at 31 Dec 2025 (retail 98.7%, office 95.7%, integrated developments 97.7%), with a portfolio WALE of 3.0 years.
Retail rent reversion came in at +6.6% for FY25 (downtown +6.2%, suburban +7.2%), which management has flagged as a "positive but sustainable" pace it intends to maintain into FY26 rather than push further.
On the office side, average expiring rents for 2026 (S$11.72 psf) and 2027 (S$11.86 psf) both sit below the current market rent of S$12.30 psf, which points to further reversion upside as these leases roll over.
Looking at CICT through Income Pot framework, the stock still screens strongly across the key factors we track.
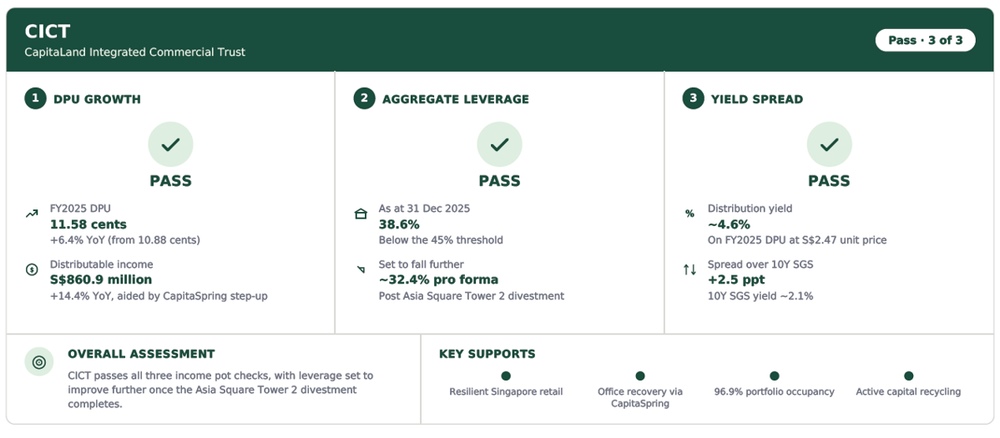
Overall, CICT passes all three of our Income checks.
Distribution per unit should not be compared directly across REITs, as their unit prices are different.
This is why distribution yield remains useful, as it shows the expected income return relative to the current unit price.
As of the closing prices on 2 July 2026, CICT was trading at S$2.39.
Based on FY2026 dividend estimates, this implies a distribution yield of about 5.0%.
The business has DPU growth, manageable aggregate leverage and an attractive dividend yield.
Find out how much dividends you would have received as a shareholder of CapitaLand Integrated Commercial Trust in the past 12 months with the calculator below.
Related links:
- Capitaland Integrated Commercial Trust latest valuation, share price and analysis
- Capitaland Integrated Commercial Trust dividend history and dividend forecast
#2 – Keppel DC REIT (SGX: AJBU)
Keppel DC REIT is Asia's first pure-play data centre REIT, owning a portfolio of data centres across Asia Pacific and Europe. It benefits from structural demand for digital infrastructure, supported by long-term leases and high-quality tenants.
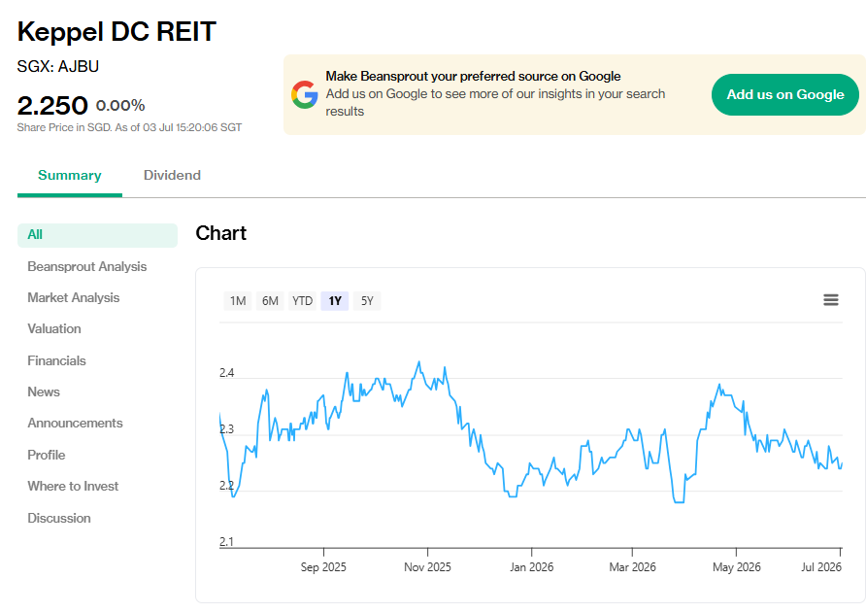
Its share price rose about 1.9% in 1H 2026 to around S$2.25 as at 30 June 2026.
Keppel DC REIT posted the strongest income growth of the three.
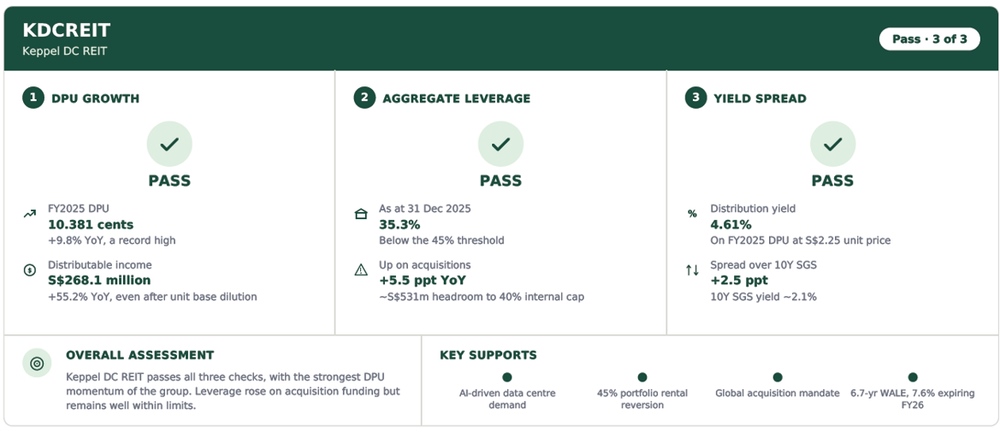
Keppel DC REIT reported DPU Singapore cents 10.38 in FY25, increased by 9.8% year-on-year.
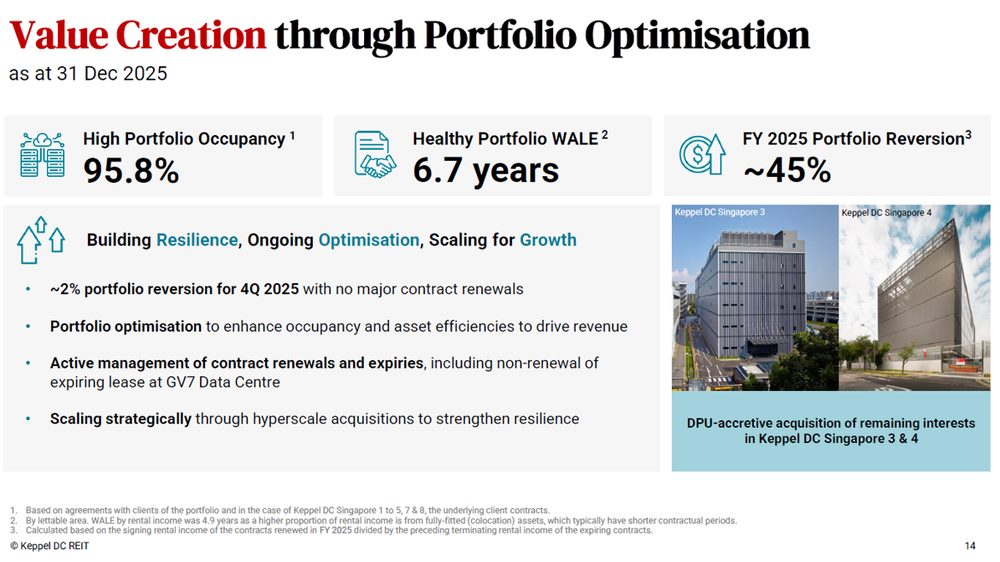
Distributable income surged 55.2% to S$268.1 million, driven by the acquisitions of Tokyo Data Centre 3 and the remaining interests in Keppel DC Singapore 3, 4, 7 & 8, alongside an exceptionally strong ~45% portfolio rental reversion for the year.
Similarly, Keppel DC REIT has issued 180.56 million new units in August 2025, representing 8% in dilution. The proceeds, equivalent to around S$404.5 million, was raised to fund the purchase of Tokyo Data Centre 3.
As the acquisition was yield accretive and the underlying operations improved, KDCREIT was still able to register DPU growth.
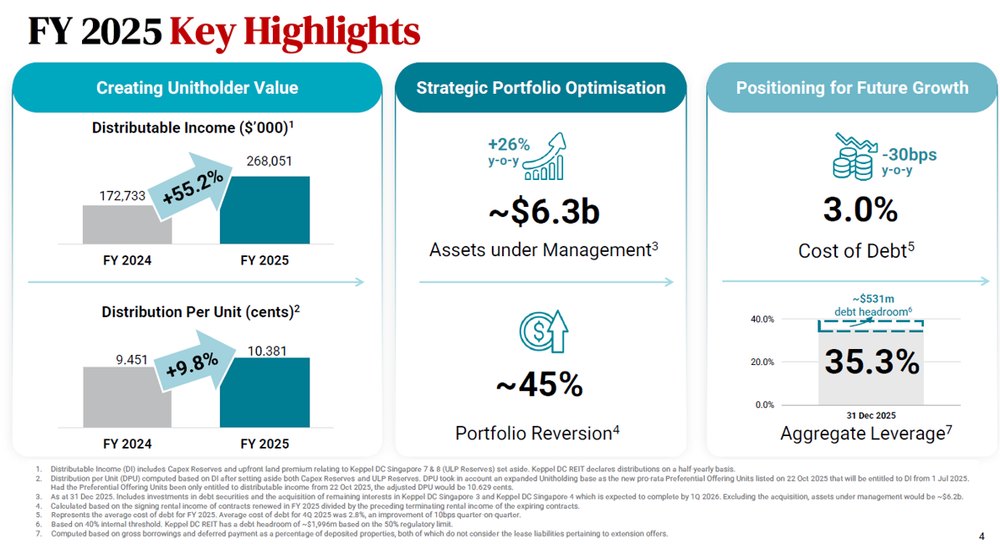
Assets under management grew 26% YoY to ~S$6.3 billion. The REIT sits squarely on the structural artificial intelligence /cloud demand theme.
Portfolio occupancy was 95.8% with a WALE of 6.7 years as at 31 Dec 2025 — the longest WALE of the three REITs, though this blends a much shorter 3.2-year WALE for fully-fitted colocation contracts (72.7% of rental income) against a 9.6-year WALE for single-tenant leases.
Keppel DC REIT has maintained aggregate leverage at 35.3% as at 31 December 2025, below our threshold of 45%. As at 31 March 2026, aggregate leverage improved further to 35.1%.
For FY2025, Keppel DC REIT paid total dividends of 10.38 cents per share, comprising an interim dividend of 5.13 cents and a final dividend of 5.25 cents.
Based on the FY2025 dividend and Keppel DC REIT’s share price of S$2.25 as at 30 June 2026, the historical dividend yield is about 4.6%.
Overall, Keppel DC REIT’s latest numbers also hold up well when viewed through Beansprout Income framework.
Find out how much dividends you would have received as a shareholder of Keppel DC REIT in the past 12 months with the calculator below.
Related links:
- Keppel DC REIT latest valuation, share price and analysis
- Keppel DC REIT dividend history and dividend forecast
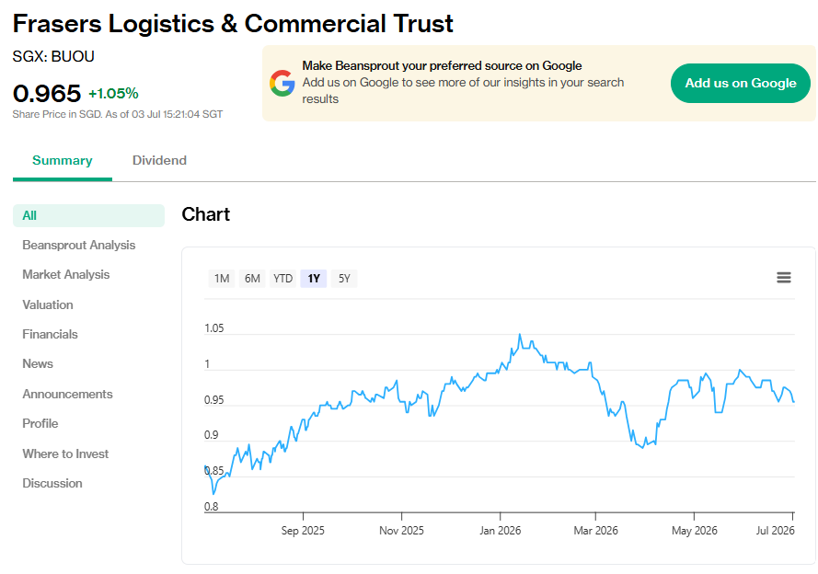
#3 – Fraser Logistics and Commercial Trust (SGX: BUOU)
Fraser Logistics and Commercial Trust (FLCT) is a diversified logistics and commercial REIT with assets across Australia, Europe and Singapore. Its portfolio is anchored by logistics assets with long WALEs, complemented by a smaller commercial portfolio that provides income diversification.
FLCT's share price was flattish in 1H 2026, at around S$0.955 as at 30 June 2026.
FLCT posted a steady FY2025 performance, benefiting from strong leasing execution, reflected in a portfolio reversion of 29.5% and occupancy of 95.1%.
Revenue rose by 5.6% year-on-year in FY2025, supported by contributions from recent acquisitions and positive rental growth.
However, distributable income and DPU declined as the benefits of portfolio expansion were more than offset by higher finance costs from refinancing and acquisition-related borrowings, as well as increased tax expenses.
Finance costs increased by 26.4% year-on-year to S$83.0 million in FY25.
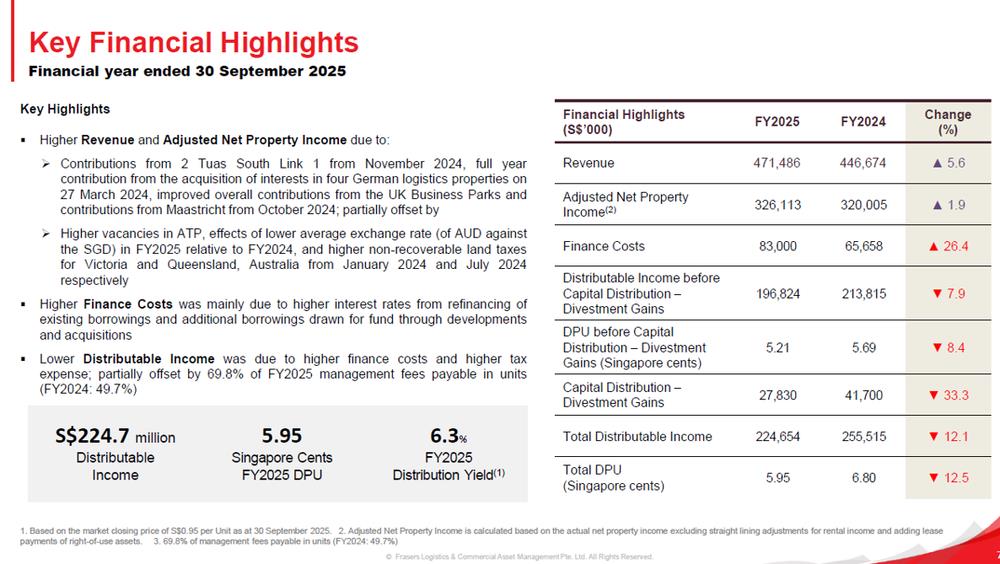
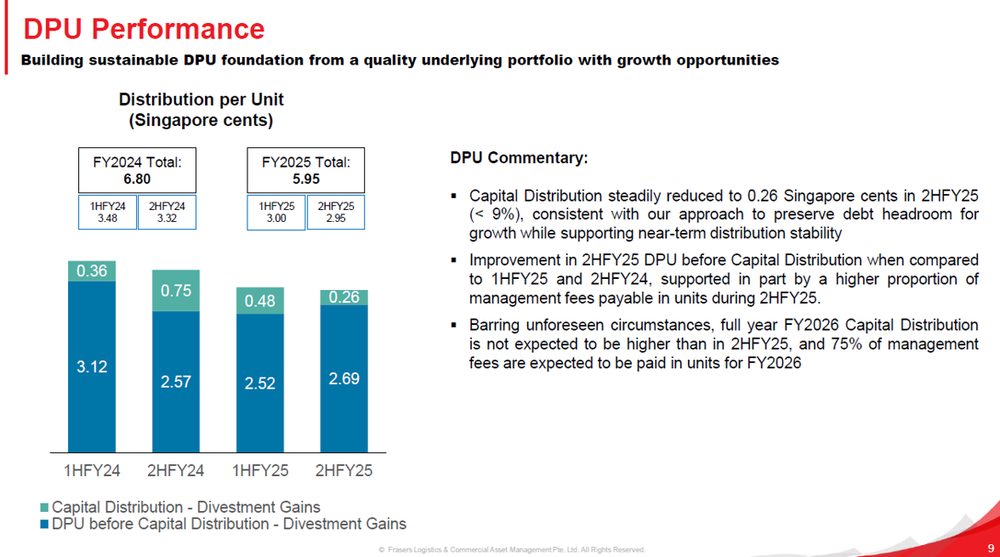
FLCT’s FY25 DPU declined 12.5% year-on-year to Singapore cents 5.95. The lower DPU was mainly attributed to higher financing costs and lower capital distribution.
FLCT was trading at S$0.955, implying a historical dividend yield of 6.2%. However, do note that FLCT will continue to apply some capital distribution in FY26, capped at S$0.0026 per unit. In addition, 75% of the management fees are expected to be paid in units for FY26.
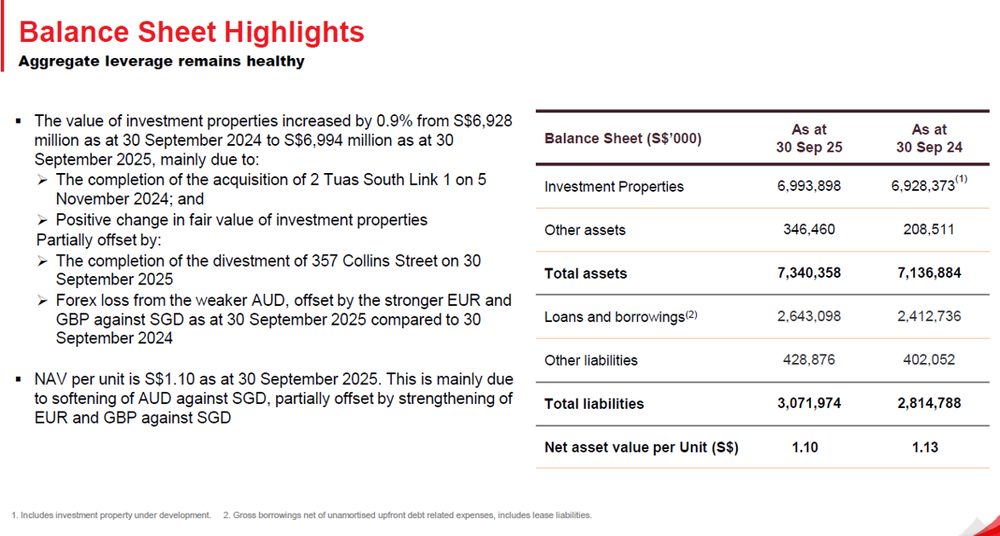
FLCT maintained a healthy balance sheet in FY2025, with investment properties increasing to S$7.0 billion following acquisitions and positive fair value gains. While borrowings rose to fund growth initiatives, aggregate leverage remained prudent at 35.7%, preserving financial flexibility.
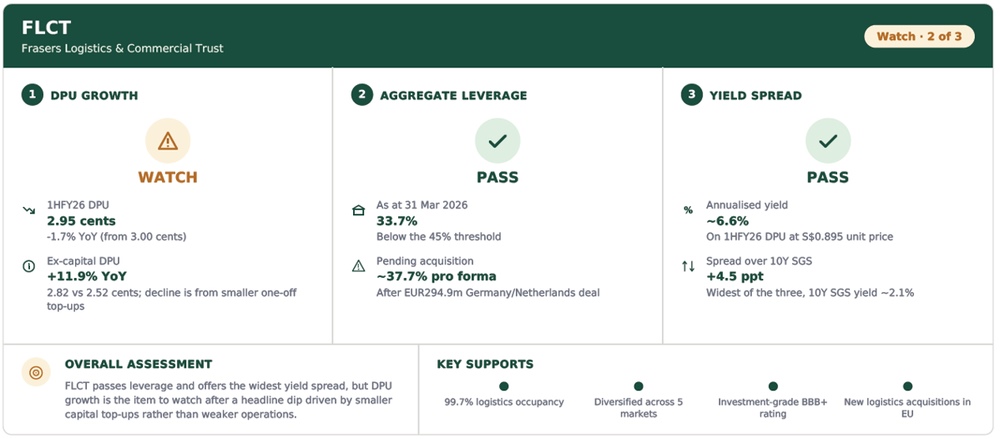
For FLCT, it fails the DPU-growth check on a headline basis — though the underlying number excluding capital distributions actually improved.
Leverage at 33.7% and a yield spread of roughly 4.5 ppt over the risk-free rate both stay well within bound.
Find out how much dividends you would have received as a shareholder of Fraser Logistics & Commercial Trust in the past 12 months with the calculator below.
Related links:
- Fraser Logistics & Commercial Trust latest valuation, share price and analysis
- Fraser Logistics & Commercial Trust dividend history and dividend forecast
What would Beansprout do?
The share prices of Singapore REITs have been weak in the first half of 2026,
Despite the headwinds, CICT, Keppel DC REIT and FLCT have held up best amongst the blue chip REITs.
When evaluating REITs to put into my income pot in Beansprout’s four pots of wealth, I would look at their fundamentals, financial strength and dividend yield.
Among the three, Keppel DC REIT stands out for its stronger DPU growth, healthy gearing and attractive FY2026 distribution yield. Keppel DC REIT forward distribution yield of about 4.5% may not be the highest among the three, but it appears better supported by DPU growth and a longer WALE. Learn more about Keppel DC REIT latest valuation and dividend analysis here.
CICT also looks resilient, supported by positive rental reversions and stronger DPU growth than FLCT. Based on FY2026 dividend estimates, CICT offers a forward distribution yield of about 5.0%, which may appeal to income investors looking for exposure to Singapore retail and office assets. However, its shorter WALE means income visibility is not as strong as Keppel DC REIT. Learn more about Capitaland Integrated Commercial Trust latest valuation and dividend analysis here.
FLCT remains financially sound, with a healthy balance sheet and an underlying distribution yield above 5%. Its historical distribution yield of about 6.2% is the highest among the three, but part of the distribution includes a capital top-up. I would therefore separate recurring income from capital return when assessing its longer-term dividend yield. Learn more about Fraser Logistics & Commercial Trust latest valuation and dividend analysis here.
Overall, Keppel DC REIT and CICT screen better than FLCT based on my selection criteria for Singapore REITs, while FLCT will have to demonstrate clearer recovery in distributable income.
You can learn more about how I check the three simple checks I use to screen Singapore REITs for passive income here.
To screen for Singapore REITs with lowest price-to-book valuation or highest dividend yield, check out our best Singapore REIT screener.
| Stock | The good | Key risks |
| CICT |
|
|
| Keppel DC REIT |
|
|
| FLCT |
|
|
We still see Singapore stocks as a core part of a globally diversified portfolio, especially for investors looking for dividend income.
However, rather than relying too heavily on REITs alone, I would build a broader mix of income sources, including quality Singapore blue-chip stocks with sustainable dividends, resilient earnings and strong balance sheets. Learn more about how to build passive income streams with our income pot here.
If you are looking for more Singapore stock ideas linked to long-term growth themes, you can explore our high-conviction curated stock opportunities here.
Is there a Singapore REIT market you are looking out for in the second half of 2026? Share with us in the comments below or in our Telegram group!
If you are new to investing in Singapore REITs, you can start to learn more about Singapore REITs here.
If you prefer diversification without picking individual REITs, you can also gain exposure through Singapore REIT ETFs.
Planning to invest in Singapore blue chip REITs? Compare the best Singapore brokers to find the right trading platform, and see the latest promotions and sign-up rewards available.
Follow Beansprout on YouTube, Facebook and Instagram, and add Beansprout as your preferred source on Google so you never miss an update.
Read also
Gain financial insights in minutes
Subscribe to our free weekly newsletter for more insights to grow your wealth
Most Popular

Comments
0 comments