3 ETFs that offer broad diversification for long term growth
ETFs
By Gerald Wong, CFA • 29 Mar 2026
Why trust Beansprout? We’ve been awarded Best Investment Website at the SIAS Investors’ Choice Awards 2025
'%3e%3cpath%20fill-rule='evenodd'%20clip-rule='evenodd'%20d='M17.64%209.20455C17.64%208.56637%2017.5827%207.95273%2017.4764%207.36364H9V10.845H13.8436C13.635%2011.97%2013.0009%2012.9232%2012.0477%2013.5614V15.8195H14.9564C16.6582%2014.2527%2017.64%2011.9455%2017.64%209.20455V9.20455Z'%20fill='%234285F4'/%3e%3cpath%20fill-rule='evenodd'%20clip-rule='evenodd'%20d='M9%2018C11.43%2018%2013.4673%2017.1941%2014.9564%2015.8195L12.0477%2013.5614C11.2418%2014.1014%2010.2109%2014.4205%209%2014.4205C6.65591%2014.4205%204.67182%2012.8373%203.96409%2010.71H0.957275V13.0418C2.43818%2015.9832%205.48182%2018%209%2018V18Z'%20fill='%2334A853'/%3e%3cpath%20fill-rule='evenodd'%20clip-rule='evenodd'%20d='M3.96409%2010.71C3.78409%2010.17%203.68182%209.59318%203.68182%209C3.68182%208.40682%203.78409%207.83%203.96409%207.29V4.95818H0.957273C0.347727%206.17318%200%207.54773%200%209C0%2010.4523%200.347727%2011.8268%200.957273%2013.0418L3.96409%2010.71V10.71Z'%20fill='%23FBBC05'/%3e%3cpath%20fill-rule='evenodd'%20clip-rule='evenodd'%20d='M9%203.57955C10.3214%203.57955%2011.5077%204.03364%2012.4405%204.92545L15.0218%202.34409C13.4632%200.891818%2011.4259%200%209%200C5.48182%200%202.43818%202.01682%200.957275%204.95818L3.96409%207.29C4.67182%205.16273%206.65591%203.57955%209%203.57955V3.57955Z'%20fill='%23EA4335'/%3e%3c/g%3e%3cdefs%3e%3cclipPath%20id='clip0_0_2849'%3e%3crect%20width='18'%20height='18'%20fill='white'/%3e%3c/clipPath%3e%3c/defs%3e%3c/svg%3e)
Make Beansprout your preferred source on Google
Add us on Google to see more of our insights in your search results
We compare VOO, VWRA and the Amova Singapore STI ETF for investors seeking long term growth and diversification, including key factors to consider before investing.
What happened?
Markets have been volatile for the past weeks.
Recent market swings have pushed many to think more carefully about diversification and how they want to position for long-term growth.
With the escalation in the Middle East conflict, oil prices have surged to their highest levels and the US Federal Reserve has warned about higher inflation.
In light of this, we looked at 3 SGX ETFs with dividend yields above 6% and 3 Singapore REITs with dividend yields above 6% for income ideas.
We also examined 3 worst-performing Singapore blue chip stocks year-to-date in March 2026 and see if there are any opportunities for turnaround.
However, some of us may not have the time or conviction to build a portfolio through individual stock picking alone.
This led me to look at a few well-known index ETFs which may provide long-term growth and diversification.
In this article, I’ll be examining what they invest in, how they have performed, and what investors may want to watch before building a position.
3 ETFs that offer broad diversification for long term growth
#1 - Vanguard FTSE All-World UCITS ETF (VWRA)
If I want a single ETF that gives me broad exposure across global markets, Vanguard FTSE All-World UCITS ETF (VWRA) is one of the simplest ways to do it.
VWRA tracks the FTSE All-World Index, which includes large and mid-sized companies in both developed and emerging markets.
That means when I buy VWRA, I am not just investing in the US, but also in markets such as Japan, the UK, China and Canada through a single fund.
As of 28 February 2026, VWRA had US$59.5 billion in total assets, US$36.3 billion in share class assets, an ongoing charges figure of 0.19%, and 3,798 holdings.
This makes it a straightforward option if I want a globally diversified equity ETF without having to decide how much to allocate to each market myself.
VWRA is the USD accumulating share class of the Vanguard FTSE All-World UCITS ETF.
The dividends from the underlying holdings are reinvested within the fund rather than paid out as cash to investors.
It is also explicitly identified as a UCITS fund domiciled in Ireland.
The main appeal of VWRA is that it gives investors access to a much broader opportunity set in a single ETF.
That said, VWRA is not evenly spread across countries. The United States made up 59.7% of the portfolio, followed by Japan at 6.3%, the United Kingdom at 3.6%, China at 3.2%, and Canada at 3.1%. So while VWRA is clearly more diversified than VOO, a large part of its performance is still influenced by the US market.
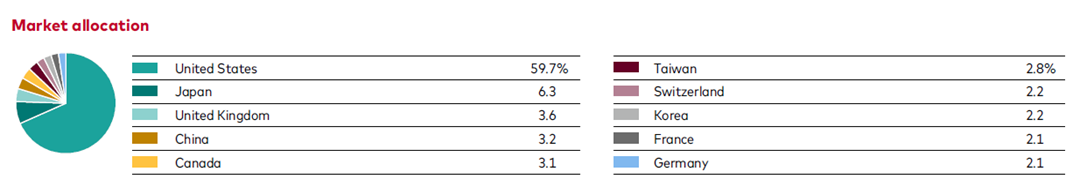
Source: VWRA Factsheet as of 28 February 2026
Its top 10 holdings still include familiar names such as NVIDIA, Apple, Alphabet, Microsoft and Amazon, but those top 10 positions make up only 23.1% of net assets, which is materially less concentrated than VOO.
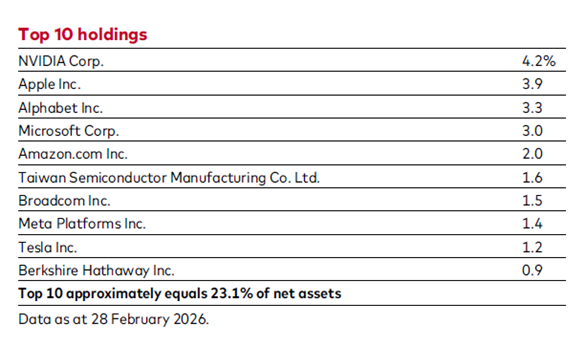
This is why VWRA often stands out for investors who want a simple long-term equity core without deciding themselves how much to allocate to the US, Europe, Asia or emerging markets.
The trade-off is that it is more expensive than VOO, and during periods when the US market clearly outperforms, it may lag a US-only ETF.
If VOO represents the case for a low-cost, US-focused core holding, VWRA represents the case for taking a broader approach by combining global diversification with an Ireland-domiciled structure in a single ETF.
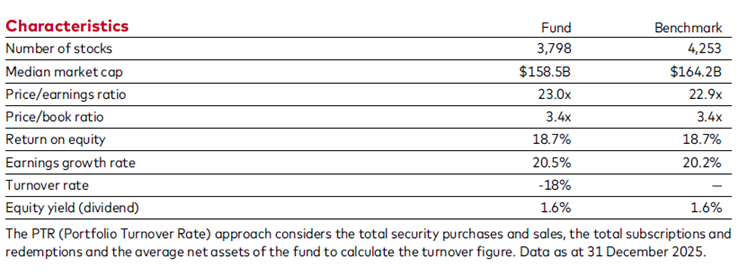
VWRA also has an underlying equity yield (dividend) of 1.6% in the latest factsheet.
However, because this is an accumulating share class, that figure refers to the dividend yield of the underlying holdings, not a cash payout yield received directly by investors.
In practice, the income is reinvested within the fund, which may suit investors who prefer automatic compounding over regular cash distributions.
Because VWRA is Ireland-domiciled, US dividend withholding tax on the fund’s underlying US holdings is generally 15% at the fund level under the US-Ireland treaty.
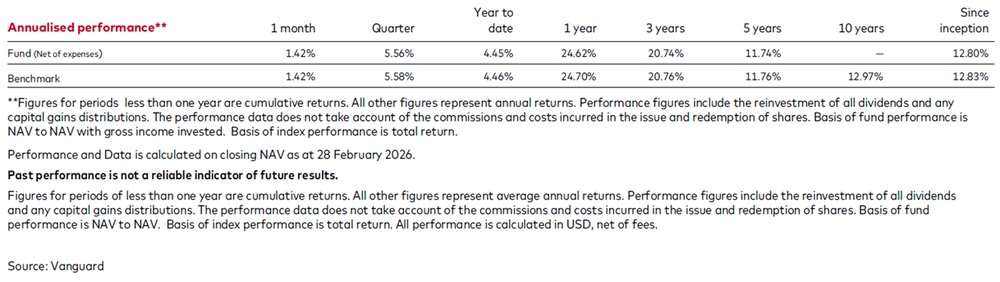
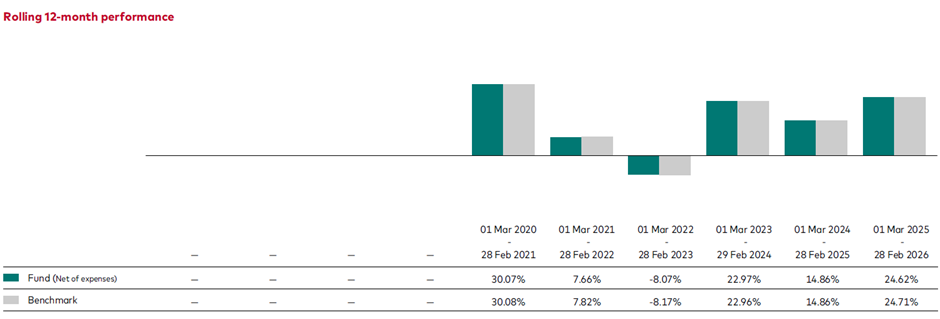
In terms of performance, VWRA delivered a 24.62% 1-year return, 20.74% annualised over 3 years and 11.74% annualised over 5 years as of 28 February 2026.
Find out how VWRA ETF offers an easy way to benefit from investing in the global equity market.
| Vanguard FTSE All-World UCITS ETF (VWRA) | |
| Inception date | 23-Jul-19 |
| What it tracks | FTSE All-World Index |
| Market exposure | Developed and emerging market stocks globally |
| Domicile | Ireland |
| Listing Exchange | LSE |
| Holdings | 3,798 |
| Fund size | US$59.5 billion total assets; US$36.3 billion share class assets |
| Total expense ratio | 0.19% |
| Dividend treatment | Accumulating |
| Yield | 1.6% (Underlying equity yield) |
| 1-year return | 24.62% |
| 3-year annualised return | 20.74% |
| 5-year annualised return | 11.74% |
| Tax point for Singapore investors | Ireland-domiciled; US dividend withholding leakage generally 15% at fund level on US holdings |
| Source: Source: VWRA Factsheet as of 28 February 2026 *Past performance is not indicative of future performance. | |
#12- Vanguard S&P 500 ETF (VOO)
If I want simple exposure to large US companies, the Vanguard S&P 500 ETF (VOO) is one of the most straightforward ways to get it.
The Vanguard S&P 500 ETF is designed to track the S&P 500 Index.
The S&P 500 Index is a widely used benchmark made up of 500 leading companies in various industries of the US economy, so buying VOO gives me exposure to a large part of the US stock market through a single ETF.
As of 31 December 2025, VOO had US$839.1 billion in ETF net assets, an expense ratio of 0.03%, and 504 holdings.
That continues to make it one of the simplest and lowest-cost ways to invest in large-cap US equities.
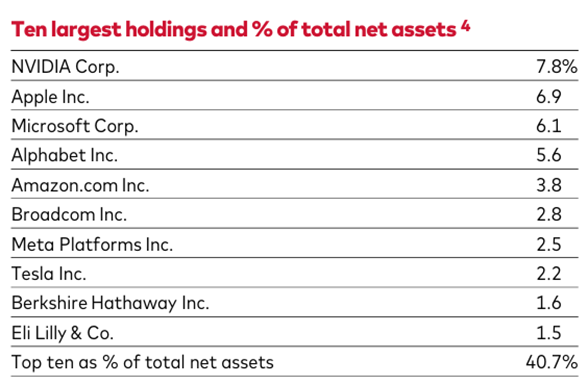
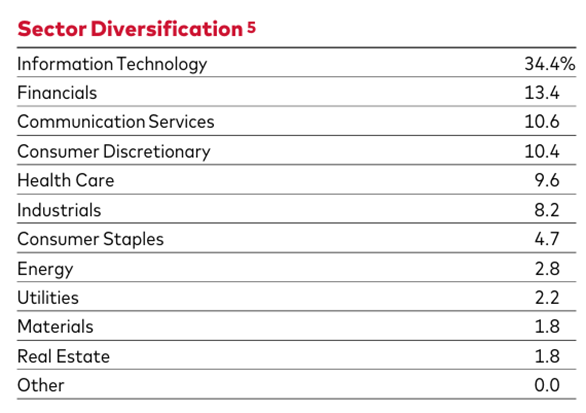
The top 10 holdings made up 40.7% of VOO’s total net assets, while information technology accounted for 34.4% of the portfolio as of 31 December 2025.
These top holdings include many familiar names, such as NVIDIA, Apple, Microsoft, Alphabet, Amazon, Meta Platforms, Tesla and Berkshire Hathaway.
In other words, VOO is broad within the US market, but it is still meaningfully shaped by the largest companies and sectors driving US equity returns.
That can work well if I am comfortable with the US continuing to lead over the long term, or if I want a low-cost US core and am prepared to diversify elsewhere.
VOO is also a quarterly distributing ETF, which means I would receive cash dividends at regular intervals rather than having them automatically reinvested within the fund.
The fund’s equity yield (dividend) was listed at 1.1% (as of 31 December 2025).
That means VOO is primarily a growth-oriented US equity ETF, with income playing a secondary role rather than being the main attraction.
For Singapore investors, there is also a tax point to consider.
Because VOO is a US-domiciled ETF, US-source income paid to a foreign person is generally subject to 30% withholding tax. This is one reason why some investors may compare VOO with an Ireland-domiciled alternative such as VWRA.
In terms of performance, VOO delivered a 16.95% 1-year NAV return, 21.77% annualised over 3 years and 14.15% annualised over 5 years as of 28 February 2026.
| Vanguard S&P 500 ETF (VOO) | |
| Inception date | 7-Sep-10 |
| What it tracks | S&P 500 Index |
| Market exposure | US large-cap stocks |
| Domicile | United States |
| Listing Exchange | NYSE |
| Holdings | 504 |
| Fund size | US$839.1 billion ETF net assets |
| Ongoing cost / TER | 0.03% expense ratio |
| Dividend treatment | Quarterly distributions |
| Income / yield | 1.09% |
| 1-year return | 16.95% (as of 28 February 2026) |
| 3-year annualised return | 21.77% (as of 28 February 2026) |
| 5-year annualised return | 14.15% (as of 28 February 2026) |
| Tax point for Singapore investors | US dividends generally subject to 30% withholding tax |
| Source: Vanguard S&P 500 ETF factsheet as of 31 December 2026 *Past performance is not indicative of future performance. | |
Explore the best S&P 500 ETFs here.
#3 - Amova Singapore STI ETF
If I want broad exposure to Singapore blue chips through a single ETF, the Amova Singapore STI ETF (G3B/GAB) is one of the most direct ways to get it.
The Amova Singapore STI ETF is a Singapore-listed ETF designed to replicate the performance of the Straits Times Index as closely as possible before expenses.
The Straits Times Index (STI) represents the top 30 companies listed on the SGX Mainboard ranked by full market capitalisation.
For Singapore investors, that makes it the most familiar option in this comparison.
The Amova Singapore STI ETF is slightly different because it has both a distributing class and an accumulating class listed on SGX.
The SGD (Dist) Class trades under stock code G3B and pays semi-annual distributions at the manager’s discretion, while the SGD (Acc) Class trades under stock code GAB and reinvests distributions within the fund instead.
That gives me more flexibility depending on whether I want visible income or automatic reinvestment.
The Amova Singapore STI ETF has a total expense ratio of 0.24%, and a fund size of around S$1.32 billion as of 28 February 2026.
The ETF can be bought from 1-unit lots on SGX and is available through cash, SRS or CPFIS-OA, which may make it more accessible for Singapore investors building a local allocation.
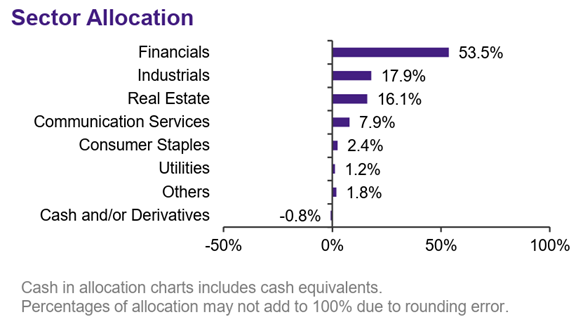
As of 28 February 2026, the three largest holdings were DBS Group, OCBC and UOB, which together made up 50.3% of the portfolio.
This means the ETF is still heavily shaped by the performance of the local banks. That can work well if I want direct exposure to Singapore’s banking sector and broader local equity market.
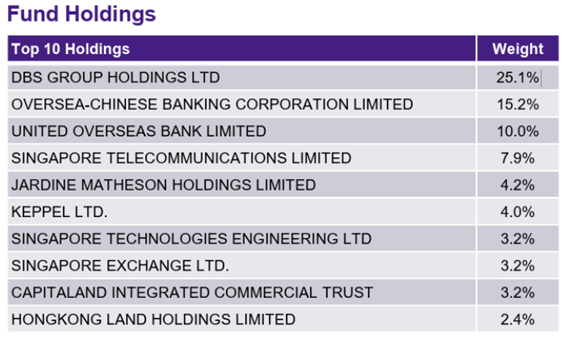
It is better understood as a Singapore market anchor than as a globally diversified equity core.
For investors who care about income, the Amova Singapore STI ETF currently offers the highest visible cash yield of the three.
Based on the latest published distributions and NAV, its trailing 12-month distribution yield is about 3.7%. That makes it more relevant if I want a Singapore equity ETF that can also provide a visible income stream.
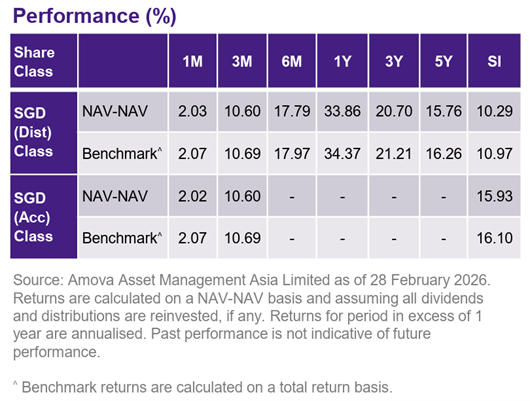
In terms of performance, it had 33.86% 1-year NAV return, 3-year annualised return of 20.70%, and 15.76% annualised over 5 years for the SGD distributing class as of 28 February 2026.
| Amova Singapore STI ETF (G3B / GAB) | |
| Inception date | 24-Feb-09 |
| What it tracks | Straits Times Index |
| Market exposure | 30 Singapore blue-chip stocks |
| Domicile | Singapore |
| Listing Exchange | SGX |
| Holdings | 30 |
| Fund size | S$1.32 billion |
| Total expense ratio | 0.24% |
| Dividend treatment | G3B for semi-annual distributions |
| GAB for accumulating class | |
| Income / yield | Trailing cash yield: ~3.7% (as of 23 March 2026) |
| 1-year return | 33.86% |
| 5-year annualised return | 15.76% |
| Tax point for Singapore investors | Singapore currently does not impose withholding tax on dividends |
| Source: Amova Singapore STI ETF factsheet as of 28 February 2026 *Past performance is not indicative of future performance. | |
Learn further on how to exposure to Singapore’s stock market via the Amova Singapore STI ETF here.
We compare the Amova Singapore STI ETF and SPDR STI ETF and share our considerations on both STI ETF.
How do VWRA, VOO and the Amova Singapore STI ETF compare?
Vanguard FTSE All-World UCITS ETF (VWRA) is a broader global equity ETF, Vanguard S&P 500 ETF (VOO) is a focused allocation to large US companies, and the Amova Singapore STI ETF is a Singapore blue-chip allocation.
In terms of size, VOO is by far the largest, with US$839.1 billion in ETF net assets. VWRA is also sizeable, with US$59.5 billion in total assets, while the Amova Singapore STI ETF has a fund size of about S$1.32 billion.
If diversification is the main priority, VWRA stands out. It gives exposure across developed and emerging markets in one fund, whereas VOO is entirely focused on the US and the Amova Singapore STI ETF is focused on Singapore.
If cost is the main focus, VOO is the cheapest of the three with an expense ratio of 0.03%. VWRA is higher at 0.19% total expense ratio, while the Amova Singapore STI ETF has a total expense ratio of 0.24%.
The three ETFs also differ in how returns are delivered. VOO is a quarterly distributing ETF, VWRA is an accumulating ETF that reinvests dividends, while the Amova Singapore STI ETF offers both a distributing class and an accumulating class.
In terms of performance among the three ETFS as of 28 February 2026, the Amova Singapore STI ETF’s SGD (Dist) Class delivered the highest 1-year return of 33.86%, and VOO delivered the highest 3-year and 5-year annualised return of 21.77% and 14.15% respectively.
Tax and access are also important considerations.
VOO, as a US-domiciled ETF, is subject to US dividend withholding tax, which can reduce the income investors receive. VWRA, being Ireland-domiciled, is generally more tax-efficient for US dividend exposure. The Amova Singapore STI ETF does not have this issue, which may make it more straightforward for investors looking for local market exposure.
Broker access is another factor. VOO is typically the easiest to buy as it is listed in the US. The Amova Singapore STI ETF is available on SGX and can be invested using cash, SRS or CPF. VWRA is listed in London, and not all brokers in Singapore offer access to the London market, which may make it slightly less convenient for some investors.
| ETF | Vanguard S&P 500 ETF (VOO) | Vanguard FTSE All-World UCITS ETF (VWRA) | Amova Singapore STI ETF (G3B / GAB) |
| Inception date | 7-Sep-10 | 23-Jul-19 | 24-Feb-09 |
| What it tracks | S&P 500 Index | FTSE All-World Index | Straits Times Index |
| Market exposure | US large-cap stocks | Developed and emerging market stocks globally | 30 Singapore blue-chip stocks |
| Domicile | United States | Ireland | Singapore |
| Listing Exchange | NYSE | LSE | SGX |
| Holdings | 504 | 3,798 | 30 |
| Fund size | US$839.1 billion ETF net assets | US$59.5 billion total assets; US$36.3 billion share class assets | S$1.32 billion |
| Total expense ratio | 0.03% | 0.19% | 0.24% |
| Dividend treatment | Quarterly distributions | Accumulating | G3B for semi-annual distributions GAB for accumulating class |
| Income / yield | 30-day SEC yield: 1.09% | Underlying equity yield: 1.6% | Trailing cash yield: ~3.7% |
| 1-year return | 16.95% | 24.62% | 33.86% |
| 3-year annualised return | 21.77% | 20.74% | 20.70% |
| 5-year annualised return | 14.15% | 11.74% | 15.76% |
| Tax point for Singapore investors | US dividends generally subject to 30% withholding tax | Ireland-domiciled; US dividend withholding leakage generally 15% at fund level on US holdings | Singapore currently does not impose withholding tax on dividends |
Source: VOO factsheet dated 31 December 2025, VWRA factsheet dated 28 February 2026, and Amova STI ETF official factsheet dated 28 February 2026. SGX ETF Screener. *Returns listed are as of 28 February 2026. Past performance is not indicative of future performance. | |||
What would Beansprout do?
For investors looking for broad based exposure to key markets, these 3 index ETFs allow us to gain access in a simple way.
The Vanguard FTSE All-World UCITS ETF (VWRA) gives me broad exposure across both developed and emerging markets in a single fund. This helps reduce reliance on any one country and keeps things simple if I want a more hands-off approach.
The Vanguard S&P 500 ETF (VOO) offers exposure to large US companies at a low cost. The US market has driven much of global equity returns in recent years, but I would also be mindful that this means being more concentrated in one market and a few large companies.
The Amova Singapore STI ETF provides exposure to familiar blue chip companies in Singapore, offers relatively stable dividends, and can be invested using SRS or CPF, which makes it practical for long-term planning.
To choose between the ETFs, I would consider whether I prioritise global diversification or local income.
Regardless of which ETF you may choose, the key is to invest in a consistent way.
Rather than trying to time the market, I would build my positions gradually through dollar-cost averaging using a regular savings plan, which helps reduce the risk of entering at the wrong time and keeps my approach disciplined, especially during volatile periods.
If you want to estimate how much these index ETFs could grow your capital over time, you can use our compound interest calculator to model different contribution amounts and investment horizons.
To explore more ETFs with a growth-tilted angle, here are 5 SGX ETFs to gain exposure to Asia’s fastest-growing sectors and 7 SGX ETFs to gain exposure to China.
If you are looking to diversify into Singapore REITs, check out the best Singapore REIT ETFs here.
[Beansprout Exclusive Longbridge Promotion] Get bonus S$50 FairPrice voucher within 5 working days, plus 5% p.a. interest boost coupon (worth ~S$100) when you sign up for a Longbridge account via Beansprout. Plus, stand a chance to win 1g of gold bar. Promo ends on 31 March 2026. T&Cs apply. Learn more about the Longbridge promotion here.
Check out the best stock trading platforms in Singapore with the latest promotions to invest in index ETFs.
Enjoyed this insight? Follow Beansprout on Telegram, Youtube, Facebook and Instagram, and add Beansprout as your preferred source on Google so you never miss an update.
Read also
Gain financial insights in minutes
Subscribe to our free weekly newsletter for more insights to grow your wealth
Most Popular

Comments
0 comments